Service-level objective templates
- Latest Dynatrace
- Reference
- 4-min read
 Service-Level Objectives offers a set of pre-configured service-level objective (SLO) templates for some of the primary monitoring domains, which you can use to create your own SLOs.
We also offer a list of SLO examples. For more information on SLO examples, see Service-level objective examples.
See the SLO configuration templates to understand better the service-level indicators (SLIs).
The DQL queries below contain SLO template parameters (for example, $hosts, $services) that the template engine resolves to entity IDs at runtime.
To test these queries in  Notebooks or the DQL editor, replace each
 $ variable with a literal value, such as array("HOST-ABC123").
CPU utilization
This SLI measures the CPU usage of selected hosts over time.
Details of the template
-
Data source: metrics (timeseries)
-
Entity scope: hosts
-
SLI DQL query:
timeseries sli=avg(dt.host.cpu.usage), by: { dt.smartscape.host }| fieldsAdd smartscapeIds = toSmartscapeId(array($hosts)[])| filter in(dt.smartscape.host, smartscapeIds)| fieldsAdd dt.smartscape.entity.name = getNodeName(dt.smartscape.host)| fieldsRemove smartscapeIds
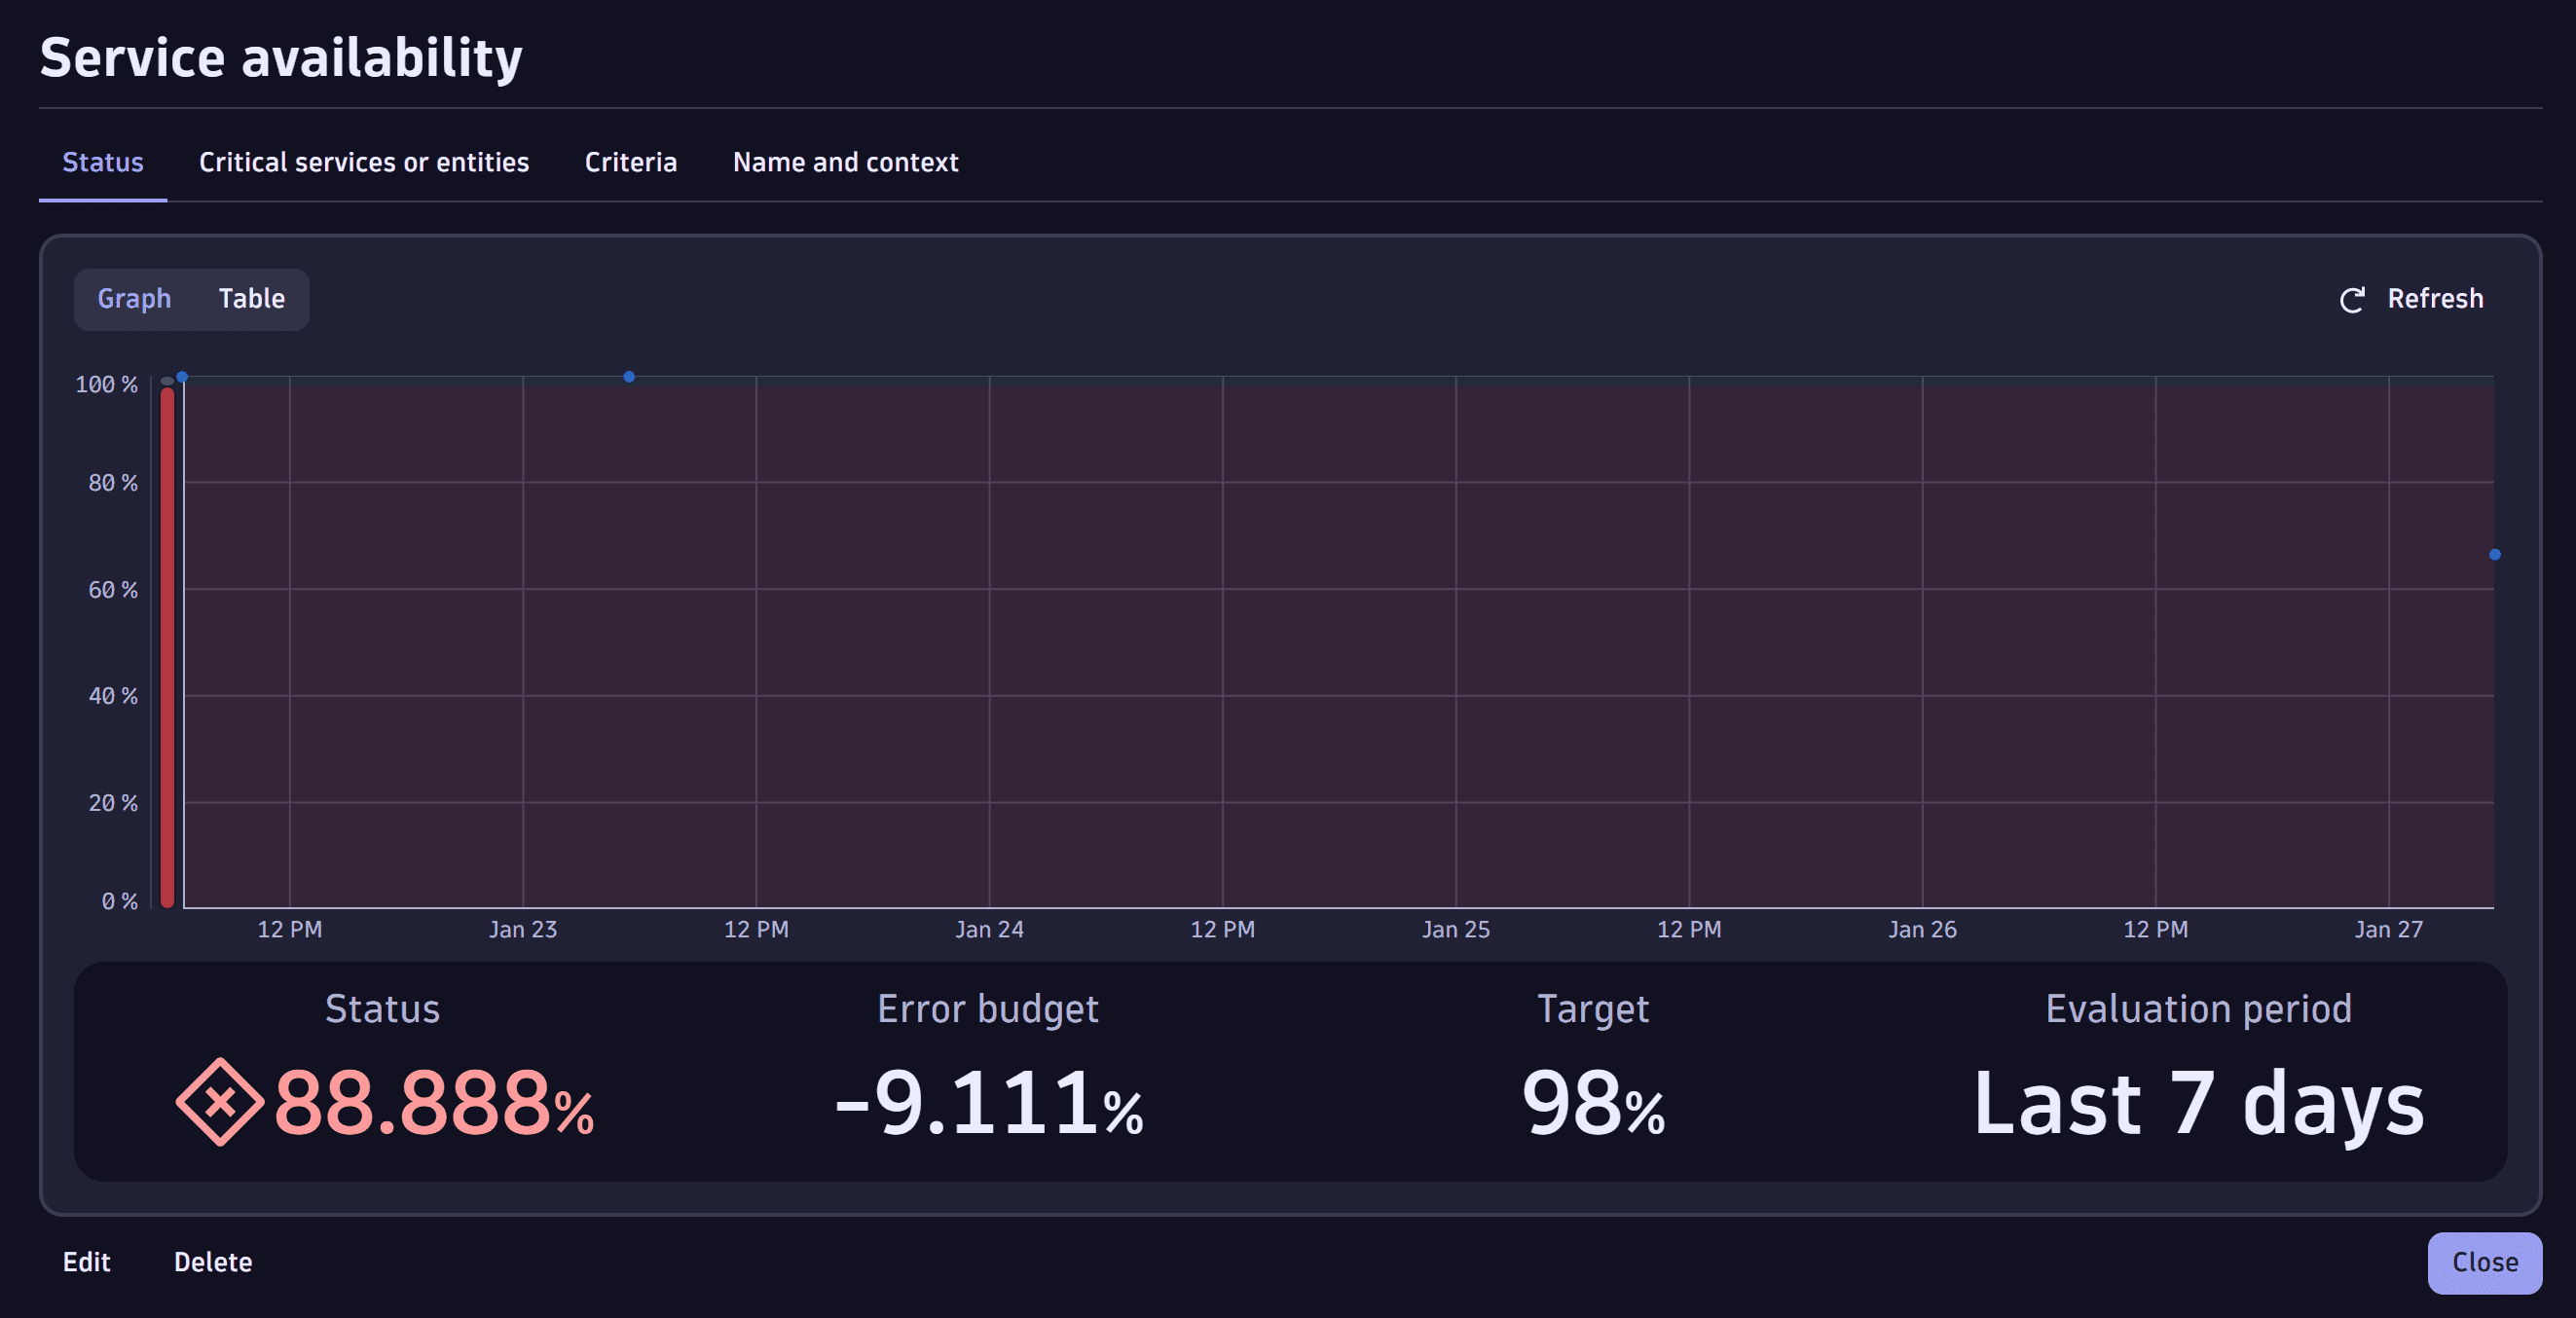
Service availability
This SLI measures the proportion of successful service requests over time.
Details of the template
-
Data source: metrics (timeseries)
-
Entity scope: services
-
SLI DQL query:
timeseries {total = sum(dt.service.request.count),failures = sum(dt.service.request.failure_count)},by: { dt.smartscape.service }| fieldsAdd smartscapeIds = toSmartscapeId(array($services)[])| filter in(dt.smartscape.service, smartscapeIds)| fieldsAdd sli = (((total[] - failures[]) / total[]) * 100)| fieldsAdd dt.smartscape.entity.name = getNodeName(dt.smartscape.service)| fieldsRemove total, failures, smartscapeIds
Service performance
This SLI measures the proportion of service requests that are served faster than a defined response time.
Details of the template
-
Data source: metrics (timeseries)
-
Entity scope: services
-
Interval: defines the duration of each time slot in the timeseries that is aggregated to an average value
-
Threshold: latency threshold to separate high from low time slots
-
SLI DQL query:
timeseries total=avg(dt.service.request.response_time, default:0), by: { dt.smartscape.service }| fieldsAdd smartscapeIds = toSmartscapeId(array($services)[])| filter in(dt.smartscape.service, smartscapeIds)| fieldsAdd high=iCollectArray(if(total[]> (1000 * 500), total[]))| fieldsAdd low=iCollectArray(if(total[]<= (1000 * 500), total[]))| fieldsAdd highRespTimes=iCollectArray(if(isNull(high[]),0,else:1))| fieldsAdd lowRespTimes=iCollectArray(if(isNull(low[]),0,else:1))| fieldsAdd sli=100*(lowRespTimes[]/(lowRespTimes[]+highRespTimes[]))| fieldsAdd dt.smartscape.entity.name = getNodeName(dt.smartscape.service)| fieldsRemove total, high, low, highRespTimes, lowRespTimes, smartscapeIds
Kubernetes cluster CPU usage efficiency
This SLI measures the ratio of requested CPU relative to allocatable CPU per Kubernetes cluster. 100% means that the allocatable CPU meets the requested demand.
Details of the template
-
Data source: metrics (timeseries)
-
Entity scope: Kubernetes cluster
-
SLI DQL query:
timeseries {requests_cpu = sum(dt.kubernetes.container.requests_cpu, rollup:avg),cpu_allocatable = sum(dt.kubernetes.node.cpu_allocatable, rollup:avg)} , by:{dt.smartscape.k8s_cluster}| fieldsAdd smartscapeIds = toSmartscapeId(array($kubernetesClusterIds)[])| filter in(dt.smartscape.k8s_cluster, smartscapeIds)| fieldsAdd sli = (requests_cpu[] / cpu_allocatable[]) * 100| fieldsAdd dt.smartscape.entity.name = getNodeName(dt.smartscape.k8s_cluster)| fieldsRemove requests_cpu, cpu_allocatable, smartscapeIds
Kubernetes cluster memory usage efficiency
This SLI measures the ratio of requested memory relative to allocatable memory per Kubernetes cluster. 100% means that the allocatable memory meets the requested demand.
Details of the template
-
Data source: metrics (timeseries)
-
Entity scope: Kubernetes cluster
-
SLI DQL query:
timeseries {memWorkSet = sum(dt.kubernetes.container.memory_working_set, default:0, rollup:avg),memRequest = sum(dt.kubernetes.container.requests_memory, rollup:avg)} , nonempty: true, by: {dt.smartscape.k8s_cluster}| fieldsAdd smartscapeIds = toSmartscapeId(array($kubernetesClusterIds)[])| filter in(dt.smartscape.k8s_cluster, smartscapeIds)| fieldsAdd sli = memWorkSet[] / memRequest[] * 100| fieldsAdd dt.smartscape.entity.name = getNodeName(dt.smartscape.k8s_cluster)| fieldsRemove memWorkSet, memRequest, smartscapeIds
Kubernetes namespace CPU usage efficiency
This SLI measures the ratio of used CPU resources relative to requested CPU resources per Kubernetes namespace. 100% means that all requested CPU resources are used.
Details of the template
-
Data source: metrics (timeseries)
-
Entity scope: Kubernetes namespace
-
SLI DQL query:
timeseries {cpuUsage = sum(dt.kubernetes.container.cpu_usage, default:0, rollup:avg),cpuRequest = sum(dt.kubernetes.container.requests_cpu, rollup:avg)} , nonempty: true, by: { dt.smartscape.k8s_namespace }| fieldsAdd smartscapeIds = toSmartscapeId(array($kubernetesNamespaceIds)[])| filter in(dt.smartscape.k8s_namespace, smartscapeIds)| fieldsAdd sli = cpuUsage[] / cpuRequest[] * 100| fieldsAdd dt.smartscape.entity.name = getNodeName(dt.smartscape.k8s_namespace)| fieldsRemove cpuUsage, cpuRequest, smartscapeIds
Kubernetes namespace memory usage efficiency
This SLI measures the ratio of used memory relative to allocatable memory per Kubernetes namespace. 100% means that all requested memory resources are used.
Details of the template
-
Data source: metrics (timeseries)
-
Entity scope: Kubernetes namespace
-
SLI DQL query:
timeseries {memWorkSet = sum(dt.kubernetes.container.memory_working_set, default:0, rollup:avg),memRequest = sum(dt.kubernetes.container.requests_memory, rollup:avg)} , nonempty: true, by: { dt.smartscape.k8s_namespace }| fieldsAdd smartscapeIds = toSmartscapeId(array($kubernetesNamespaceIds)[])| filter in(dt.smartscape.k8s_namespace, smartscapeIds)| fieldsAdd sli = memWorkSet[] / memRequest[] * 100| fieldsAdd dt.smartscape.entity.name = getNodeName(dt.smartscape.k8s_namespace)| fieldsRemove memWorkSet, memRequest, smartscapeIds
Migrate an SLO based on an old template
The SLO templates use Smartscape 2.0 entity types and functions. If you have SLOs created from older templates, migrate your SLOs to use the new entity references for improved performance and compatibility.
To migrate an SLO based on an old template to an SLO with Smartscape 2.0 entity types, you have a couple of options.
- Use the SLO Service Public API when you want to preserve the history.
- Create a new SLO and delete the old SLO when using the API is too complex or you don't need to preserve history.
Preserve SLO history by using the SLO Service Public API
To preserve the SLO's history and configuration, use the SLO Service Public API to upgrade the SLO.
This approach is API-only.
-
Retrieve the SLO configuration. Use the following API call.
GET /slos/{id} -
Prepare the updated SLO configuration.
-
Modify the SLO configuration with the new values in the
sliReferenceobject.{"name": "Your SLO Name","description": "Your SLO description","sliReference": {"templateId": "new-template-id","variables": [{"name": "serviceIds","value": "\"SMARTSCAPE-SERVICE-ID-123\""}]},...} -
Update these two fields in the payload:
sliReference.templateId: New template ID.sliReference.variables[].value: Smartscape entity ID, for example,SMARTSCAPE-SERVICE-ID-123.
-
Find the new template ID. Determine the Latest Dynatrace template ID that corresponds to your existing template, for example, if using a service availability template, find its Latest Dynatrace equivalent. Use this API call:
GET /objective-templates/{id} -
Map the entity ID. Use the Query Smartscape entity IDs section below to find the Smartscape 2.0 entity ID that corresponds to your Dynatrace Classic entity ID.
-
-
Validate the updated DQL query via the API preview endpoint.
-
Update the SLO using the following API call.
PUT /slos/{sloId}Include the modified configuration in the request body.
-
Verify the updated SLO is working correctly and showing expected data.
Query Smartscape entity IDs
When working with Smartscape 2.0 entities, you need to map Classic entity IDs to their corresponding Smartscape 2.0 entity IDs. You can query this mapping using DQL:
smartscapeNodes "SERVICE"| fields id_classic, id, name
Replace SERVICE with the appropriate entity type for your use case, for example, HOST or K8S_CLUSTER.
This query returns the following information:
id_classic: The SLO Classic entity ID.id: The new Smartscape 2.0 entity ID.name: The entity name.
Create an SLO and delete the old SLO (clean migration)
Use this approach when you want to start with a new SLO or when using the API is too complex.
- Create an SLO using a template.
- Add the same tags from your original SLO for consistency.
- Verify the new SLO is working correctly and showing the expected data.
- Update any dashboards, alerts, or integrations to reference the new SLO.
- Once you have confirmed the new SLO is working correctly, delete the old SLO.
With this approach, you lose the historical data and trend analysis from the old SLO. Consider exporting or documenting all historical performance data before you delete any SLOs. You might need historical performance data for compliance or reporting purposes.
Related topics
 Service-Level Objectives