Add a service-level objective (SLO) tile to a dashboard
- Latest Dynatrace
- How-to guide
- 3-min read
- Published Nov 19, 2024
With  Service-Level Objectives, you can add your service-level objective (SLO) as a tile to a dashboard to visualize and monitor it.
Steps
Add an SLO from the SLO overview
-
In Dynatrace, search for
Service-Level Objectives. -
In the Service-level objectives table, find your SLO and, in the Actions column, select > Add to Dashboard.
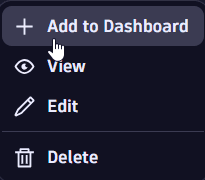 Add a Service-level objective
 -
In the Select destination window, select your document and Confirm to add the tile to an existing dashboard, or select New dashboard to create a new dashboard for your SLO.

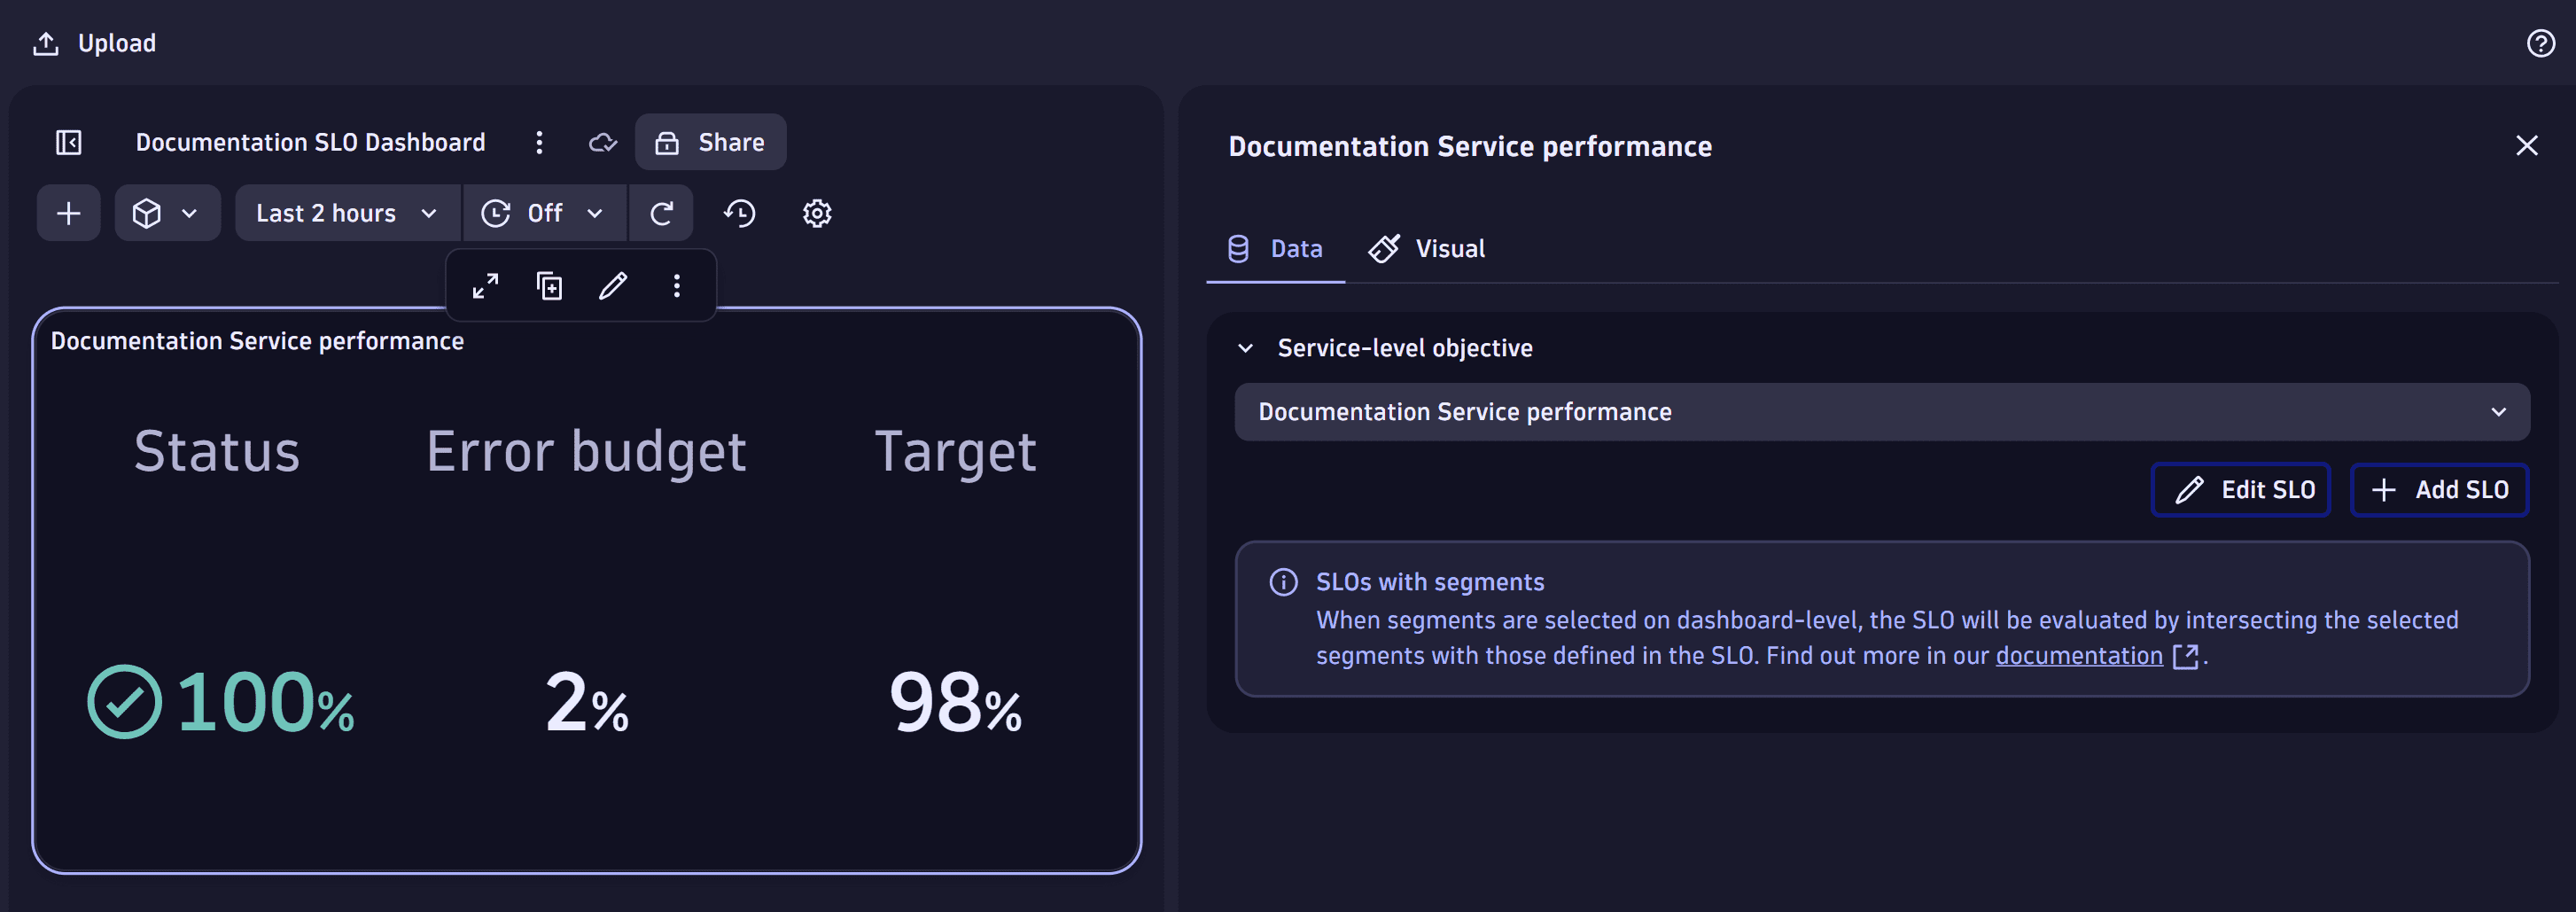
An SLO tile showing the SLO status, error budget, and target is available on your dashboard.
Add an SLO from your dashboard
Add and edit your SLO directly from  Dashboards.
-
Go to
Dashboards and create a new dashboard or select an existing dashboard. -
You can add an SLO using the Shift+S keyboard shortcut, or in the upper-right corner of the dashboard, select the plus sign .
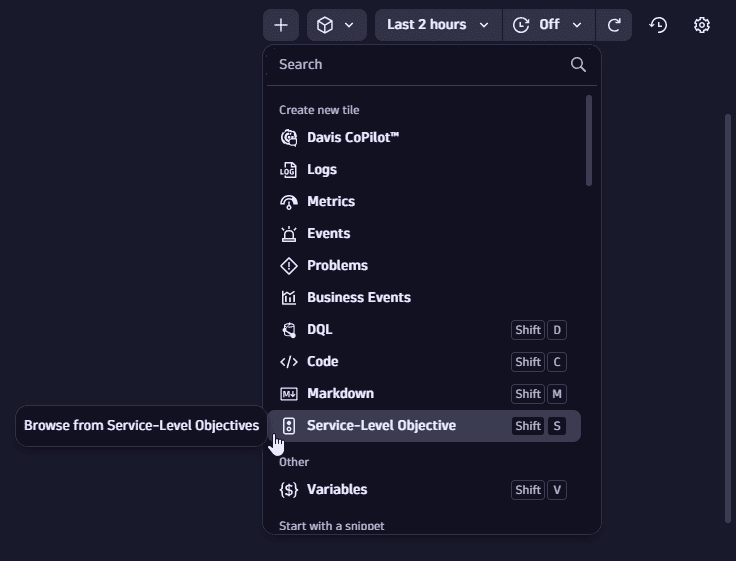 Add an SLO tile from your dashboard
 -
From the Create new tile drop-down list, choose Service-level Objective.
The Service-level objective panel is displayed.
-
In the edit panel for your SLO tile, select your SLO from the Service-level objective list. Alternatively, you can add a new SLO or edit an existing SLO using the Add SLO and Edit SLO options. You can perform these actions from the same window without leaving the Dashboard application.
The SLO name is used as the title of your dashboard tile. You can edit the tile title, in which your tile will have a different title from your SLO. (The SLO name won't be changed.)
-
In the Visual tab, you can select or deselect the Data mapping Columns to display for your SLO which are Status, Error budget, Target and Evaluation period.
-
In the Visual tab, Service-level objective options section, you can toggle the Show labels option to display them. You can also toggle to Apply status threshold color to either the SLO Value or the Background.
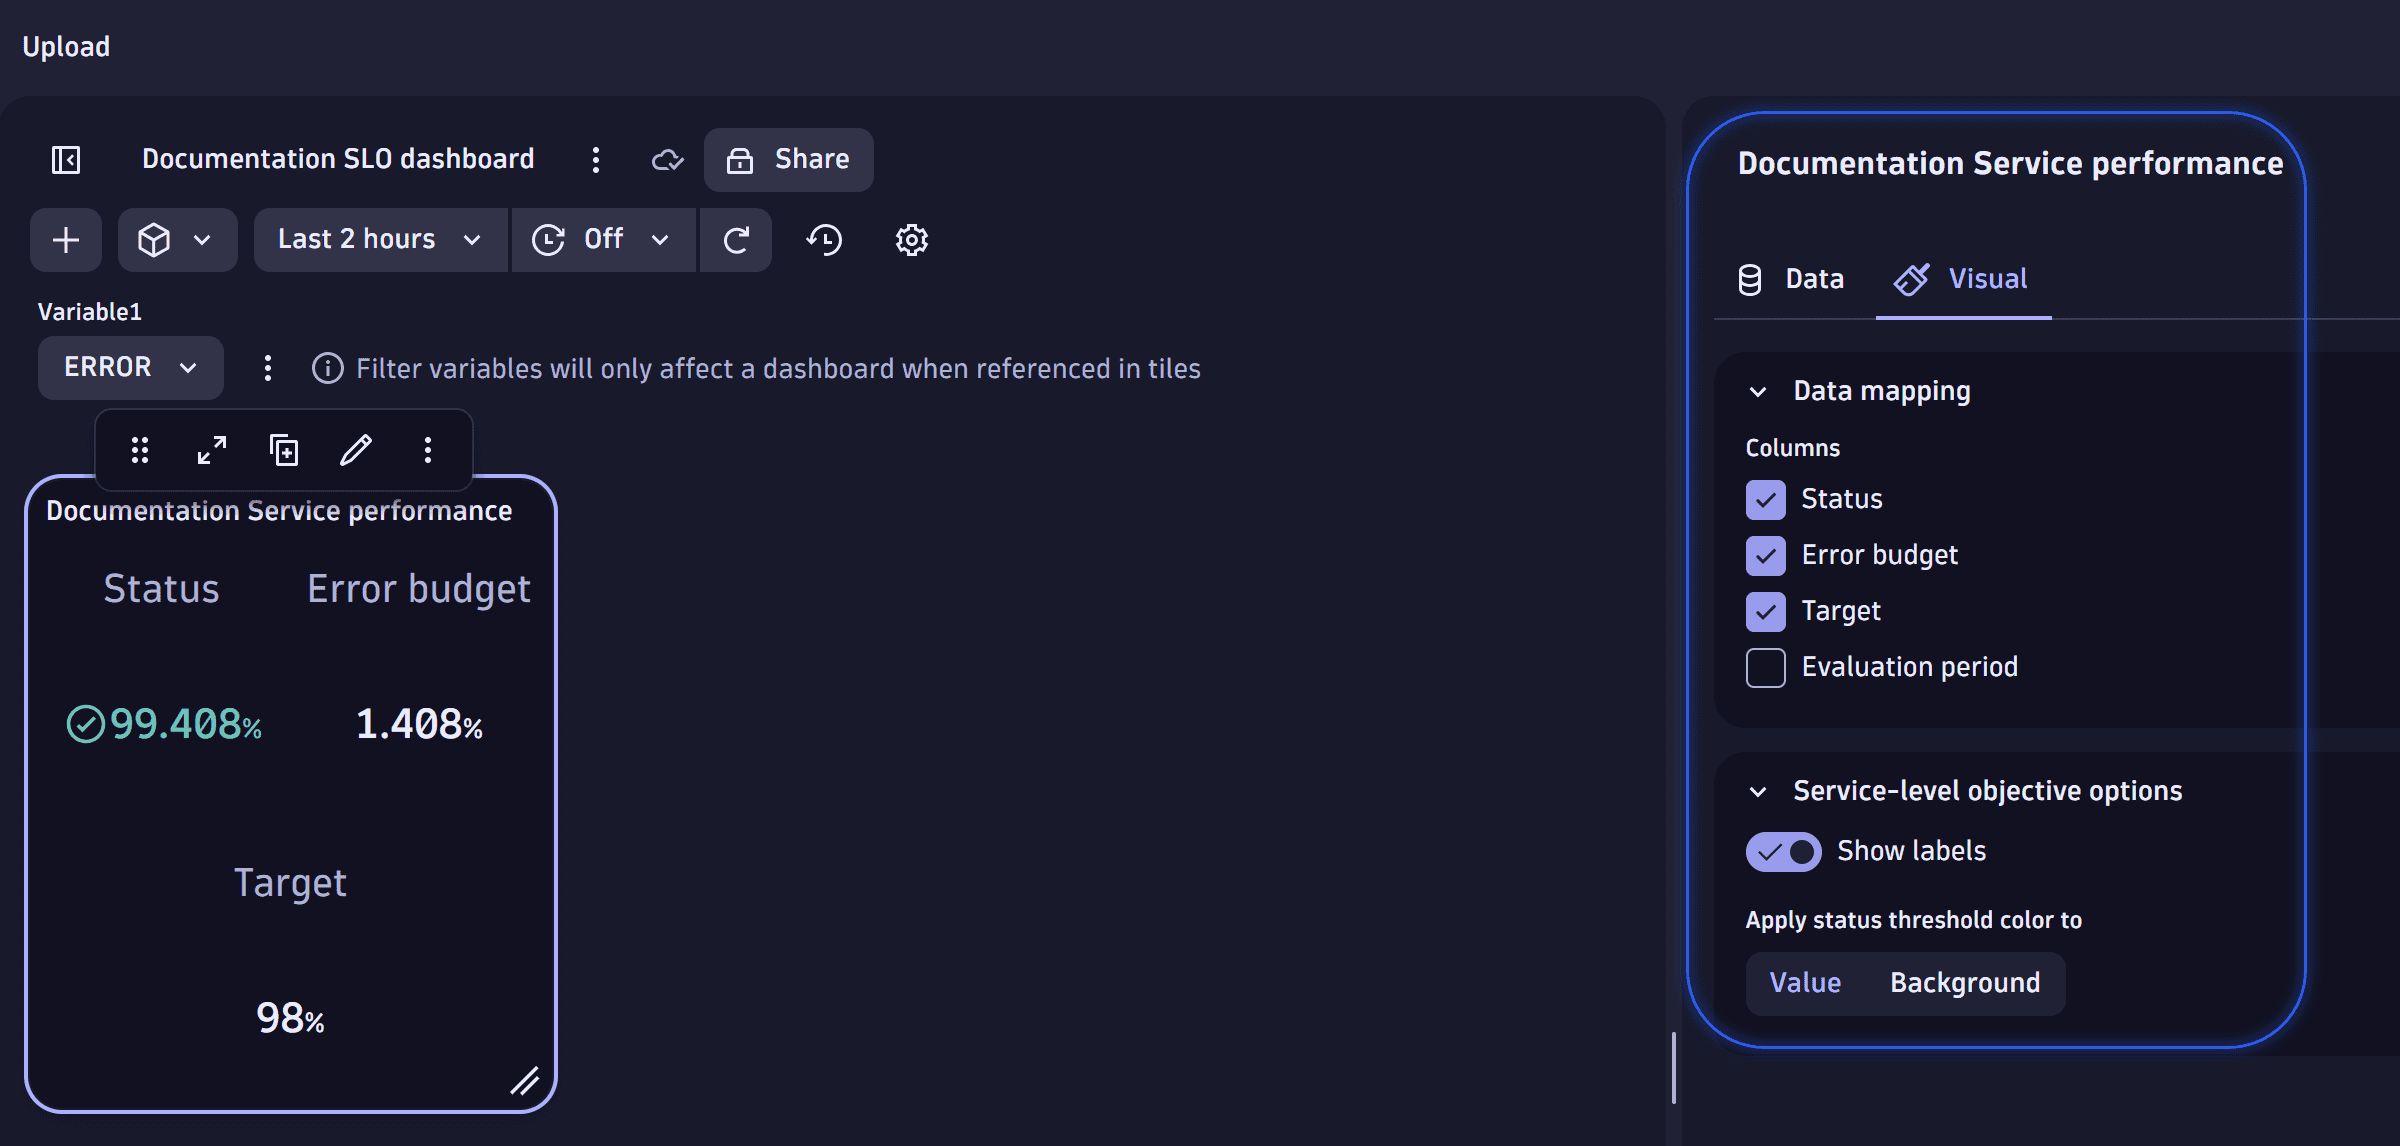 Screenshot of Service-level objective panel with the Visual tab
The tile won't be functional until you select an SLO. For more information, see Edit a service-level objective (SLO) tile in a dashboard.
You added your new SLO tile to your dashboard.
Changing the dashboard's timeframe does not affect the SLO evaluation timeframe; it has no effect on the SLO status, which is always evaluated against its own evaluation period.
Add segment filter to SLO in Dashboards
-
Add an SLO to the Dashboard according to the Add an SLO from your dashboard section.
-
Select segments , choose the required segment(s), and select Apply.
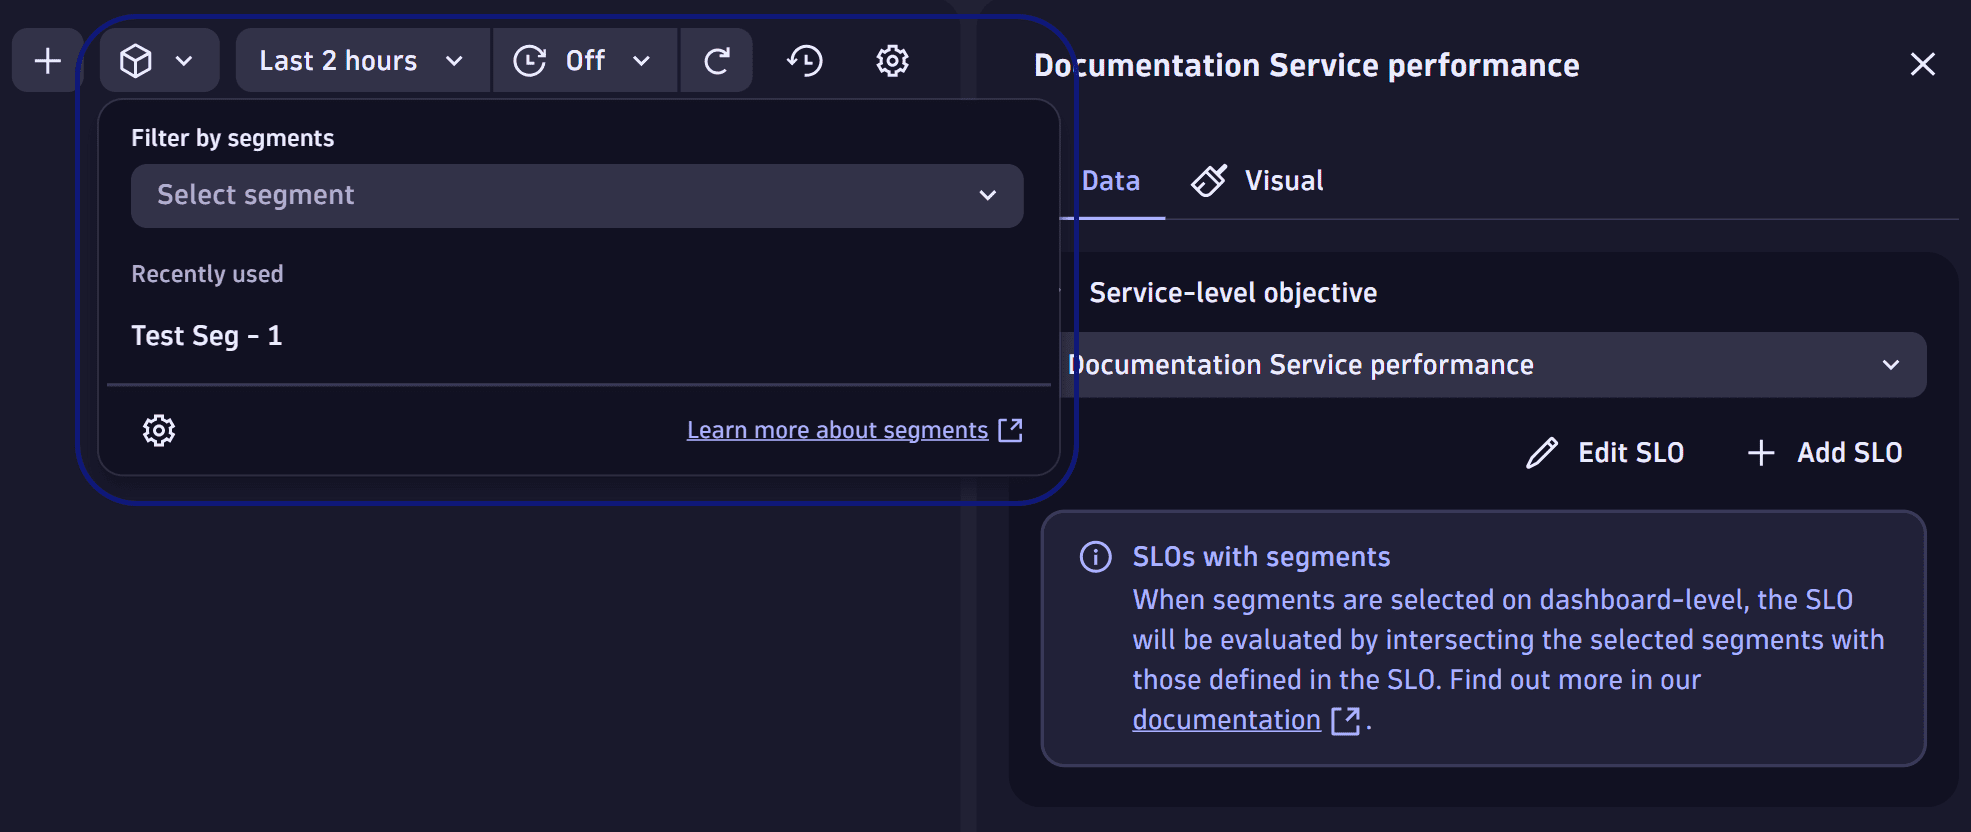 Add segments filter to Dashboard-level SLO
 -
The SLO visualization automatically contains the dashboard-level segments in its evaluation.
Dashboards-level segments and SLO-level segments can be used at the same time. The final result will be an intersection of these two selections. Depending on the selected segments, the SLO evaluation contains:
- A common result set for the Dashboard-level and the SLO-level.
- No results if there are no intersections between the segments.
Example:
- Segment A: has entities S-1 and S-2
- Segment B: has entities S-2 and S-3
Due to the intersection, the result contains only the evaluations related to S-2.
 Service-Level Objectives