Ingest GitHub Advanced Security security events and audit logs
- Latest Dynatrace
- Extension
Prioritize GitHub security findings by enriching them with runtime context.
Get started
Overview
Dynatrace integration with GitHub Advanced Security (GHAS) enables users to unify and contextualize vulnerability findings across DevSecOps tools and products, facilitating centralized prioritization, visualization, and automation of security findings.
GitHub Advanced Security includes Code Security and Secret Protection which generate vulnerability findings for development artifacts, such as code and containers. Dynatrace observes the runtime entities associated with those artifacts. Ingesting and enriching vulnerability findings helps users focus on high-impact risks affecting production applications.
In addition, GitHub users can use Dynatrace runtime context to prioritize GitHub Advanced Security alerts based on deployed artifacts and runtime risk in your Kubernetes environment. When you connect Dynatrace to GitHub, you’ll see deployment visibility for container images that Dynatrace maps to your repositories, along with runtime risk signals. You can use this context to focus remediation on alerts that affect deployed artifacts, especially when Dynatrace detects higher-risk runtime conditions.
Use cases
With the ingested data, you can accomplish various use cases, such as
Requirements
See below for the GitHub and Dynatrace requirements.
GitHub requirements
For the extension to collect security data, authentication credentials with proper permissions are required. You have two options, described below.
Recommended
The GitHub app-based authentication
-
Allows granular permission control
-
Can collect organization level audit logs
-
Has higher API rate limits
To register and install a GitHub app, follow the steps below.
1. Register the GitHub app
- Follow the steps in Registering a GitHub app with the following values:
- For GitHub App Name, enter
DynatraceAppSec-<Your Company>, making sure to replace<Your Company>with your own value. - For Homepage URL, enter
https://dynatrace.com. - Clear Webhook > Active.
- Enable the following permissions:
- Repository permissions:
- Contents:
Read-only - Dependabot alerts:
Read-only - Code scanning alerts:
Read-only(required when code scanning events are ingested) - Secret scanning alerts:
Read-only(required when secret scanning events are ingested) - Artifact metadata:
Read-and-write(required when sending runtime context to GitHub) - Attestations:
Read-only(required when sending runtime context to GitHub)
- Contents:
- Organization permissions
- Administration:
Read-only(required for audit logs)
- Administration:
- Repository permissions:
- To set the location where the app will be installed, select one of the following:
Any account(allows you to install the app in multiple organizations and even user account, which will simplify your monitoring configurations)Only this account(the app is installed in the current account; this means you'll need multiple apps and monitoring configurations to cover multiple organizations under an enterprise)
2. Generate a private key for the app
-
Select the General tab and go to the newly registered app settings.
-
Copy the client ID (you'll need it when setting up the monitoring configuration).
-
Under Private keys, generate a private key (you'll need it when setting up the monitoring configuration)
The private key allows authenticated requests from the extension; make sure to secure it.
3. Install the app
Install the GitHub app on any accounts (users or organizations) you want to monitor.
We recommend using artifact attestations to link your container image packages to their corresponding GitHub repositories. This ensures reliable runtime‑context enrichment, regardless of the container registry. If no attestation exists for an image package, Dynatrace attempts to map the image to a repository based on the full image name pattern (supported for ghcr.io‑hosted images only).
Dynatrace requirements
-
ActiveGate version 1.310+ that needs to be able to
- Run Extensions 2.0 framework
- Reach the GitHub API endpoint URLs
-
Permissions:
- To run
 Extensions: Go to Hub, select Extensions, and display Technical information.
 - To query ingested data:
storage:security.events:read.
- To run
-
Generate an access token with the
openpipeline.events_securityscope and save it for later. For details, see Dynatrace API - Tokens and authentication. -
To send runtime context to GitHub, generate a platform token with the following scopes and save it for later.
storage:smartscape:readstorage:buckets:readstorage:security.events:read
For details, see Platform tokens.
-
Optional Set up Dynatrace Runtime Vulnerability Analytics (RVA) to get internet exposure and sensitive data assets assessments for the monitored containers.
Activation and setup
-
In Dynatrace, search for GitHub Advanced Security and select Install.
-
Follow the on-screen instructions to configure the extension.
-
Verify configuration by running the following queries in
 Notebooks:
-
For audit logs:
fetch logs| filter log.source=="GitHub Advanced Security" -
For finding events:
fetch security.events| filter dt.system.bucket == "default_securityevents"| filter event.provider=="GitHub Advanced Security"AND event.type=="VULNERABILITY_FINDING" -
For scan events:
fetch security.events| filter dt.system.bucket == "default_securityevents"| filter event.provider=="GitHub Advanced Security"AND event.type=="VULNERABILITY_SCAN"
-
-
To confirm that runtime context is shared, go to Packages in GitHub and open Linked artifacts for your organization. A deployment record indicates successful sharing.
-
Once the extension is installed and working, you can access and manage it in Dynatrace via
Extensions. For details, see About Extensions.
Details
How it works
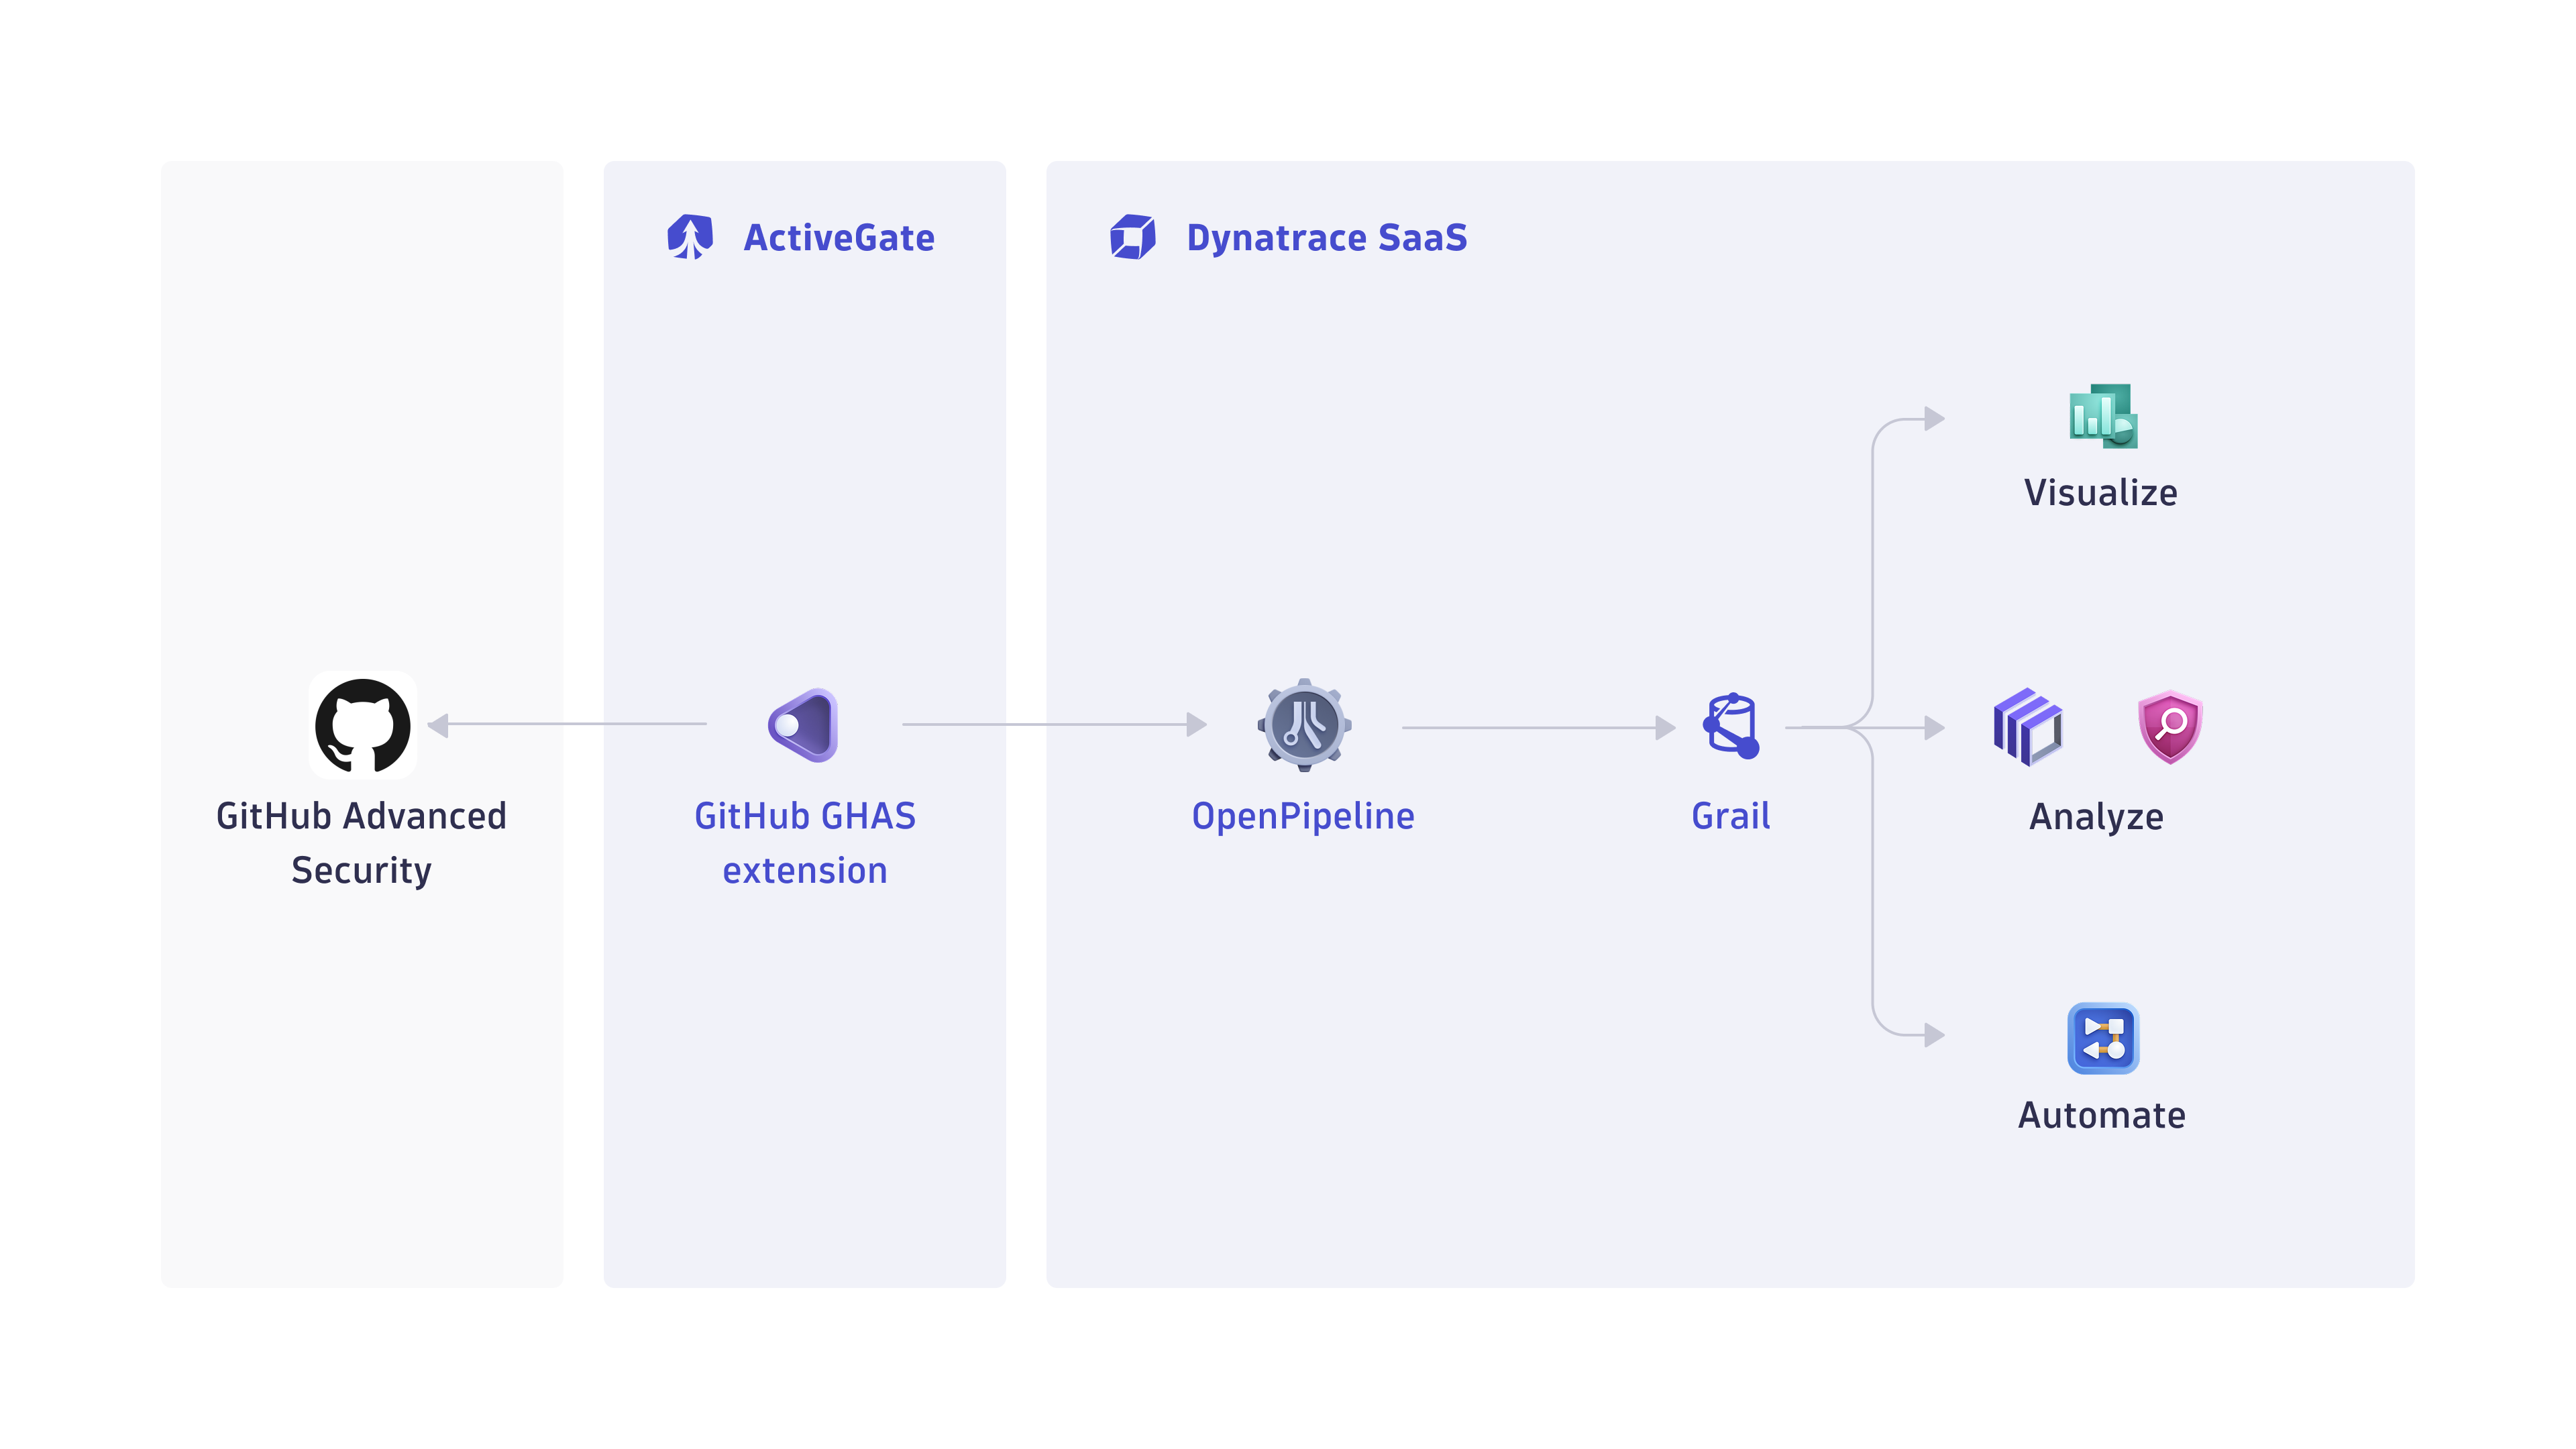
1. Events and logs are collected from GHAS products
The Dynatrace GHAS integration is an extension deployed in a Dynatrace ActiveGate that periodically collects security findings and audit logs using the GitHub REST API.
2. Security findings and logs are ingested into Dynatrace
Security findings are ingested into the Dynatrace platform via a dedicated OpenPipeline security ingest endpoint.
3. Security findings and logs are processed and stored in Grail
The OpenPipeline ingest endpoint processes and maps the security findings according to the Semantic Dictionary conventions.
These are stored in a bucket called default_securityevents (for details, see: Built-in Grail buckets).
Optionally, the collected audit logs are ingested via a dedicated extensions log ingest pipeline and stored in the appropriate semantic format.
4. Runtime context is sent to GitHub as deployment records
Dynatrace queries Grail to collect runtime context for the Kubernetes workloads running in your environment. This context is matched to monitored repositories using artifact attestations or image names (for ghcr.io‑hosted images). The resulting runtime context is then shared with GitHub as deployment records. For details, see What runtime context from Dynatrace is shared with GitHub?.
Licensing and costs
For billing information, see Events powered by Grail.
Feature sets
When activating your extension using a monitoring configuration, you can limit monitoring to one of the feature sets. To work properly, the extension has to collect at least one metric after the activation.
In highly segmented networks, feature sets can reflect the segments of your environment. Then, when you create a monitoring configuration, you can select a feature set and a corresponding ActiveGate group that can connect to this particular segment.
All metrics that aren't categorized into any feature set are considered to be the default and are always reported.
A metric inherits the feature set of a subgroup, which in turn inherits the feature set of a group. Also, the feature set defined on the metric level overrides the feature set defined on the subgroup level, which in turn overrides the feature set defined on the group level.
FAQ
Which data model is used for the security logs and events coming from GHAS integration?
-
Vulnerability finding events store the individual vulnerability findings reported by various GHAS products per affected artifacts and component.
-
Vulnerability scan events indicate coverage of scans for individual artifacts.
-
Audit logs represent the user activity logs in the GHAS products.
Which GHAS security findings are imported into Dynatrace?
-
If the extension is configured to ingest data at an interval of
nhours, then whenever the extension runs all security events (Dependabot, code scanning, and secret scanning alerts) updated in the lastnhours will be ingested. -
On the first ingest, we consider alerts updated in the last
mhours, wheremis the first ingest interval configured in the monitoring configuration. -
If no scans occurred, no findings will be ingested, even if the project has open issues. Consult the GitHub documentation for Dependabot, code scanning, and secret scanning to see when a scan will occur.
Which extension fields are added to the core fields of the events ingested from GHAS?
The github namespace is added for extracting several GHAS-specific attributes for user convenience on top of the original issue JSON, which is stored in the event.original_content field.
Examples:
-
github.dependency.relationship -
github.dependency.scope -
github.epss.percentage -
github.epss.percentile -
github.ecosystem
What GHAS asset types are supported by Dynatrace for runtime contextualization?
CODE_ARTIFACT: All the findings from GitHub Advanced Security products coming from the assessment of code artifacts are mapped set with CODE_ARTIFACT value in the object.type field, and the artifact and component namespaces are added with the corresponding fields:
-
artifact.repository.namerepresents the repository name which hosts the artifact. -
artifact.pathis the full path of the file representing the code artifact. -
component.namerepresents the name of the vulnerable library within a code artifact. -
component.versionincludes the version of the vulnerable component.GitHub only provides limit values and not the exact version, for example,
<1.4. This limits the possibility of matching runtime components, as the version isn't matched in this case.
What runtime context from Dynatrace is shared with GitHub?
Dynatrace sends deployment records to GitHub for all container images identified in the monitored containers that match the artifact attestations of images accessible by the configured user in GitHub. If Runtime Vulnerability Analytics (RVA) is enabled for the monitored containers, the deployment records include internet exposure and sensitive data assets assessments.
Example query:
smartscapeNodes CONTAINER, from: -2h| filter exists(k8s.namespace.name) // will update to filter to configured namespaces| expand k8s.workload.id=coalesce(references[is_part_of.k8s_deployment],coalesce(references[is_part_of.k8s_daemonset],coalesce(references[is_part_of.k8s_cronjob],coalesce(references[is_part_of.k8s_statefulset],coalesce(references[is_part_of.k8s_job],references[is_part_of.k8s_replicaset])))))| lookup [smartscapeNodes {{K8S_DEPLOYMENT, K8S_CRONJOB, K8S_DAEMONSET, K8S_JOB, K8S_STATEFULSET, K8S_REPLICASET}}, from:now()-2h], sourceField:k8s.workload.id, lookupField:id, fields:{{k8s.workload.id_classic=id_classic}}| join [// query vulnerabilitiesfetch security.events| filter event.type=="VULNERABILITY_STATE_REPORT_EVENT"AND event.level=="ENTITY"// for all the affected workloads| expand k8s.workload.id_classic=related_entities.kubernetes_workloads.ids| summarize {{exposure_status=collectDistinct(vulnerability.davis_assessment.exposure_status),data_assets_status=collectDistinct(vulnerability.davis_assessment.data_assets_status)}}, by:{{k8s.workload.id_classic}}| fieldsAdd exposure_status=if(in("PUBLIC_NETWORK",exposure_status),"PUBLIC_NETWORK", else:if(in("ADJACENT_NETWORK",exposure_status),"ADJACENT_NETWORK", else:if(in("NOT_DETECTED",exposure_status),"NOT_DETECTED", else:"NOT_AVAILABLE")))| fieldsAdd data_assets_status=if(in("REACHABLE",data_assets_status),"REACHABLE", else:if(in("NOT_DETECTED",data_assets_status),"NOT_DETECTED", else:"NOT_AVAILABLE"))], kind:leftOuter, on:{{k8s.workload.id_classic}}, fields:{{exposure_status, data_assets_status}}| fieldsAdd exposure_status=coalesce(exposure_status,"NOT_AVAILABLE"),data_assets_status=coalesce(data_assets_status,"NOT_AVAILABLE")| fields container.image.digest, container.image.name, k8s.namespace.name, exposure_status, data_assets_status| dedup container.image.digest, container.image.name, k8s.namespace.name, exposure_status, data_assets_status
How can I use runtime context in GitHub?
You can use deployment visibility and runtime risk signals to filter and prioritize GitHub code scanning and Dependabot alerts, including in security campaigns.
For example, to find vulnerabilities that affect deployed artifacts that are internet exposed, use:
has:deployment AND runtime-risk:internet-exposed
Runtime risk signals include:
- Public internet exposure (
runtime-risk:internet-exposed) - Access to sensitive data assets (
runtime-risk:sensitive-data)
How is the risk score for GHAS findings normalized?
Dynatrace normalizes severity and risk scores for all findings ingested through the current integration. This helps you to prioritize findings consistently, regardless of their source.
For details on how normalization works, see Severity and score normalization.
The Dynatrace risk levels and scores are mapped from the original GHAS severity and score.
-
dt.security.risk.level- is taken from the GHAS severity level and mapped from the original values infinding.severity. -
dt.security.risk.score- is taken from the GHAS severity level and mapped to static scores. The CVSS score reported by GHAS is available infinding.score; however, this may not always match the reported severity.
dt.security.risk.level (mapped from finding.severity) | dt.security.risk.score (mapped from dt.security.risk.level) |
|---|---|
critical -> CRITICAL | 10.0 |
high/error -> HIGH | 8.9 |
medium/warning -> MEDIUM | 6.9 |
low/note -> LOW | 3.9 |
Secret scanning alerts are assigned a default risk level of HIGH. You can customize this setting in Advanced options during the extension configuration.
