Service analysis
- Latest Dynatrace
- How-to guide
- 6-min read
This topic is about the Services (previous Dynatrace) or 

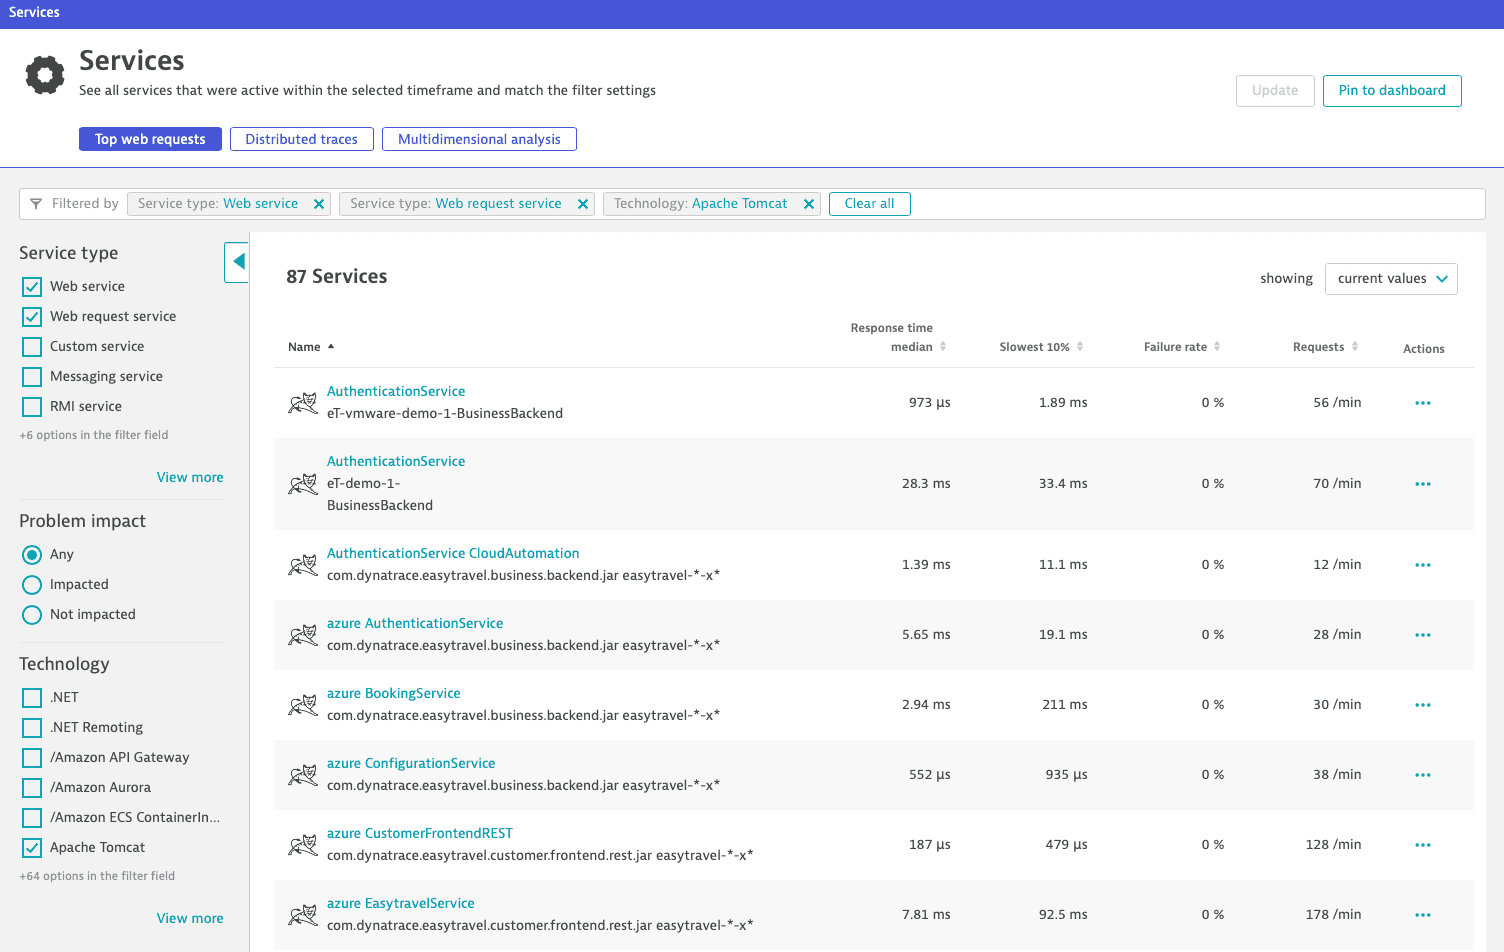
All services detected by Dynatrace in your environment are displayed on the Services (previous Dynatrace) or 

How to get there:
- Go to Services (previous Dynatrace) or
Services Classic.
- Select a service name in the list to go to that service's overview page.

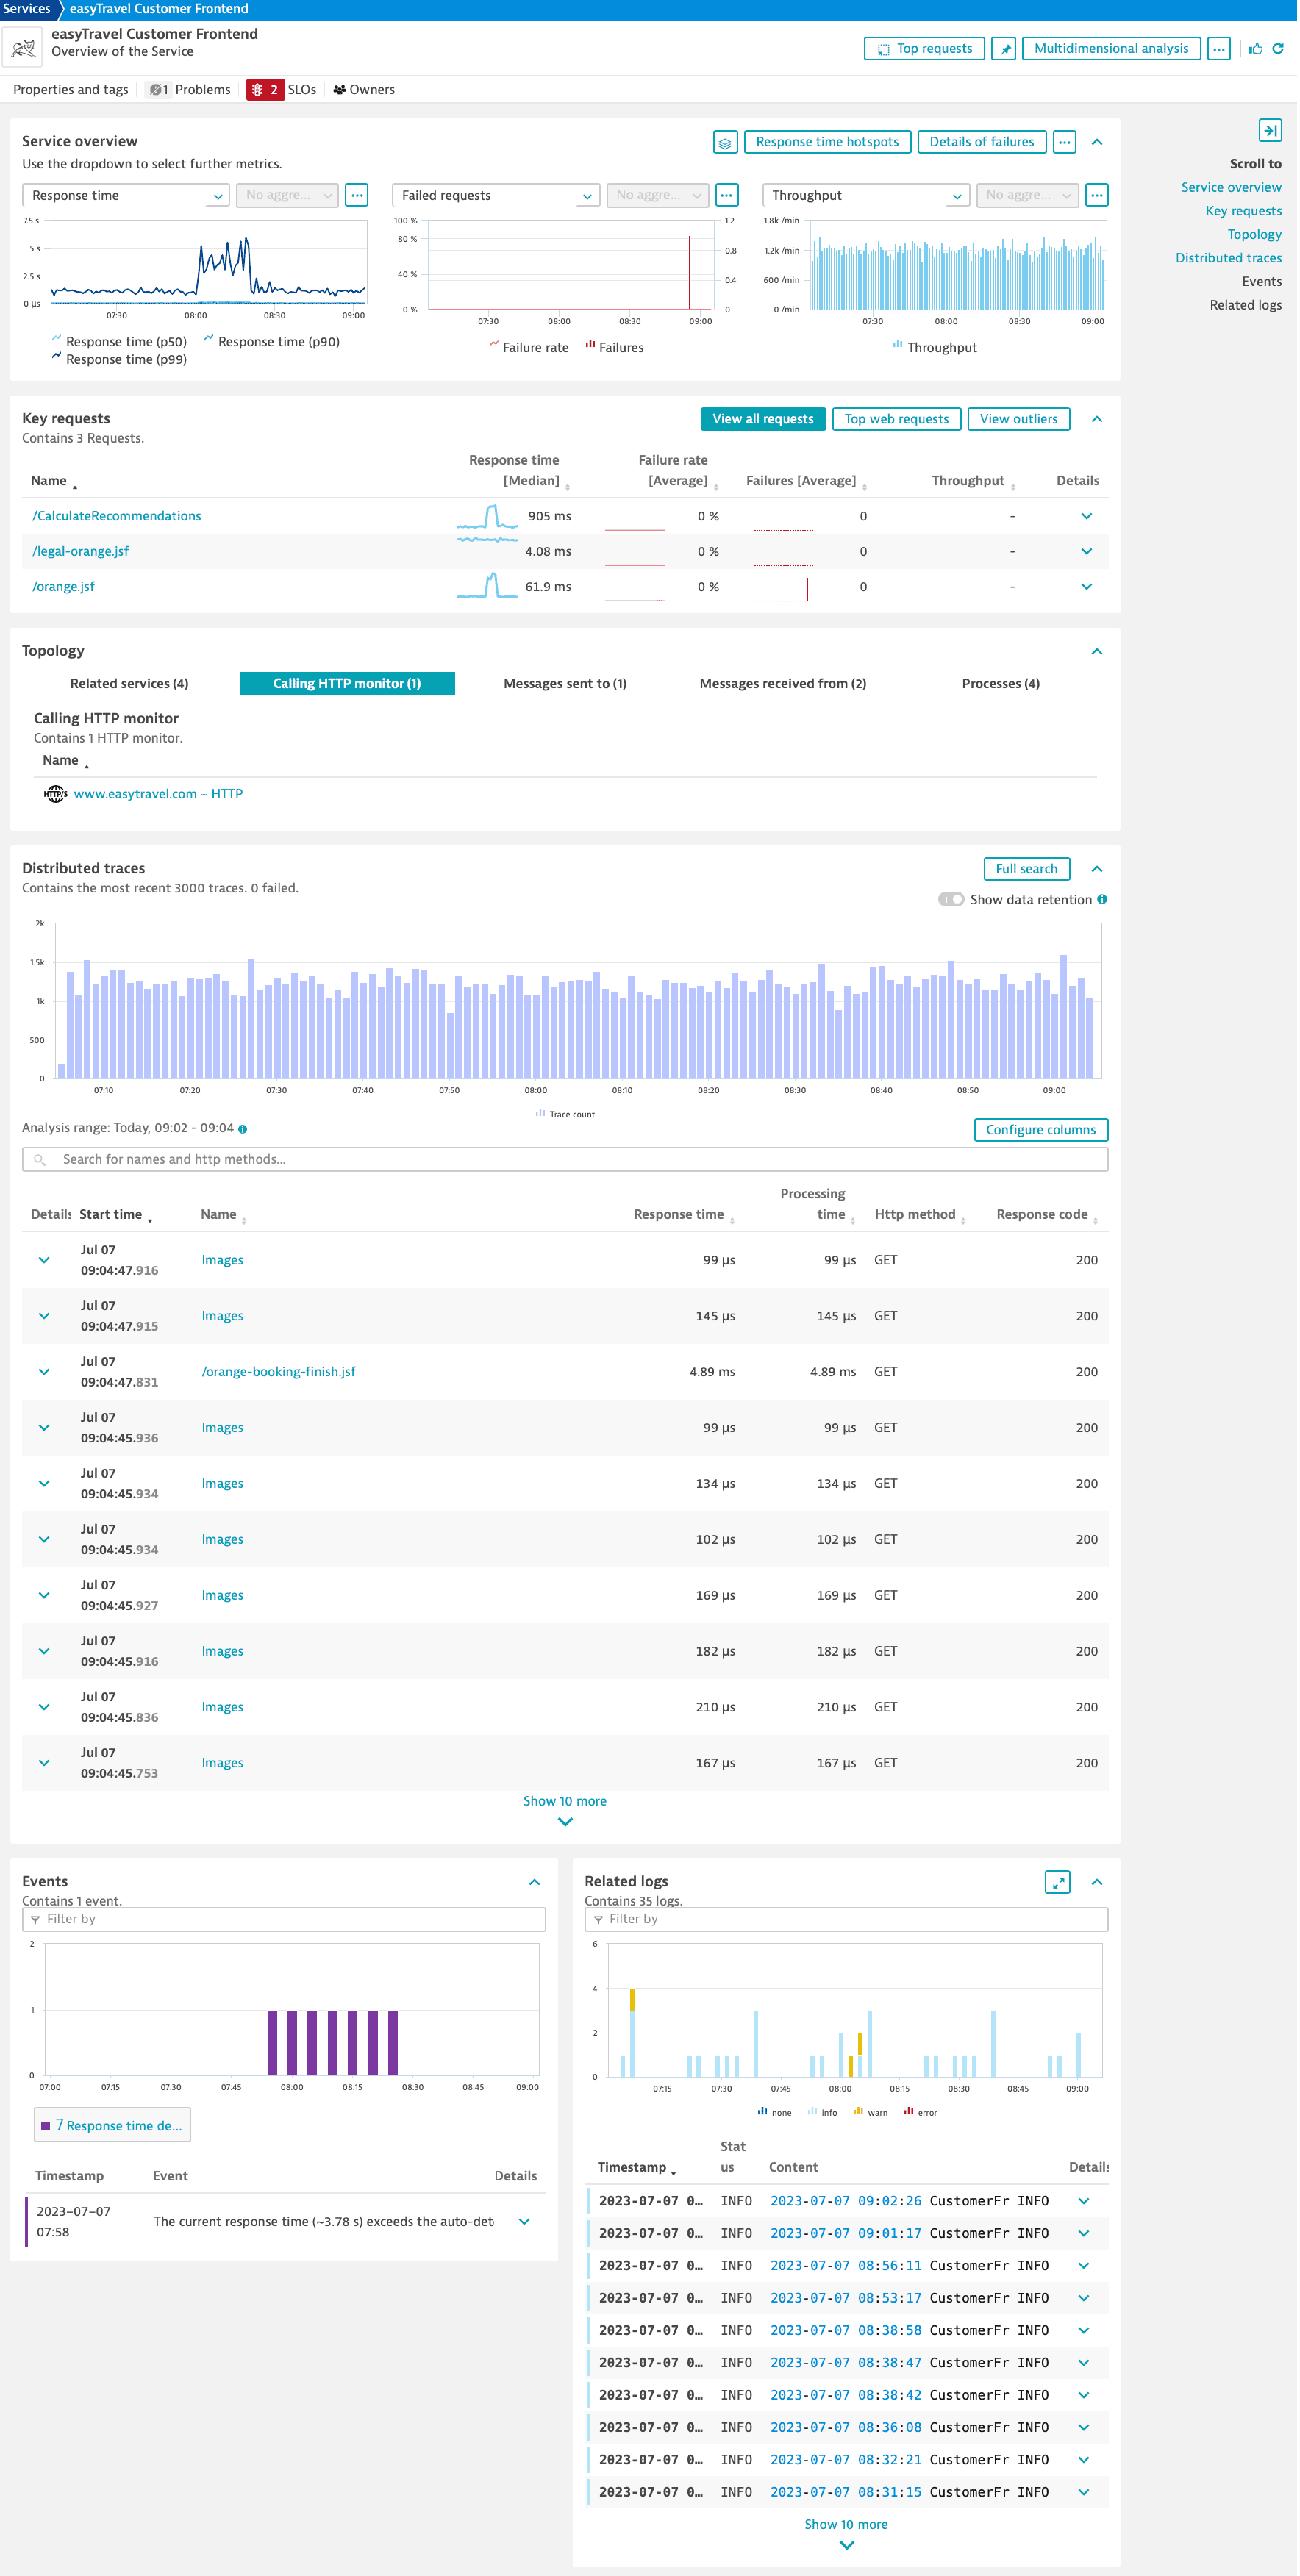
Each Service page lists the most important information for that service. All relevant service metrics are shown on a single page, which is divided into several logical sections. Other panes of the service overview page show service performance and serve as entry points to deeper analysis.
Notifications bar
The service notifications bar gives you a quick overview of the service state. Select a notification item to display more information.
Properties and tags
Select Properties and tags on the notifications bar to display the Properties and tags panel, which displays metadata about the selected service:
- Tags lists tags currently applied to the service.
Select Add Tag to add a tag to the service metadata. - Properties lists various service properties, such as application name, service type, technologies, and management zones.
Problems
- On the notifications bar, Problems indicates active and closed problems related to the selected service.
- Select Problems on the notifications bar to display the Problems panel, which lists the problems.
- Select a problem to display details.
- Select Go to problems to go to the Problems page filtered by the selected service.
SLOs
- On the notifications bar, SLOs indicates the current number of SLOs related to the selected service.
- Select SLOs on the notifications bar to display the Service-level objectives panel, which lists SLOs that are directly or indirectly connected to the service.
Directly connected SLOs
-
An SLO is directly connected to a service when the entity selector of an SLO meets the following criteria:
- The entity type is set to
"SERVICE". - The entity ID is set to the service ID.
- The entity type is set to
-
To see only SLOs that are directly connected to the service, make sure that Show only directly connected SLOs is turned on.
Indirectly connected SLOs
-
An SLO isn't directly connected to a service when, in the entity selector of an SLO, no entity ID is provided.
Example: When generic values, such as
type("SERVICE"),tag("slo")are provided, the query results in all SLOs for all services, including the current service. -
To see SLOs that are not directly connected to the service, turn off Show only directly connected SLOs.
Options
-
Expand Details to view a chart of the respective SLO metrics.
-
In Actions, select
- View in Data Explorer to see SLO metrics in Data Explorer.
- Pin to Dashboard to pin the SLO to your dashboard.
- SLO definition to edit the SLO in Service-level objective definitions.
- Clone to clone the SLO.
- Create alert to create an alert for the SLO.
No SLOs
If no SLOs are found, you can
-
Select a different timeframe in the upper-right corner.

-
Select Add SLO to create an SLO in the SLO wizard.
Owners
Select Owners on the notifications bar to display the Ownership panel, which lists owners of the selected service.
- Select to learn more about a current ownership.
- To add an ownership, select Add a new Ownership tag.
Performance
Service overview
You can configure the Service overview card to focus on various metrics of the service performance.
- In the Service overview, you can
- See the service in Smartscape by selecting Smartscape view .
- Analyze Response time hotspots, Details of failures, and method hotspots.
- Compare service request performance indicators, such us response time, failures, CPU, and load, based on different timeframes.
- For each metric, you can select More (…) and
- Analyze the metric in Data Explorer.
- Create a metric event.
- Pin the metric to a classic dashboard. For details, see Pin tiles to your dashboard.
Endpoints
Unified service
The Endpoints card offers an overview of the monitored service endpoints.
- To analyze an endpoint metrics, in the Details column select .
- To analyze an endpoint distributed traces, in the Actions column select More (…) > View distributed traces.
Data availability depends on endpoint metrics, which consume DDUs. To get started on endpoint monitoring, see Manage endpoint monitoring.
Service mesh metrics
Unified service
If a service mesh is detected in your application, service mesh metrics are displayed for the related service. ISTIO logs and metrics are enriched with service mesh ID, putting data into context. Note that service mesh metrics are created from ingested service mesh traces.
Key requests
The Key requests card offers an overview of the key requests found for the service in the selected timeframe. You can quickly access analysis for other requests related to the services such as:
Topology
In the Topology card, you can learn
- Which services are calling and which are called by the service.
Select Related services to understand the service relation. Expand Details to view a chart of the respective service metrics. You can quickly access further analysis options such as View backtrace and Service flow. - On which processes and hosts the service is running on.
Expand Details to view a chart of the respective process metrics. Select the name of the process to analyze it deeper. - Which HTTP monitors and (mobile) applications are calling the service.
Select the name of a calling entity to analyze it deeper.

Distributed traces
The Distributed traces card provides an overview of the most recent traces, depending on the selected timeframe. Select Full search to directly access the distributed traces overview for the service.
Events
Contains a list of events that affect the service in the current timeframe.
Related logs
Contains a list of logs related to the service in the current timeframe.
- To analyze all the logs for the related service, select Go to logs .
- To analyze a specific log, expand Details. If a trace or a user session is found for the log line, you can directly access it from this view.