Services app
- Latest Dynatrace
- App
- 5-min read
 Services delivers comprehensive visibility into your distributed services, enabling teams to quickly identify, investigate, and resolve issues across complex microservice architectures. This unified interface consolidates critical health signals and performance metrics to accelerate troubleshooting and optimize service reliability.
Prerequisites
- Services instrumented with OneAgent or OpenTelemetry.
- Services is installed in your Dynatrace environment.
- You have the minimal set of permissions to use Services.
Get started
Explorer view
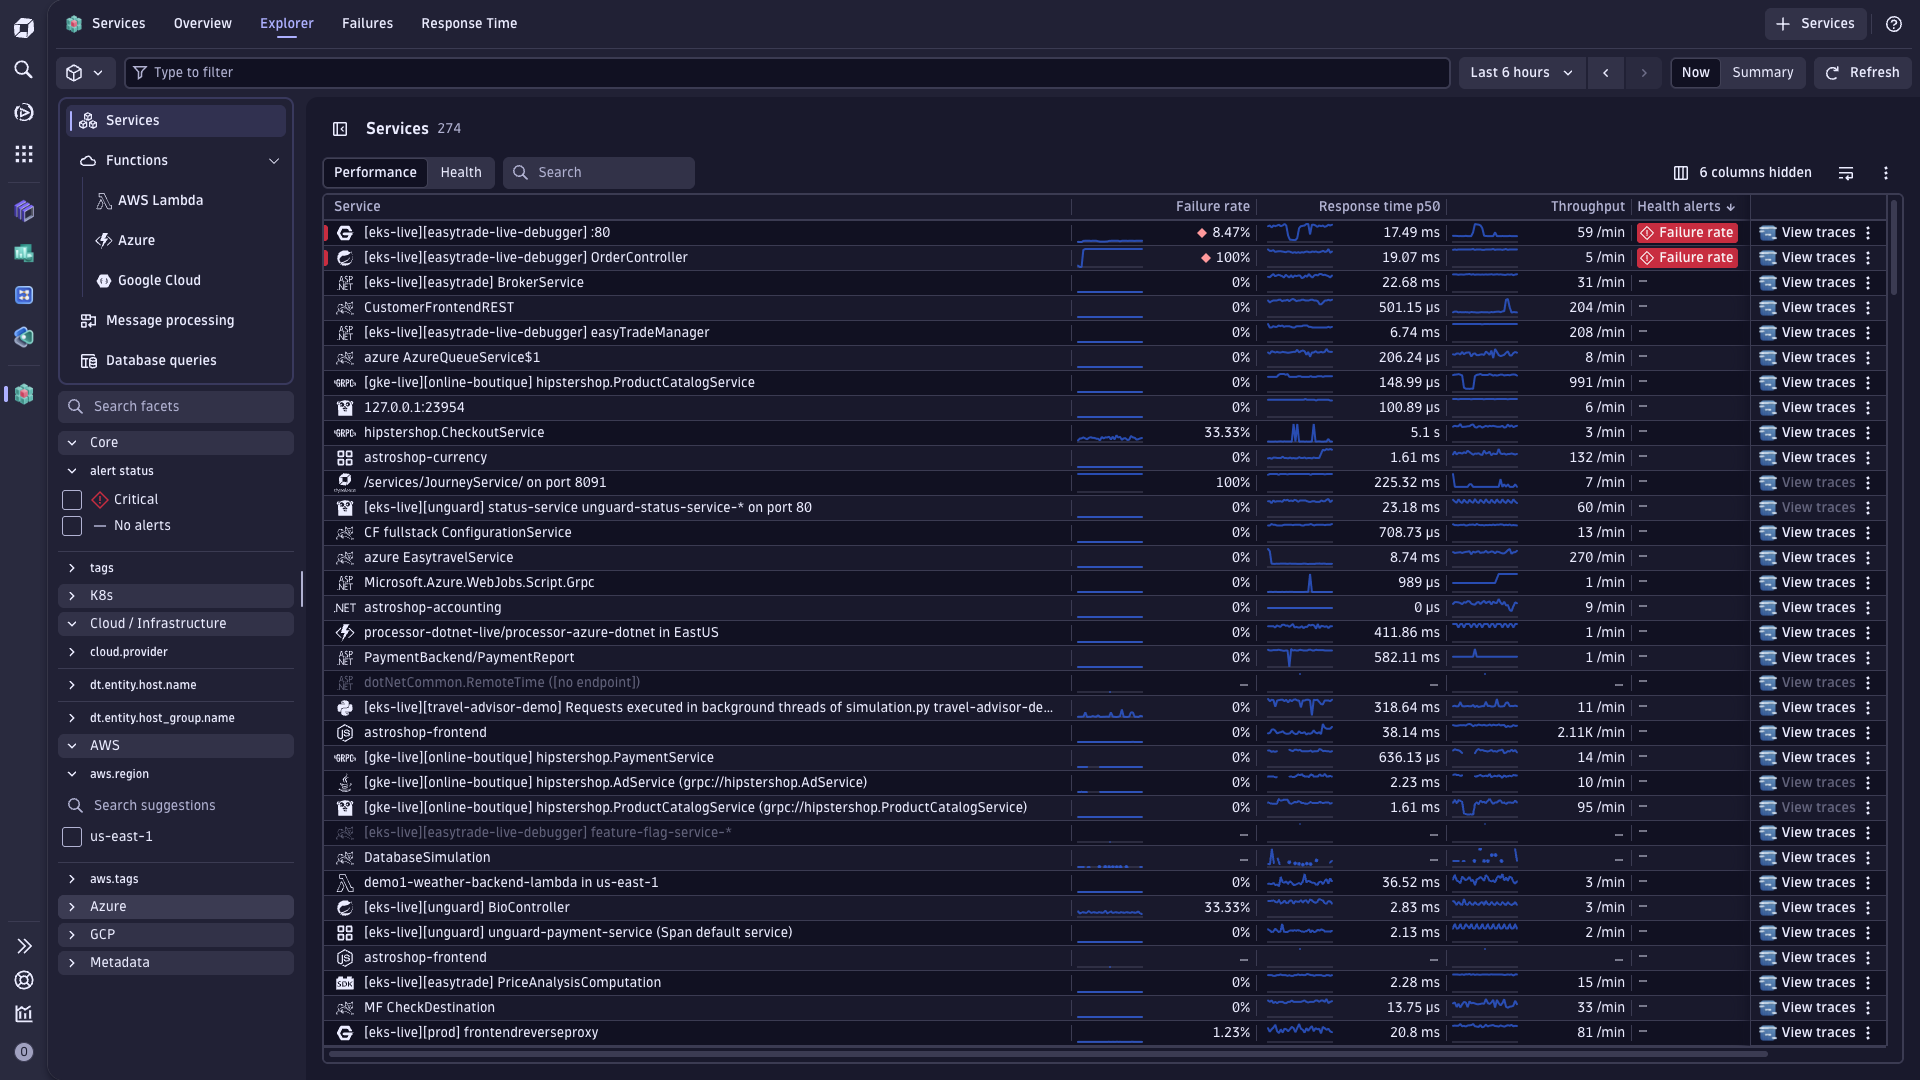
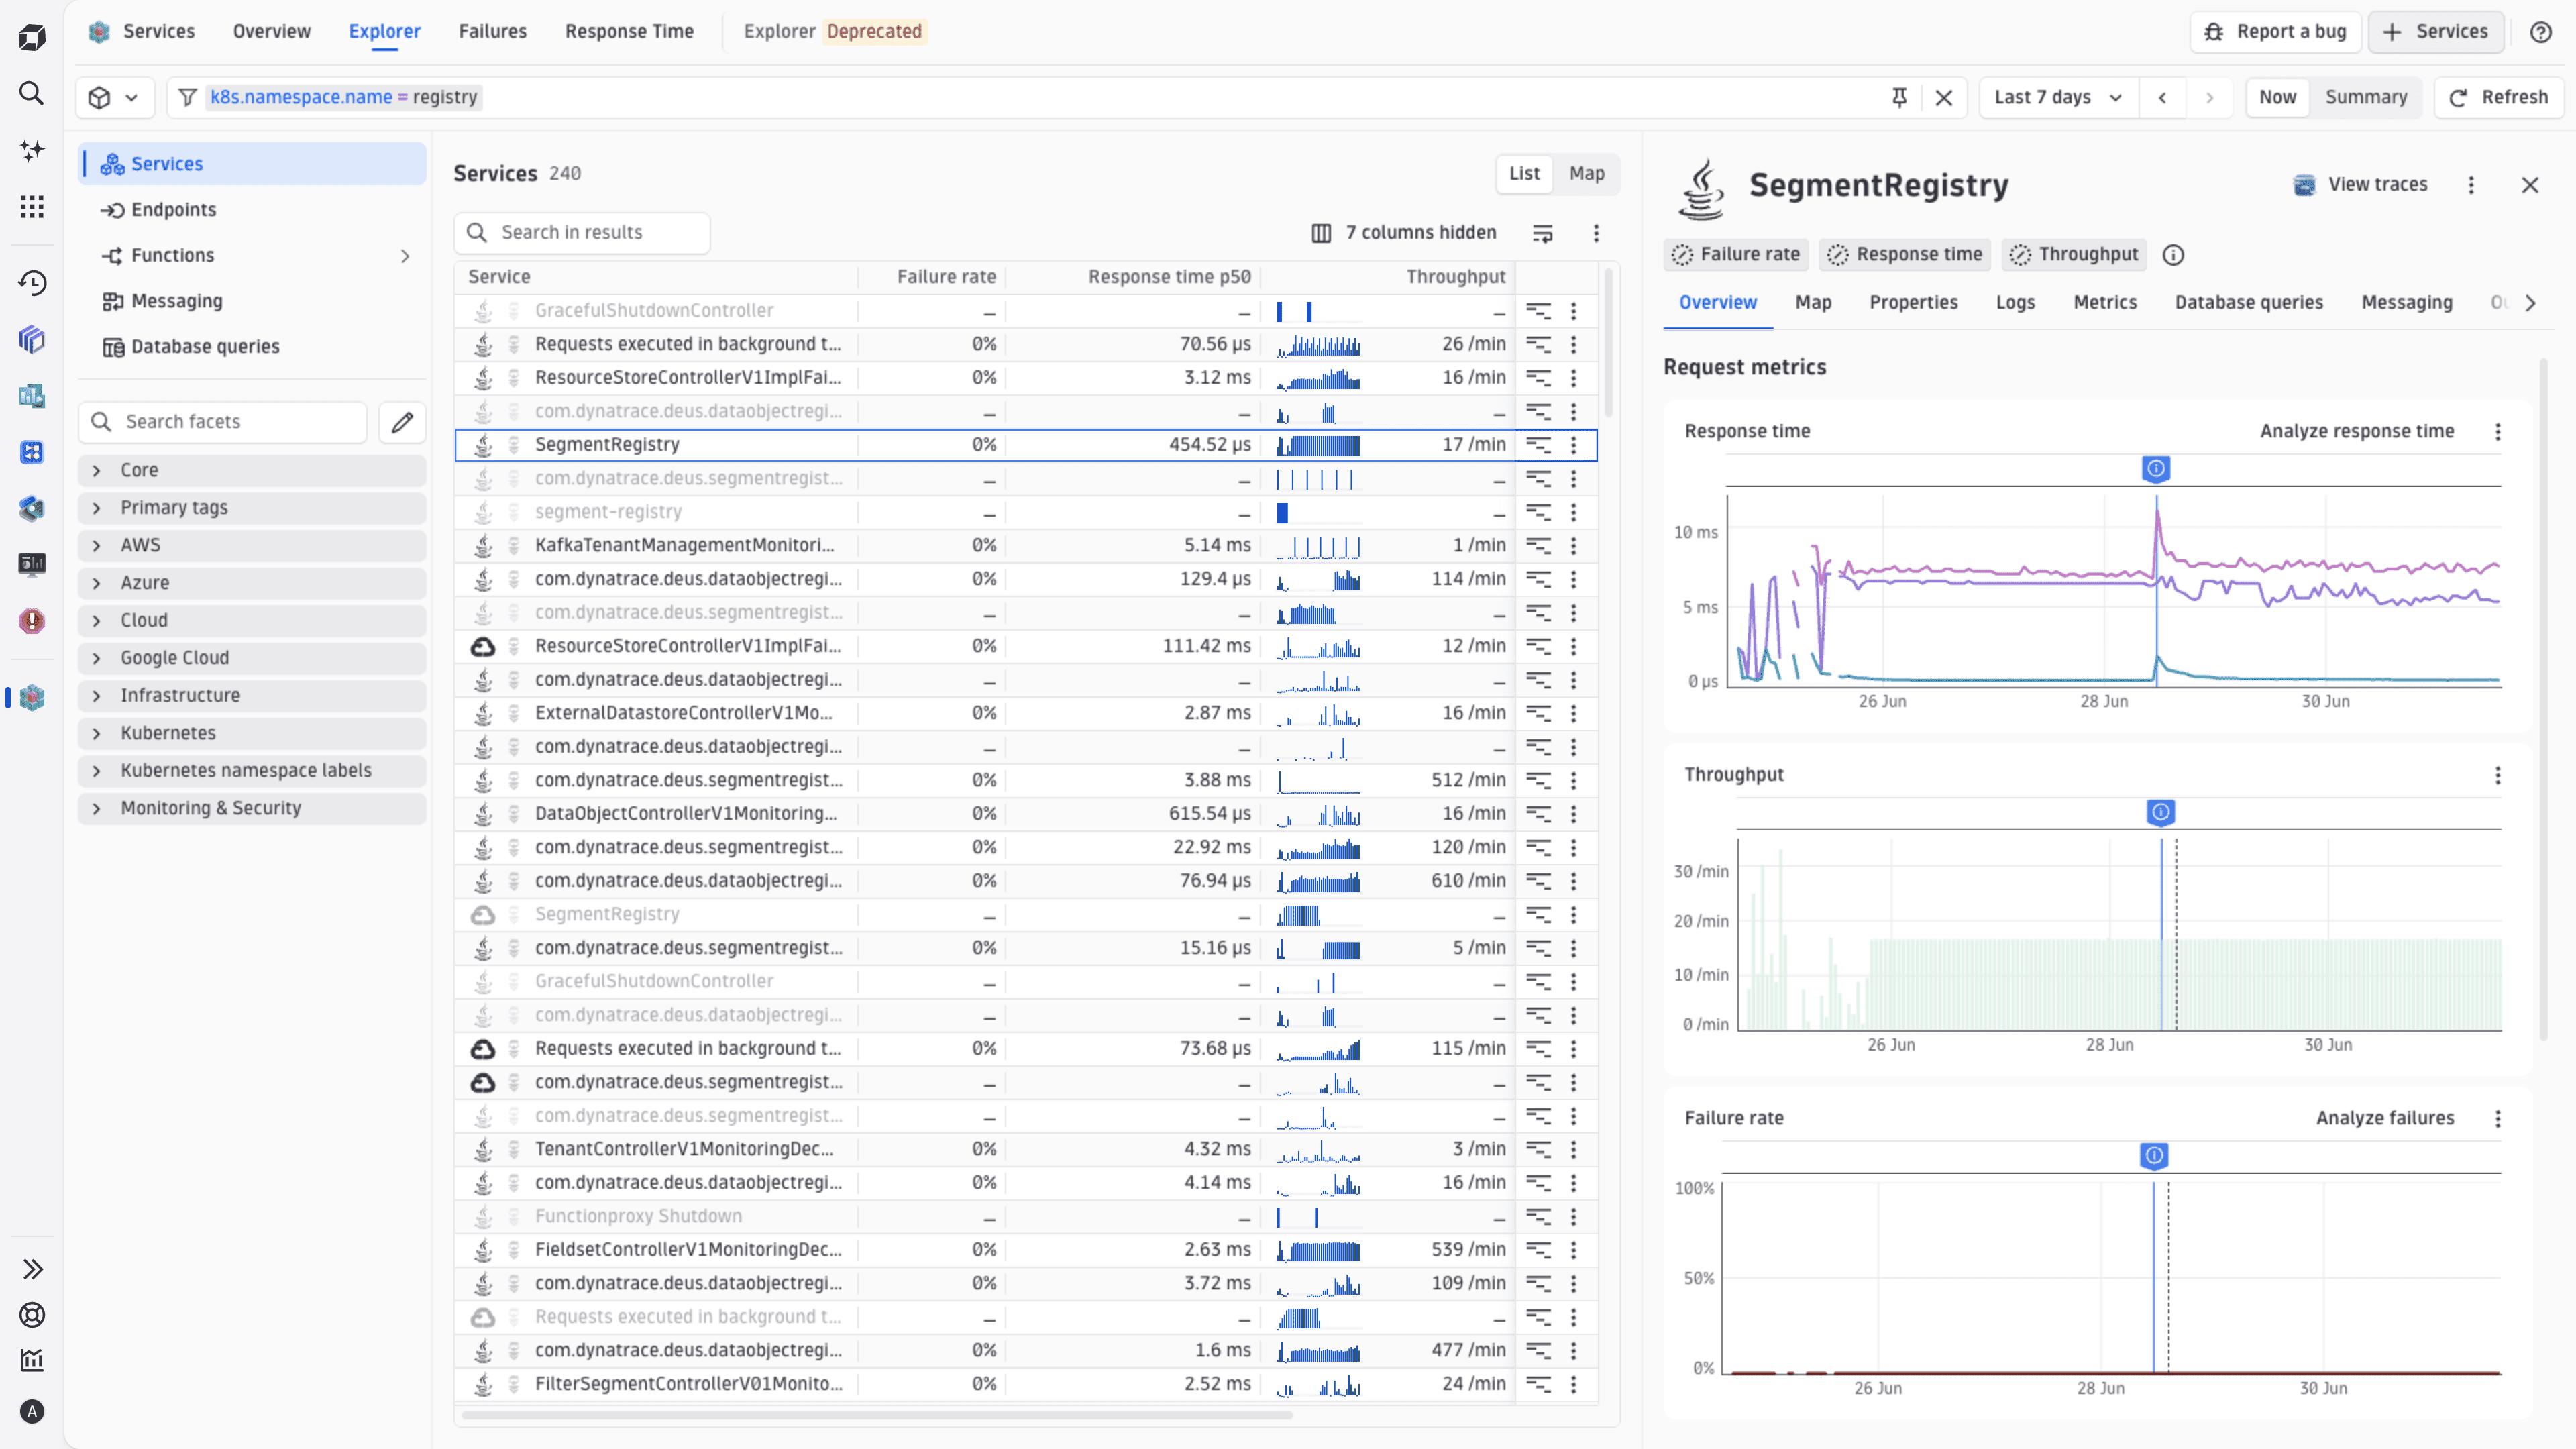
Services includes an Explorer view to monitor, filter, and drill into your services.
The Explorer tab is powered by time series queries and Smartscape 2.0 entities, which ensures a consistent service list across Dynatrace. It provides:
- Improved Segments support and filtering based on the primary Grail fields. For details, see Advanced filtering and release analysis.
- Dedicated Endpoints, Database queries, and Messaging views.
- Service Map view, which visualizes service interactions enriched by service details.
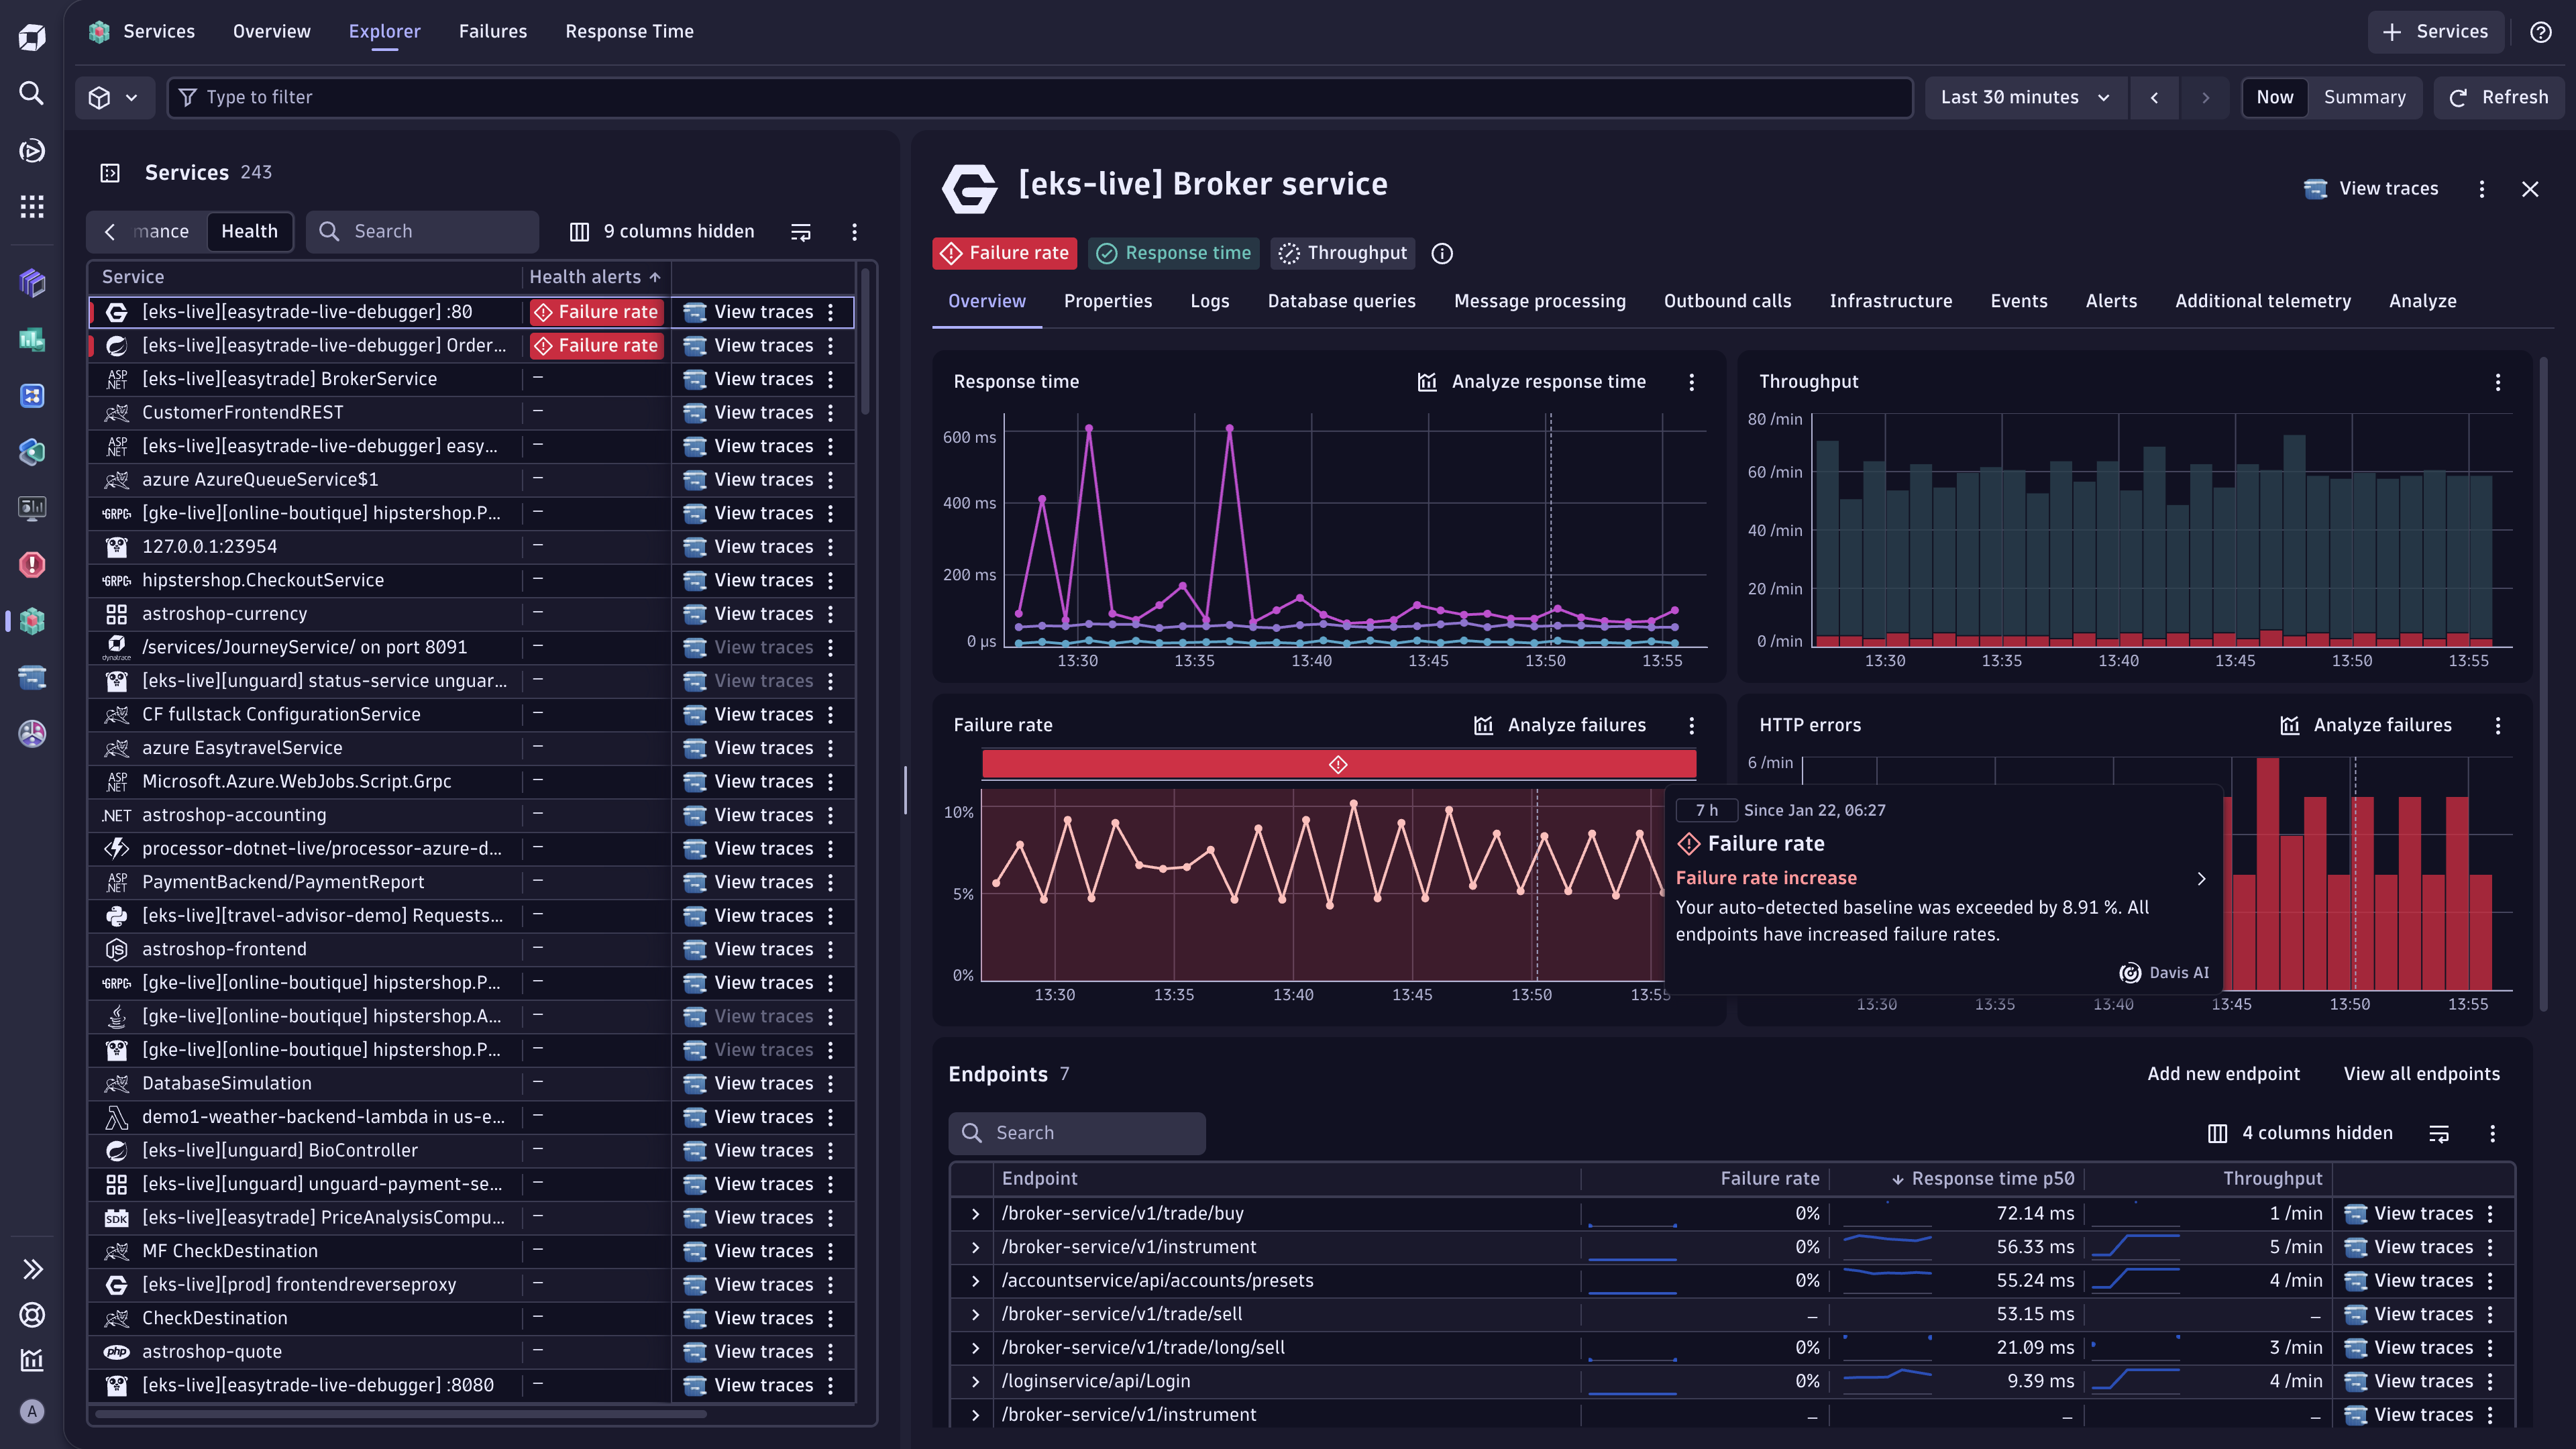
The Explorer tab also provides intelligent health alerts that surface issues demanding immediate attention. You can filter alerts by severity and drill into specific services experiencing degradation. When a service enters a critical state, the app highlights failure rates and provides context around what triggered the alert—whether it's increased errors, latency spikes, or infrastructure problems. For details, see Manage service health and performance.
The Explorer tab in Services follows the shared Explorer pattern used across Dynatrace apps. For details, see Explorer view in Dynatrace apps.
The previous Explorer tab is now called Explorer Deprecated. We recommend switching to the new Explorer tab, which offers new top-level entry points, primary Grail field filtering, and an integrated Service Map.
Advanced filtering and release analysis
Filter service views across releases and dozens of facets, including Kubernetes namespaces and deployment dimensions. Compare behavior across staging and production to identify configuration drift or isolate environment-specific issues.
You can filter your services by primary Grail fields, for example, using the k8s.cluster.name, k8s.namespace.name, aws.region, and azure.location fields. This way, you can find services in a specific Kubernetes cluster or namespace or display services in a particular cloud region or account.
Services also provides ready-made segments that join service entities with underlying metric data, enabling you to filter services by common dimensions, such as AWS region, Kubernetes namespace, or host group, without complex segment definitions or manual joins.
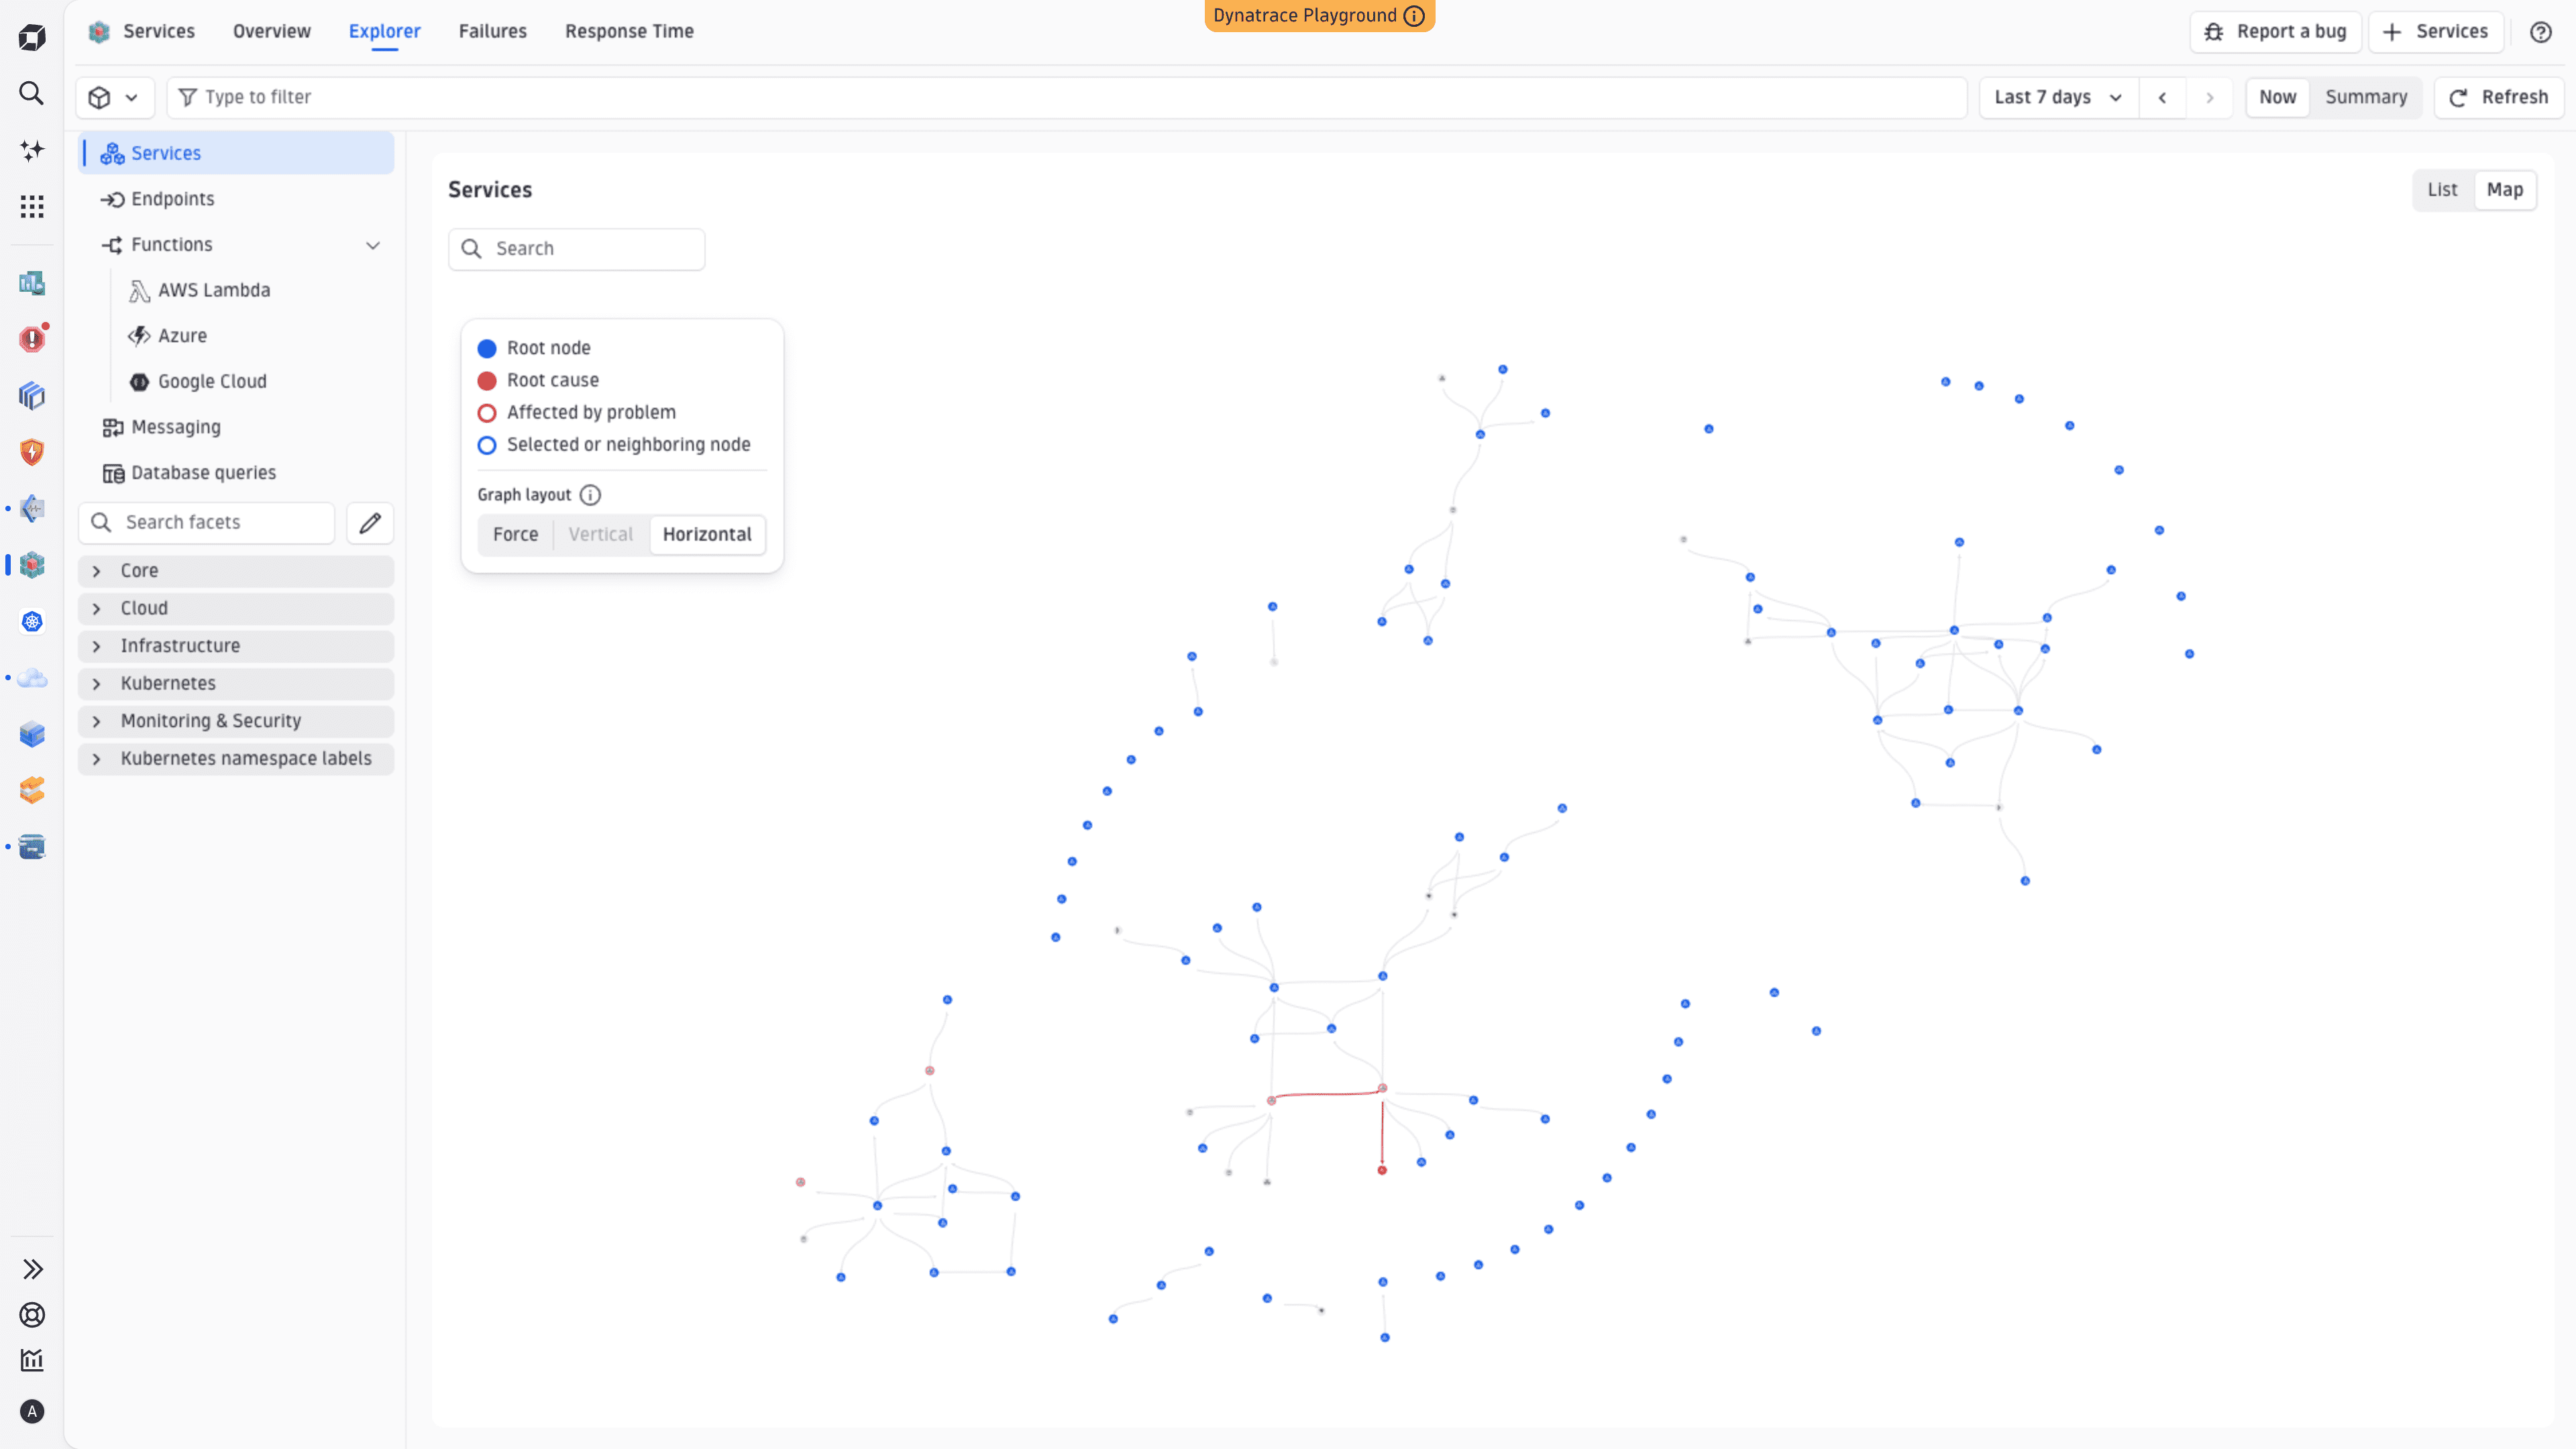
Service Map
The Service Map provides an interactive, automatically discovered topology of your services. It shows you the full frontend-to-backend chain—from browser and mobile clients through every service hop to databases and queues—with live health and performance signals on every node.
For details, see Explore service topology with service map.
Endpoints
For each of your services, check every detected endpoint with its response time, throughput, and failure rate. On the Explorer tab, select Endpoints to see the endpoint list across all your services. Endpoints are logical groupings of requests—for example, GET /orders/{id}—not individual URLs. This means you get stable, low-cardinality names you can use in dashboards, SLOs, and alerts.
To see endpoints for a particular service, select the required service on the Explorer tab, and then scroll down to the Endpoints section located on the Overview tab.
To see the individual URL paths behind an endpoint, select the endpoint and select View all URLs to open  Distributed Tracing with the raw paths visible. This is useful for understanding traffic patterns and deciding whether you need request naming rules to create more specific endpoint groupings.
For SDv1 services, endpoint metrics require the Enhanced endpoints feature to be activated. For SDv2 services, endpoints are always available.
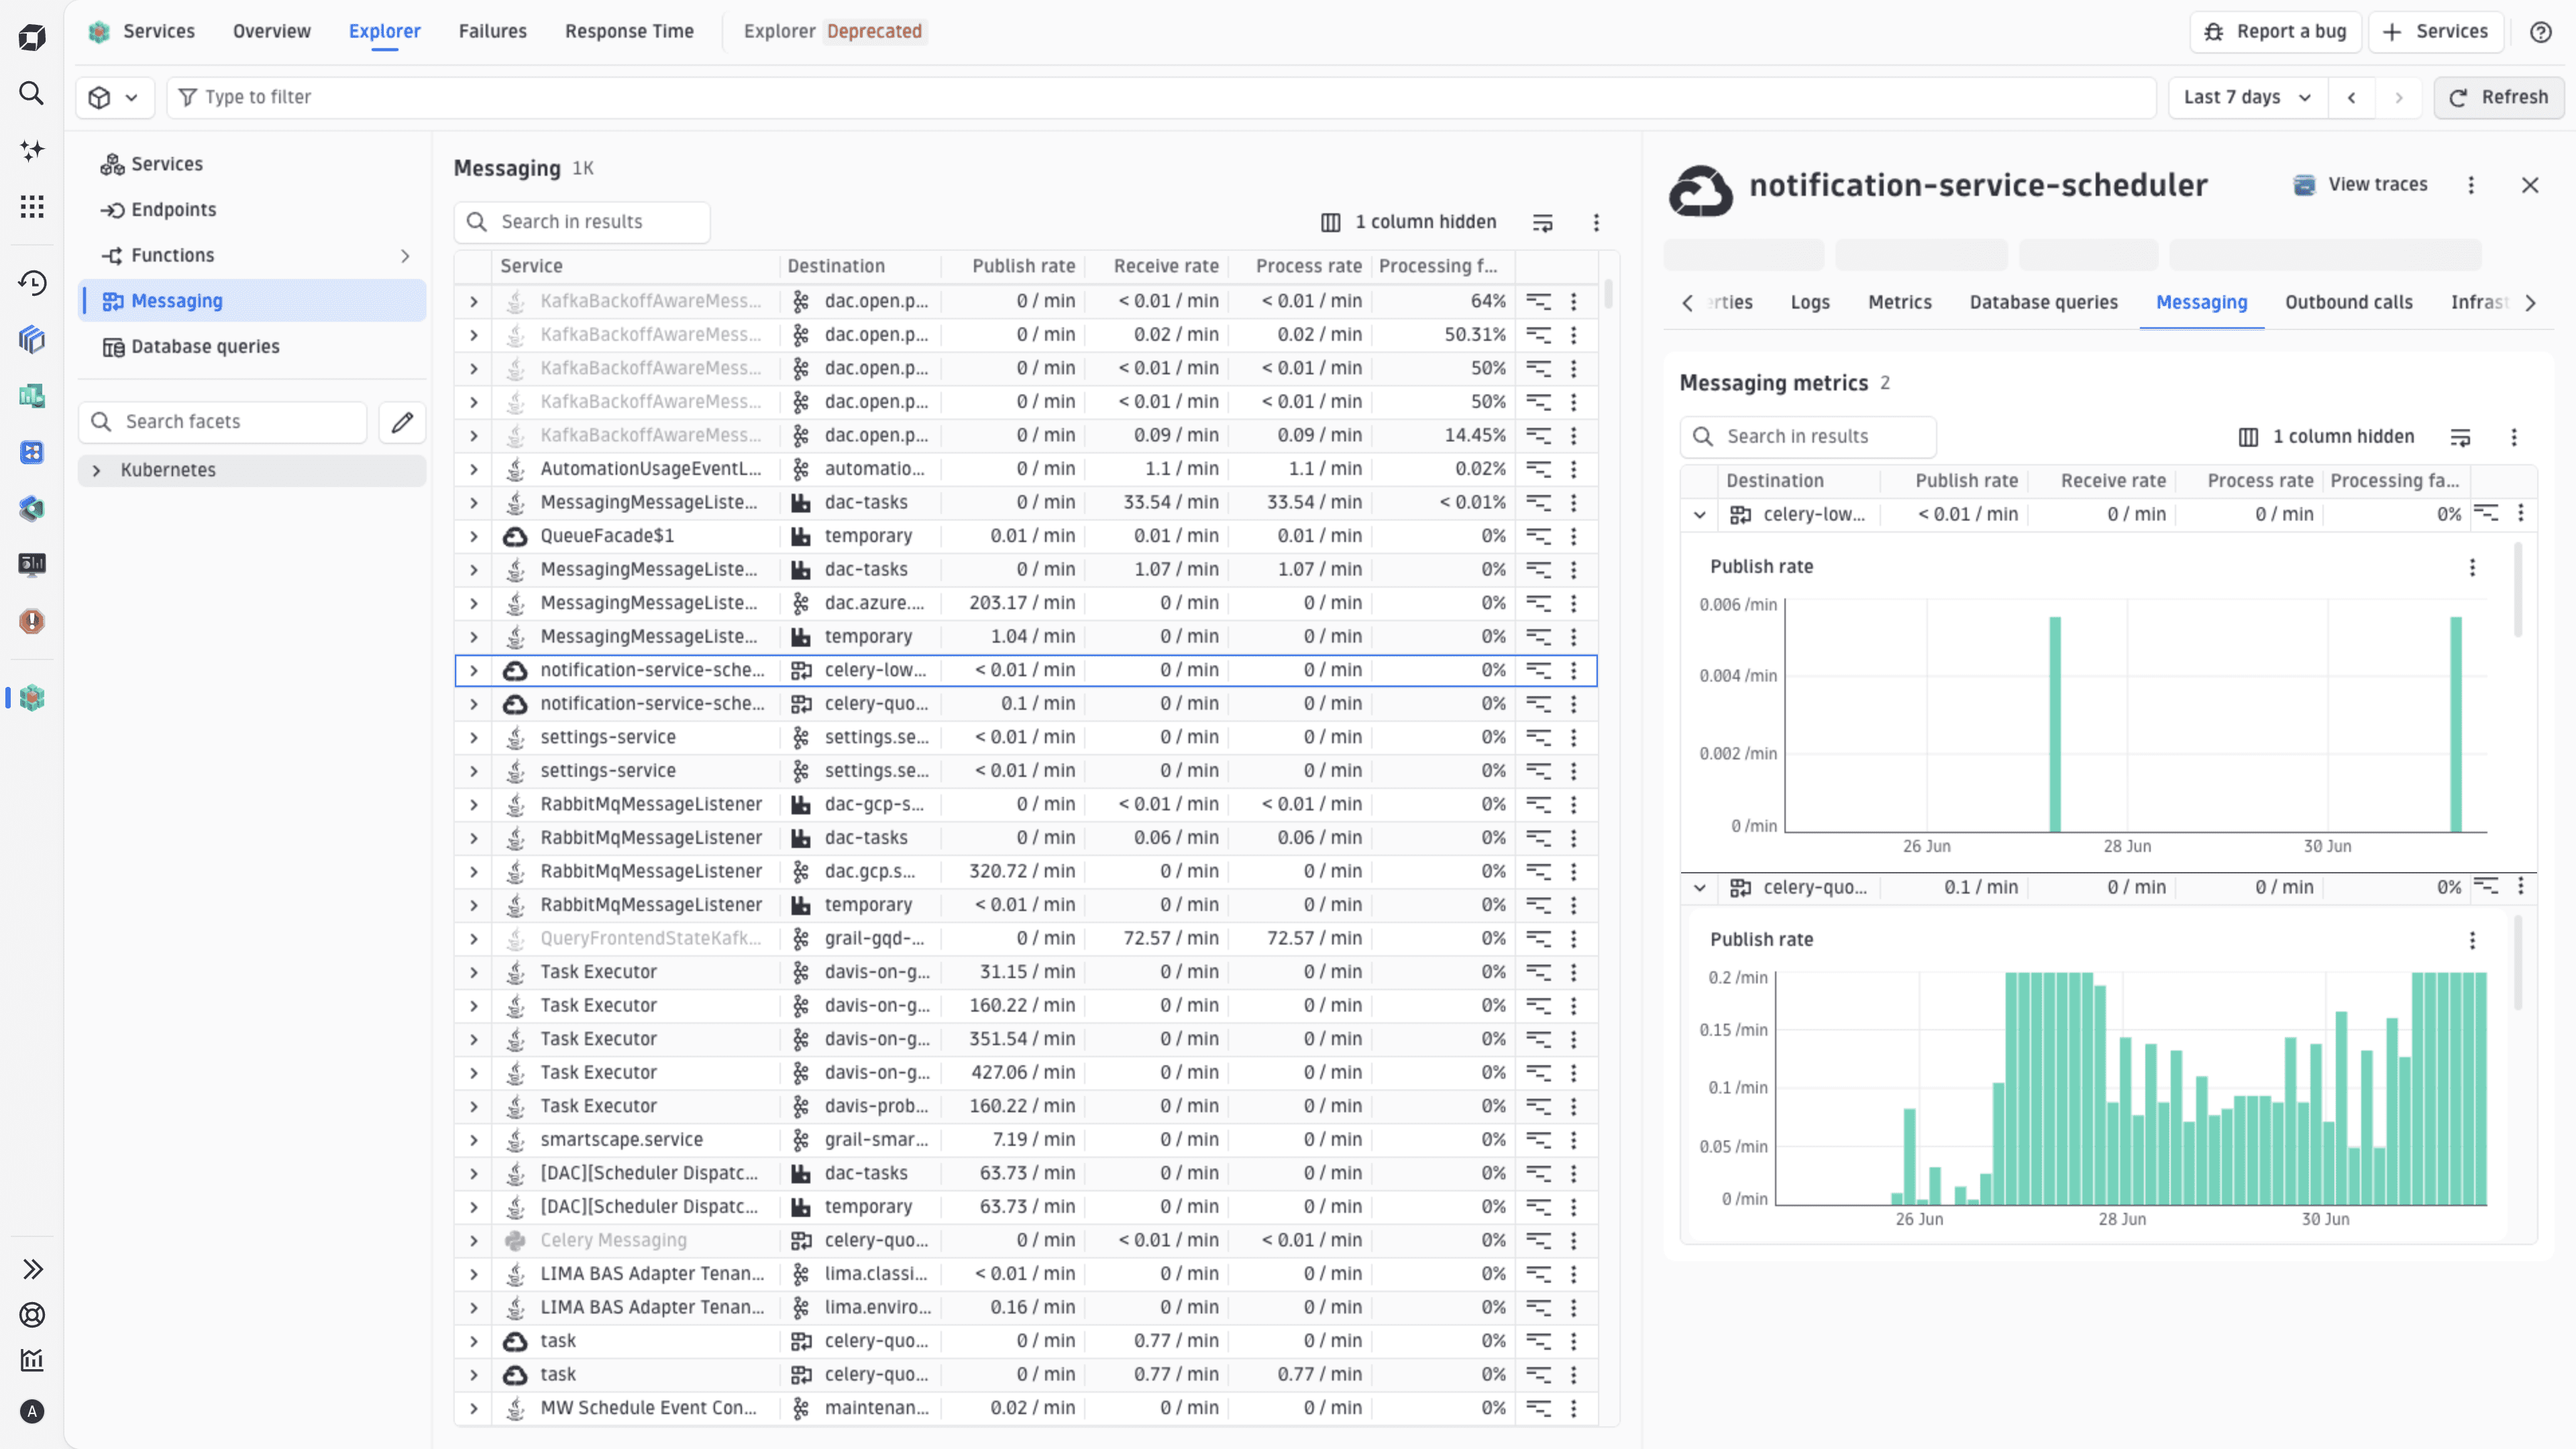
Messaging
In Services, go to Explorer tab, and select Messaging. From there, you can:
- Track message publish rates, receive rates, and processing throughput across your service topology.
- Identify bottlenecks in asynchronous workflows that traditional request-response monitoring misses.
- Visualize processing failure rates to pinpoint services struggling with message consumption or transformation logic.
- Maintain visibility into batch jobs, event processors, and queue-based integrations operating outside critical user-facing paths.
For additional details, see Monitor service message processing.
Sometimes, temporary queues are created with numerous unique identifiers in their names, generating thousands of distinct queue names that make aggregations unusable. For instructions on how to normalize queue names in the Messaging view, refer to Reduce cardinality of temporary queue names.
Database queries
With the Database queries view, Services provides detailed visibility into database queries executed by your services, allowing you to perform database query performance analysis.
You can access the Database queries view in two different ways:
- Select Database queries on the left side of Services to see all queries executed across your services.
- Select the required service, and go to the Database queries tab to view the queries made by this particular service.
Both options provide query performance information, with a default view that shows the top queries ranked by cumulative duration.
Redis statements often include unique identifiers or values, which results in thousands of distinct entries shown in the Database queries view. For tips on how to reduce cardinality for such database statements, refer to Database queries: Normalize Redis commands.
Use cases
- Discover which operations consume the most resources and where indexing or caching could improve performance.
- Eliminate blind spots by integrating infrastructure-layer database observability with service-level metrics.
Understand the query list
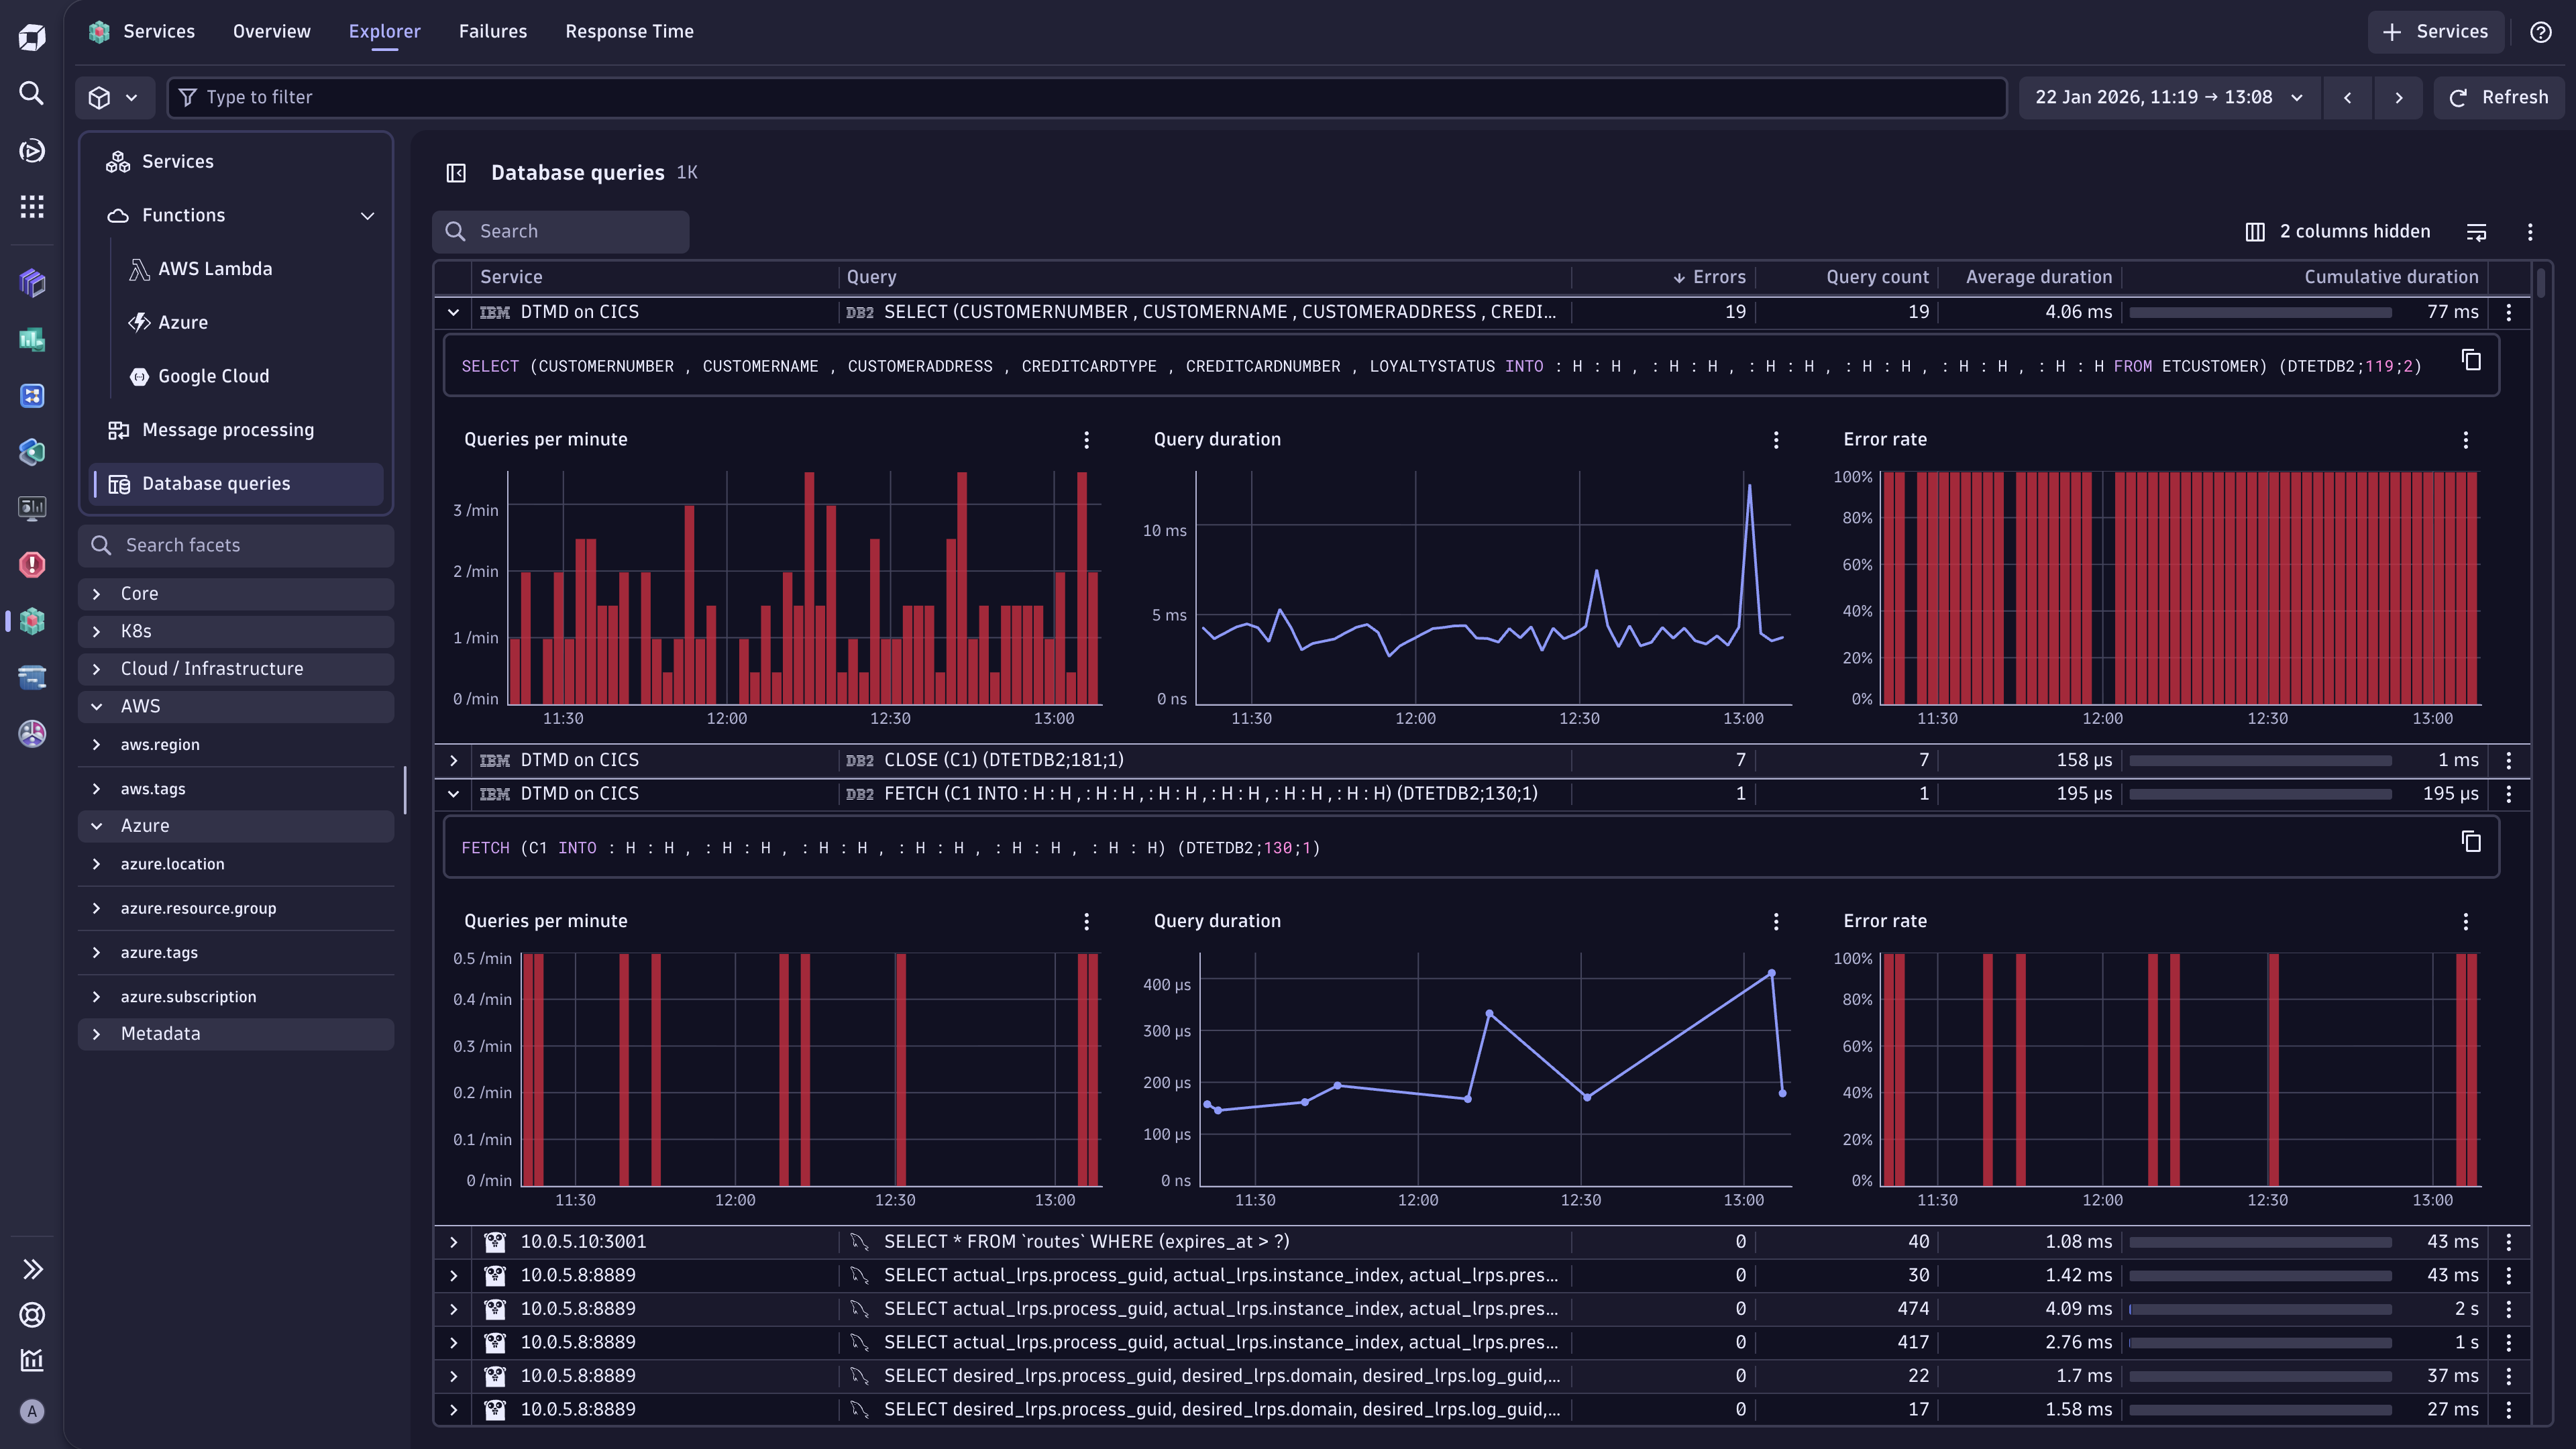
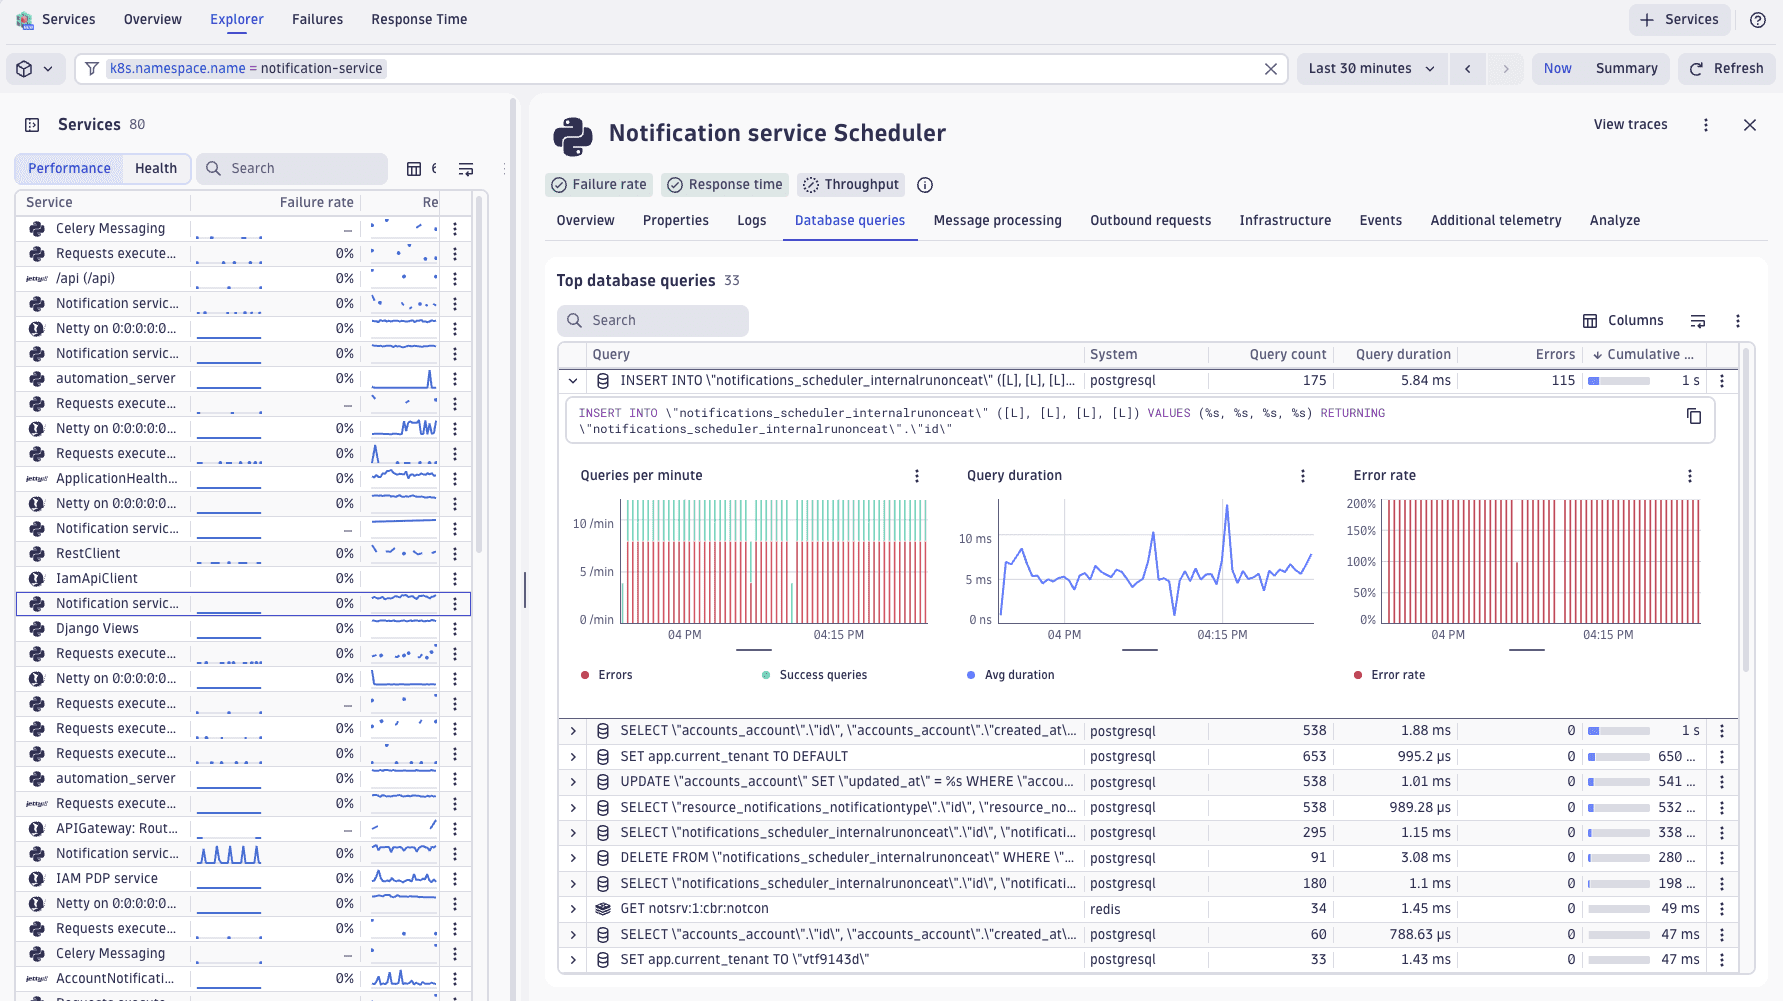
The Database queries view displays metrics about your most resource-intensive queries, sorted by cumulative duration.
The following information is available for each database query:
- Query: Full SQL or database operation.
- System: Database type, for example, PostgreSQL or Redis.
- Errors: Failed execution count.
- Query count: Total executions in the timeframe.
- Average duration: Average execution time per query.
- Cumulative duration: Total time your service spent on this query.
Select (Expand row) on the left of the query to display its time-series charts. These three time-series charts visualize the performance trends:
- Queries per minute: Shows execution frequency patterns and spikes.
- Query duration: Tracks average response time changes over time.
- Error rate: Displays query failure percentage.
Find performance bottlenecks
Sort the database query list by one of the following parameters:
- Cumulative duration to immediately see which queries are consuming the most total time in your service.
- Average duration to find your slowest queries.
- Query count to identify high-frequency operations that might benefit from caching or indexing.
Remember that a query executing thousands of times with a modest duration can impact performance just as much as a slow query with fewer executions. By seeing both frequency and duration together, you can prioritize optimization efforts where they'll have the greatest impact.
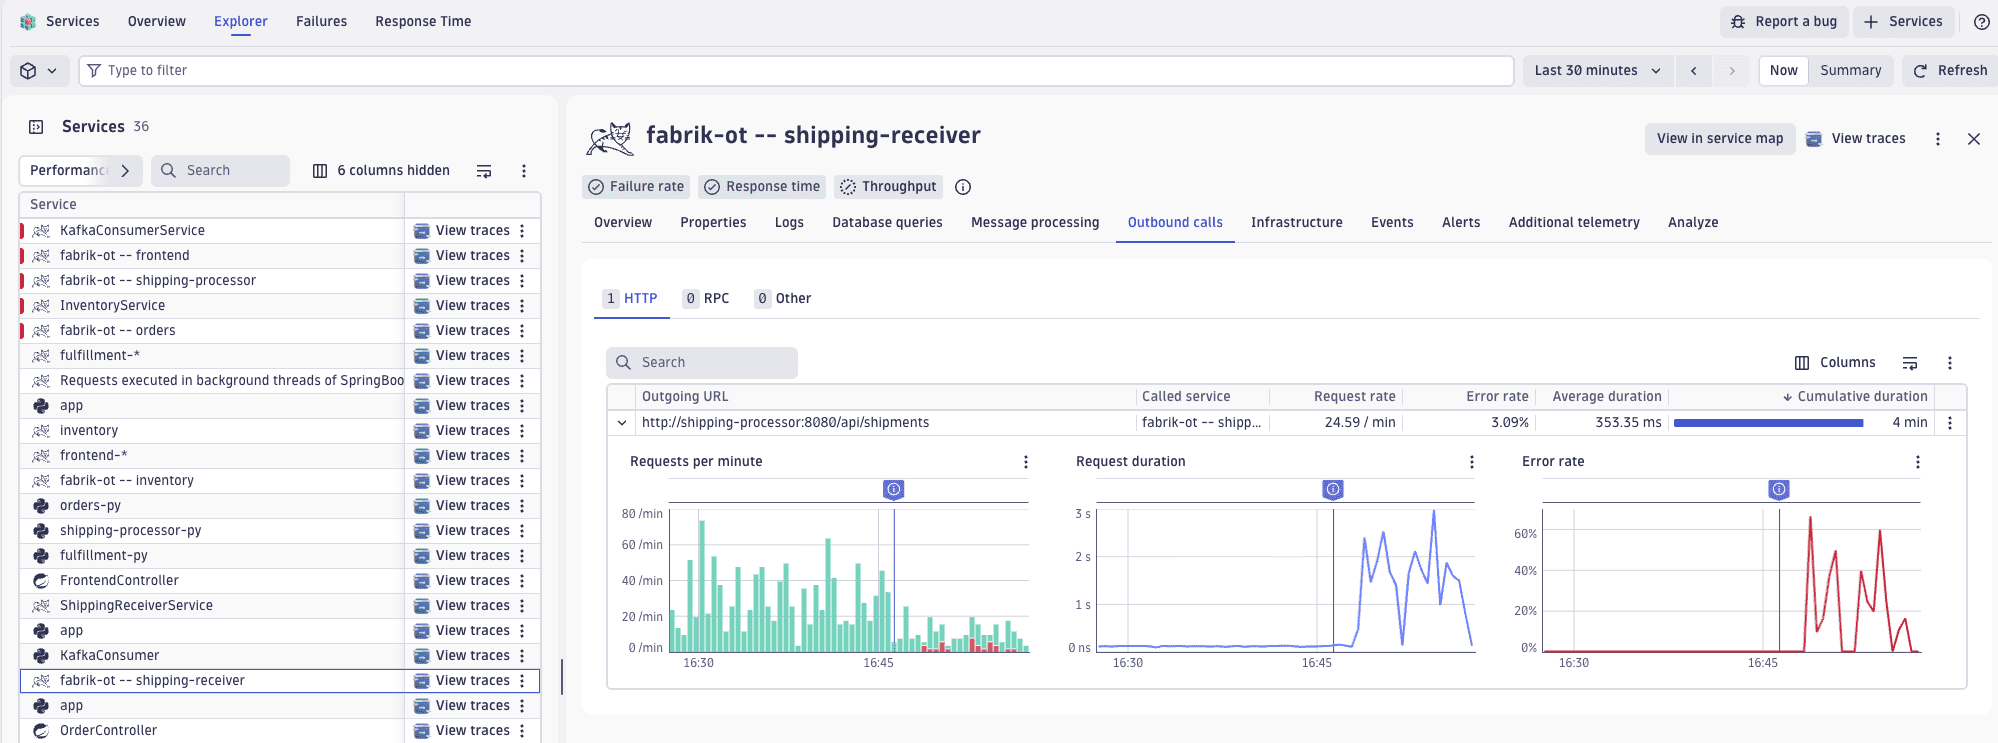
Outbound calls
Services captures and analyzes outbound calls made by your services, and then presents the most frequently called and slowest external dependencies ranked by request rate and duration.
On the Explorer tab in Services, select a service, and then go to the Outbound calls tab. The Outbound calls view displays request rate, error rate, average duration, and cumulative duration for each outbound call. Discover which external calls consume the most resources and where performance bottlenecks exist in your service dependencies. By integrating outbound call observability with service-level metrics, you can eliminate blind spots and quickly determine if issues originate within your service or downstream.
URLs with variables in the path name might result in unusable data aggregations. For guidance on reducing cardinality in outbound calls, refer to Limit cardinality of external calls.
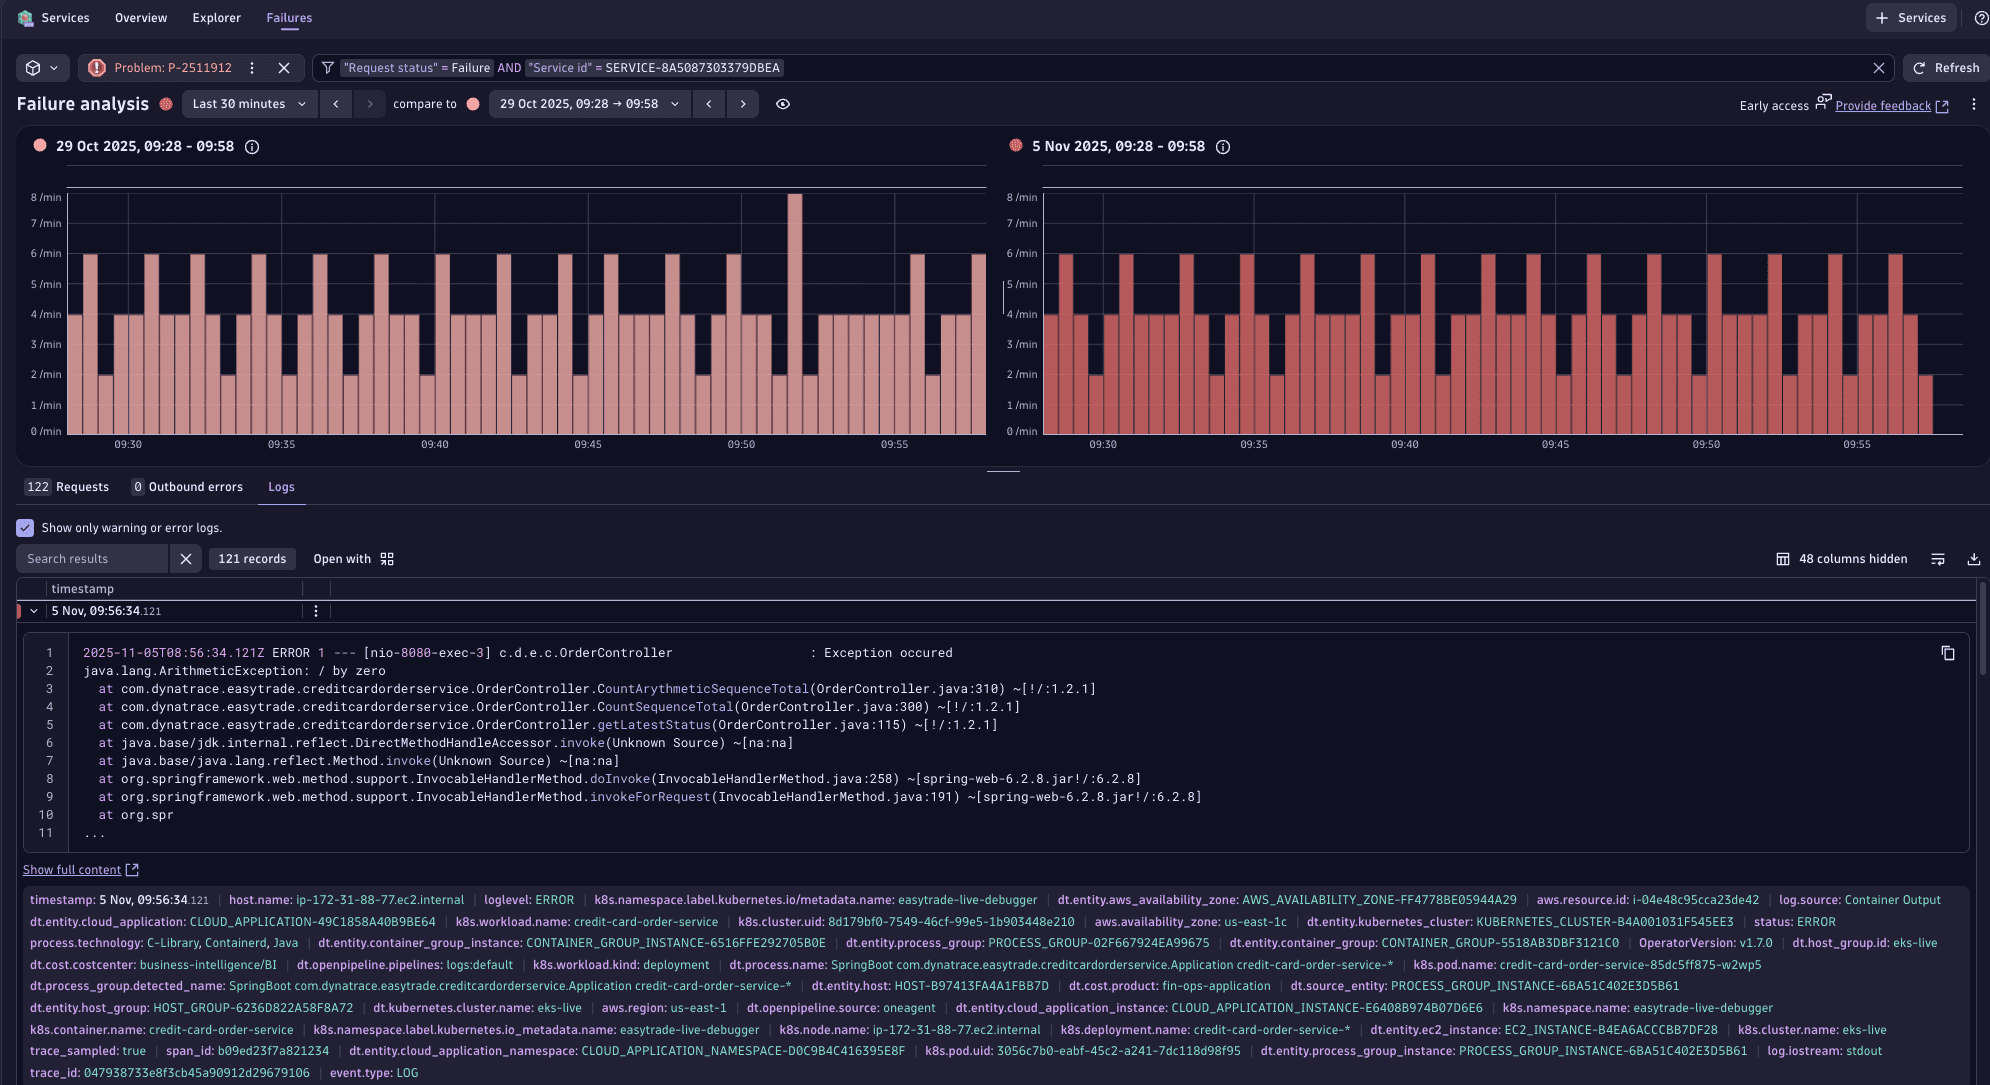
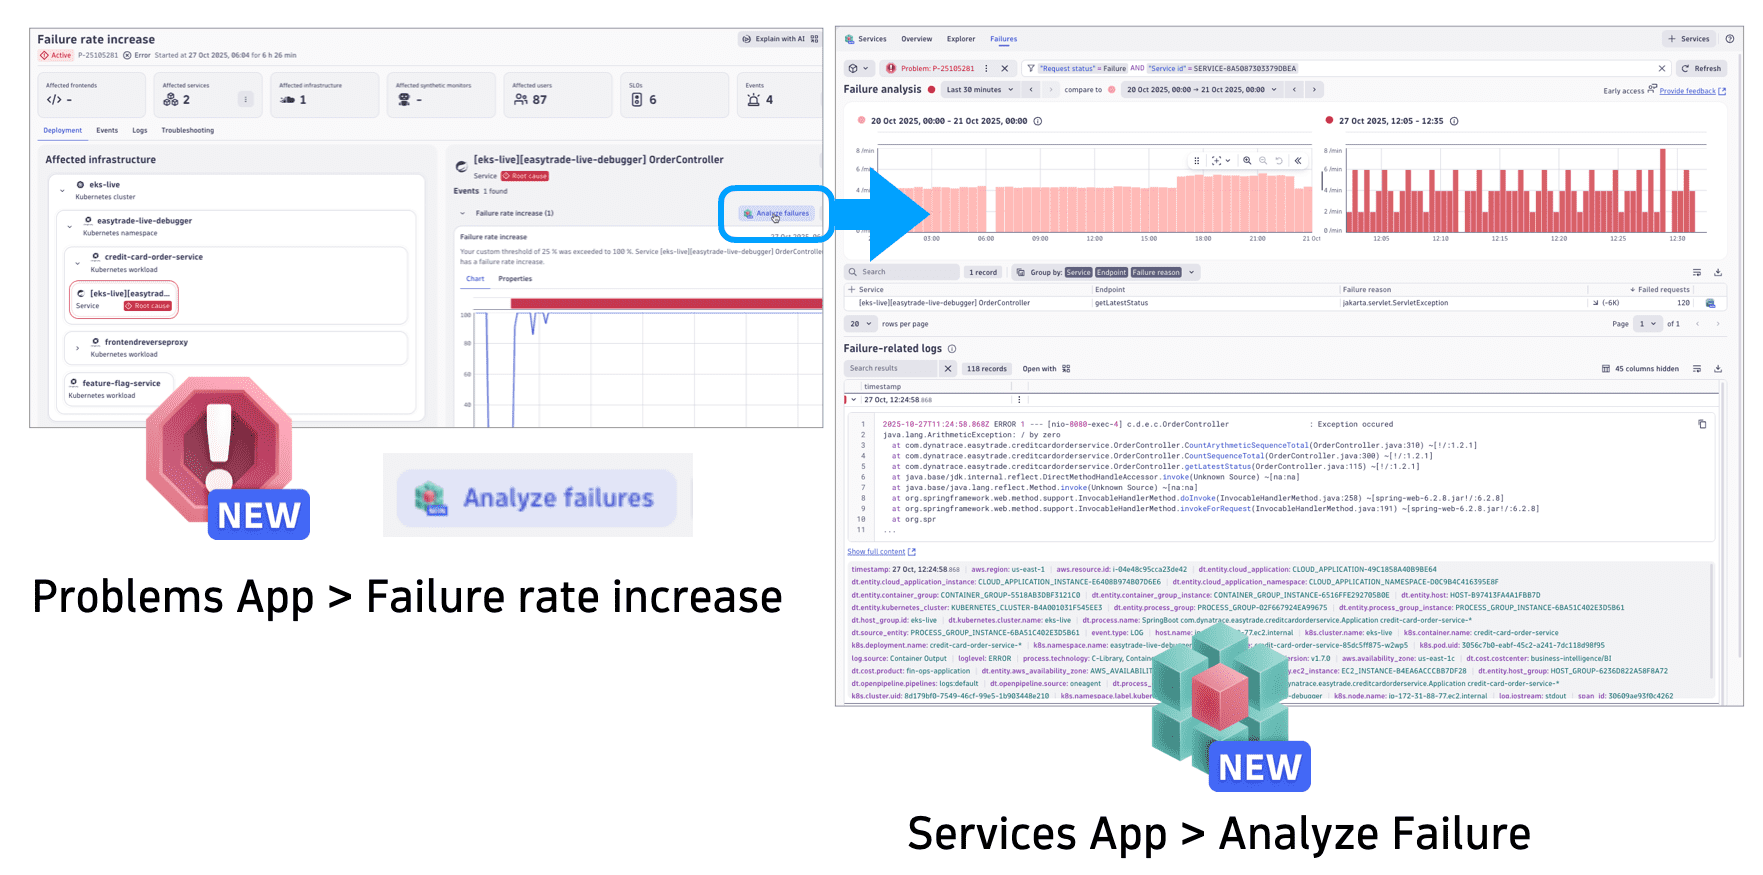
Failure analysis and time-based comparisons
Go to the Failures tab to overlay current failure patterns against baseline periods and immediately identify regressions. The visualization distinguishes between different failure types and severities, helping teams prioritize based on user impact.
For details, see Failure Analysis.

 Problems maps the entire impact chain from an initial failure through dependent services, infrastructure, and affected users.
Navigating from Problems to Services Failure Analysis takes a single click, allowing for seamless investigation from high-level problem detection to granular service-specific error details, including timeframe comparisons and logs.
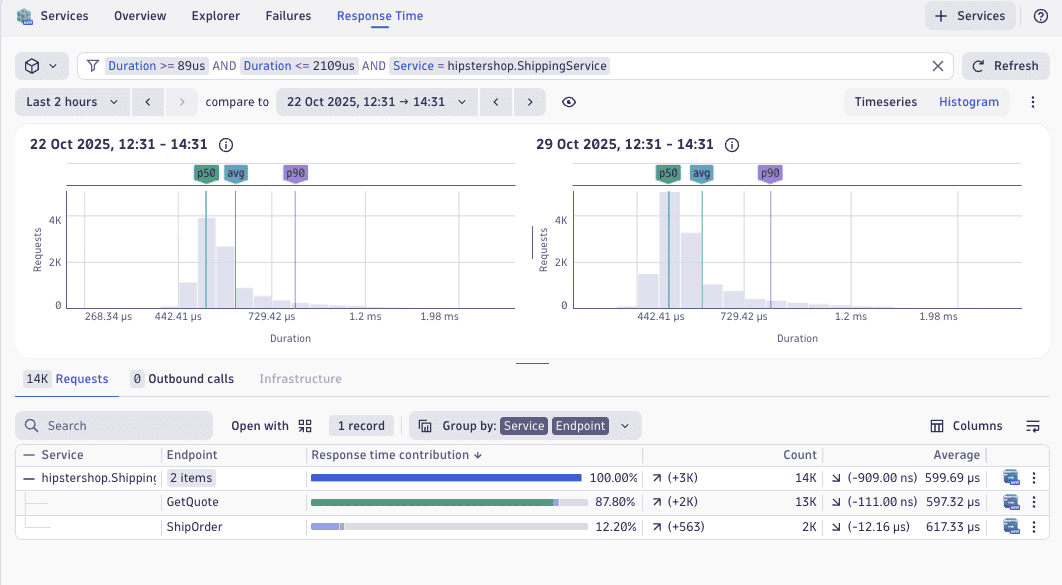
Response time analysis and comparison
Go to the Response Time tab to track response time and understand typical behavior versus worst-case scenarios. Analyze performance trends across different periods to identify exactly when a degradation began and what was the reason for it. Correlate latency changes with deployment events or traffic pattern shifts to quickly pinpoint the cause of performance regressions.
For details, see Response time analysis.
Concepts
Service-related concepts, including distributed traces and spans, are central concepts in Dynatrace observability. Understanding these concepts enables effective monitoring and analysis of distributed systems. See Service-related concepts.
Tutorials

 Services