Services
- Latest Dynatrace
- Overview
- 4-min read
Services are an application's fundamental building blocks. From an observability standpoint, they provide application owners with critical metrics to monitor application health.
 Services provides detailed insights into the performance and health of your services and includes useful features like Service flow and Backtrace.
Prerequisites
Permissions
Check the minimal set of permissions required to run Services.
Installation
Make sure Services is installed in your environment.
Get started
In Dynatrace, go to Services to launch the app.
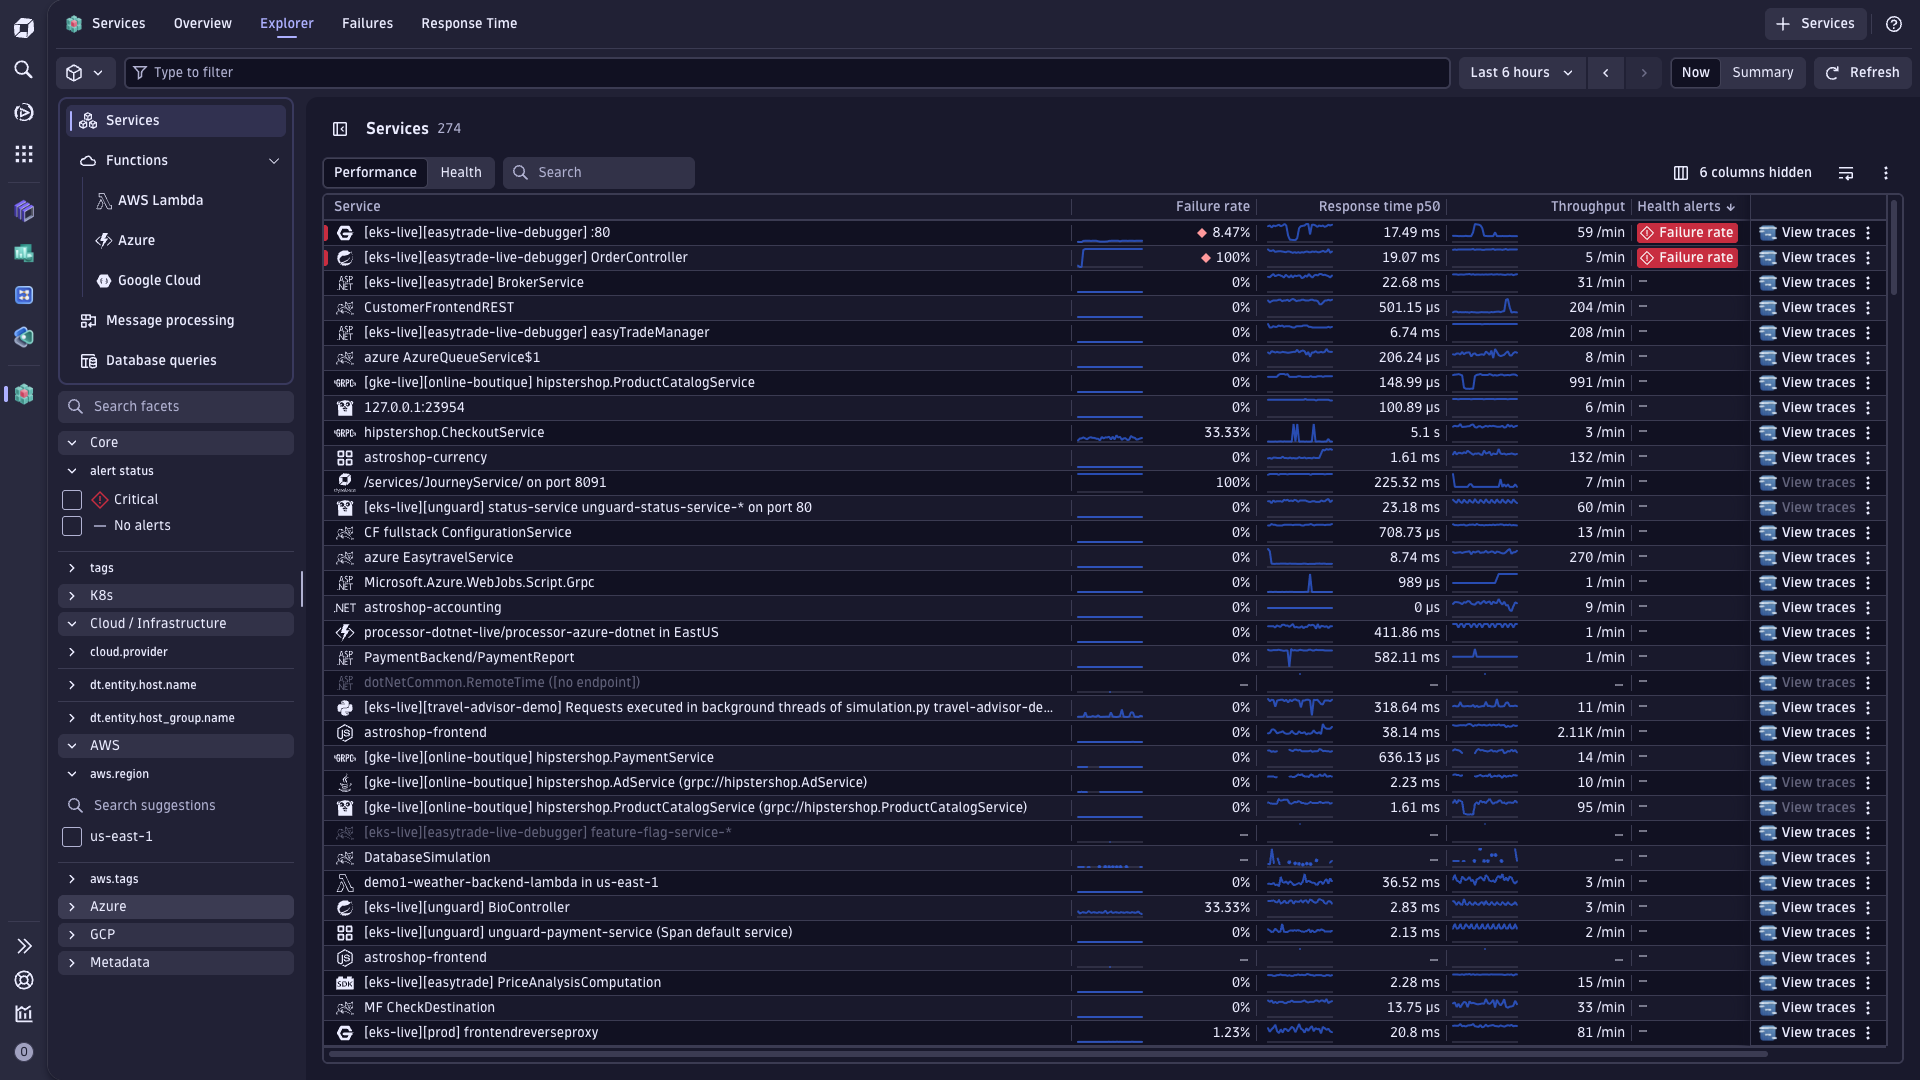
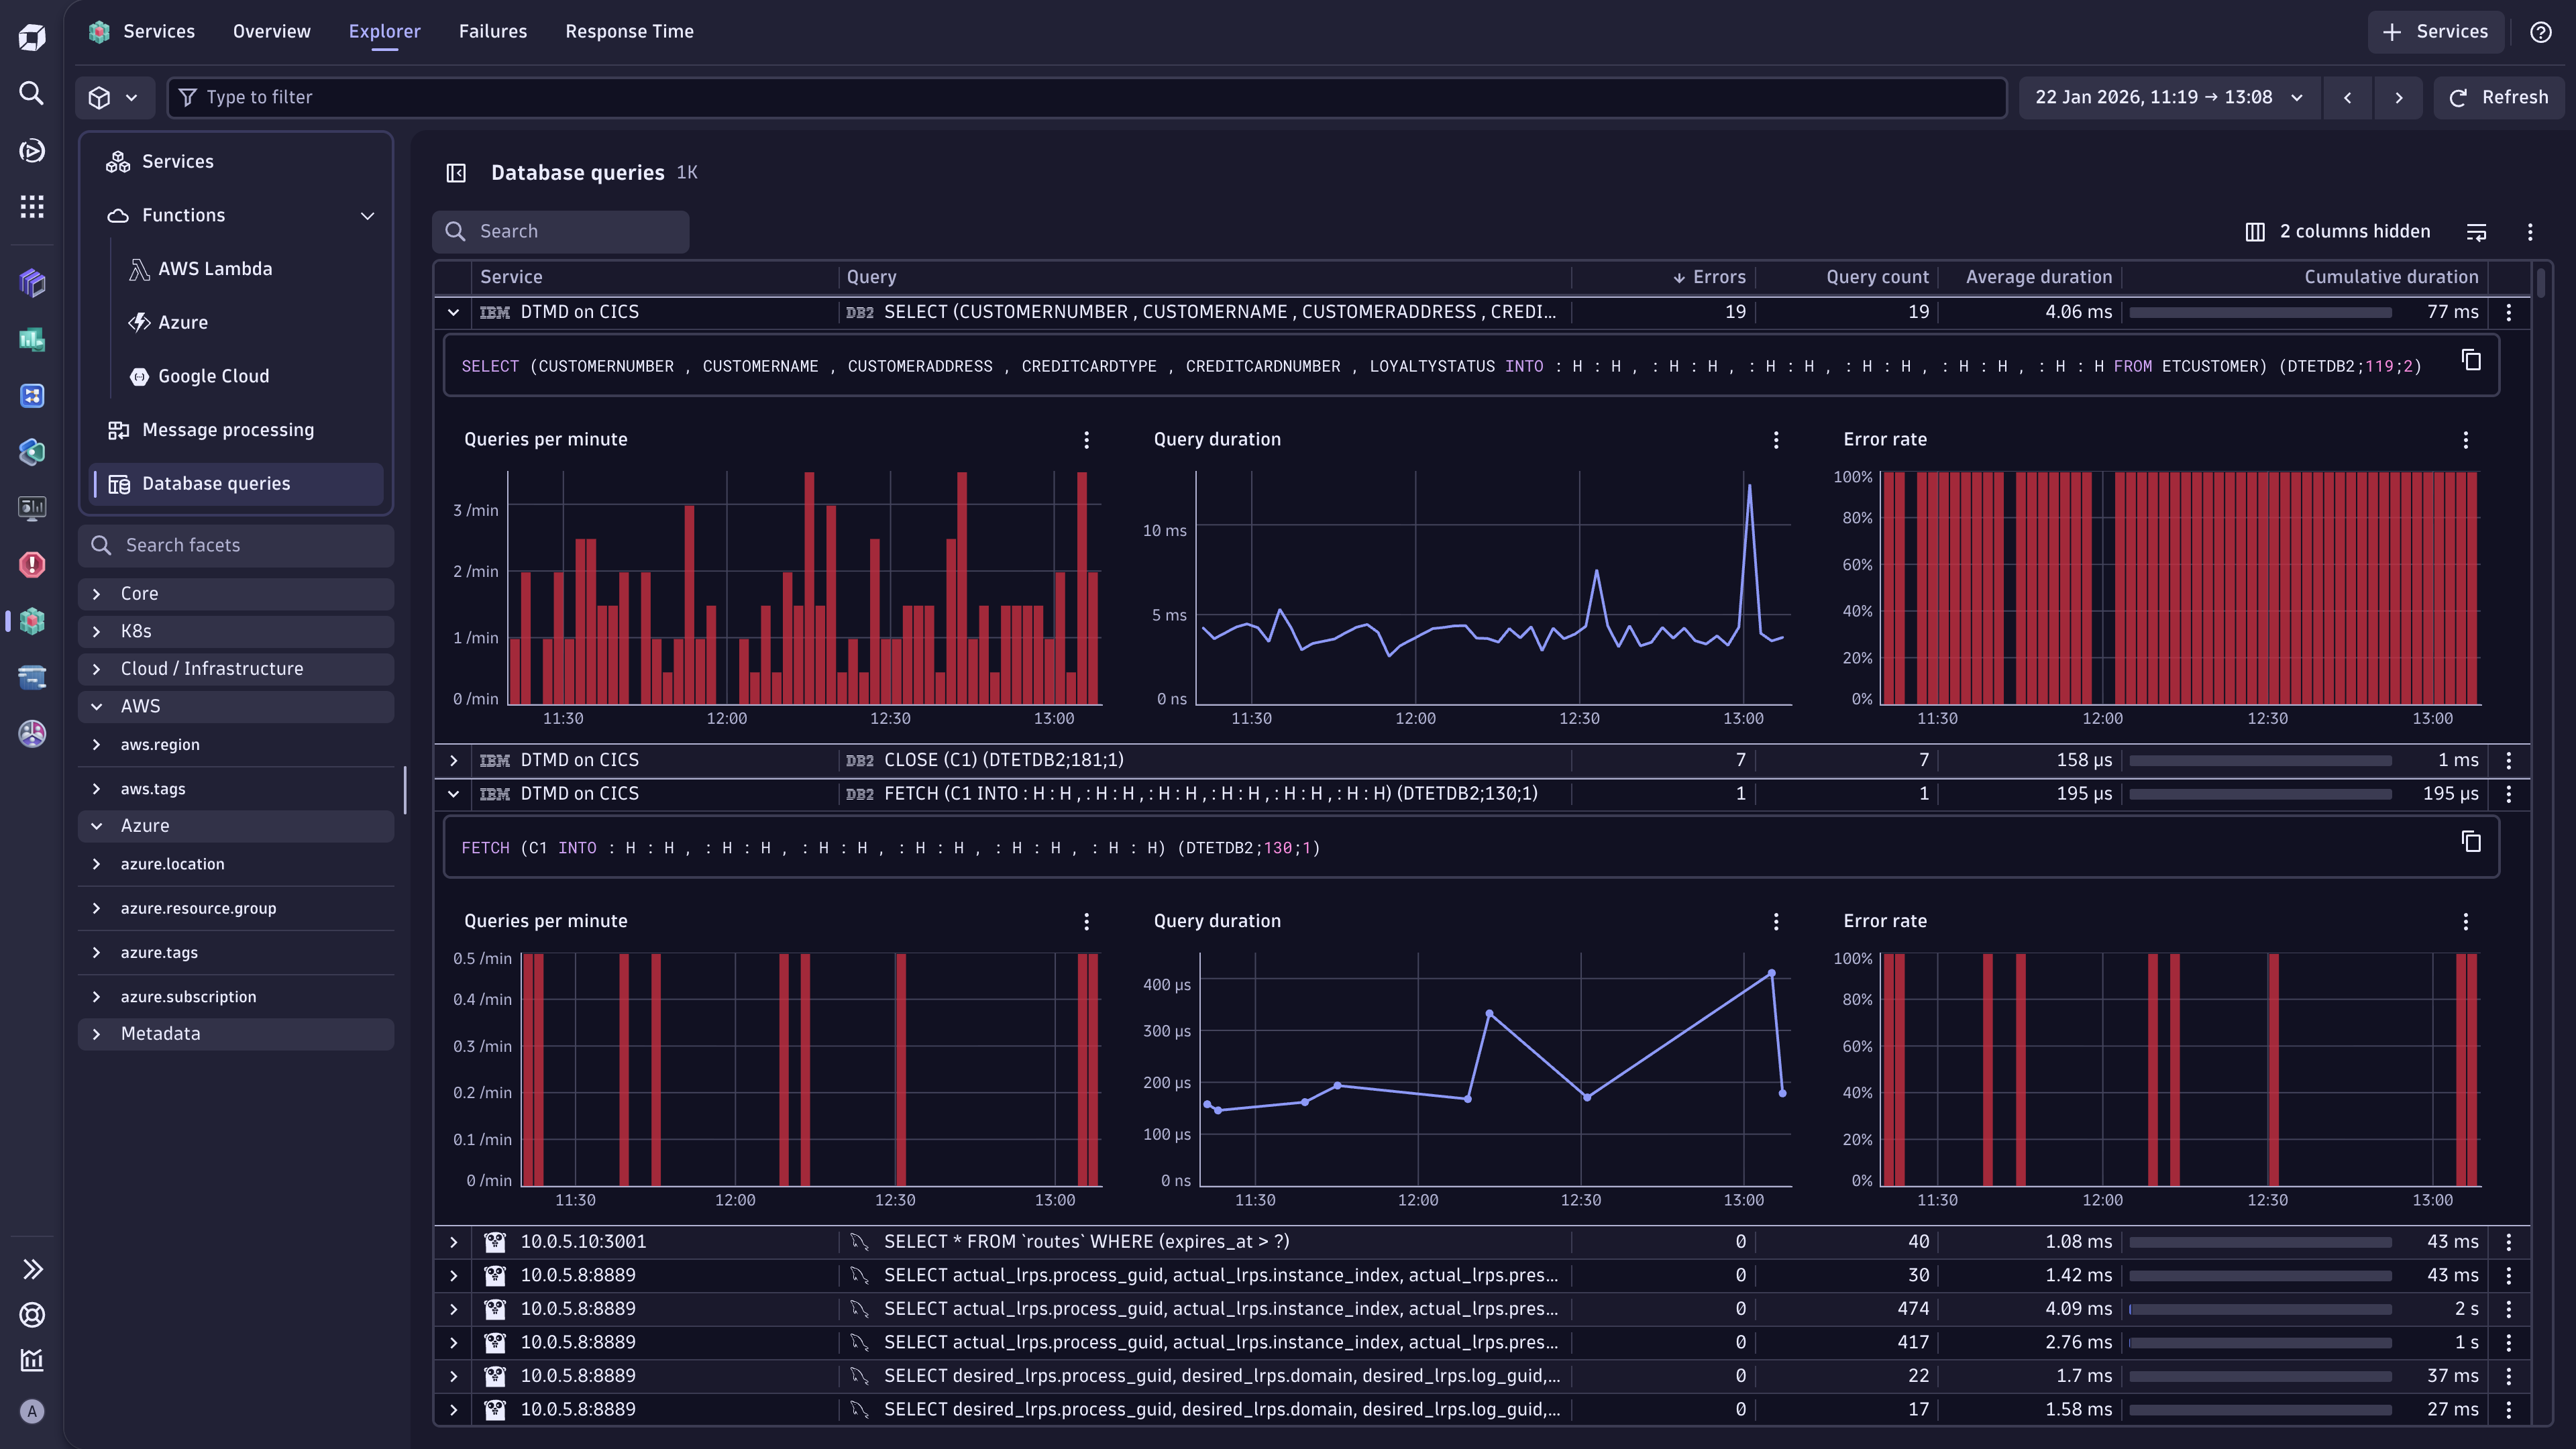
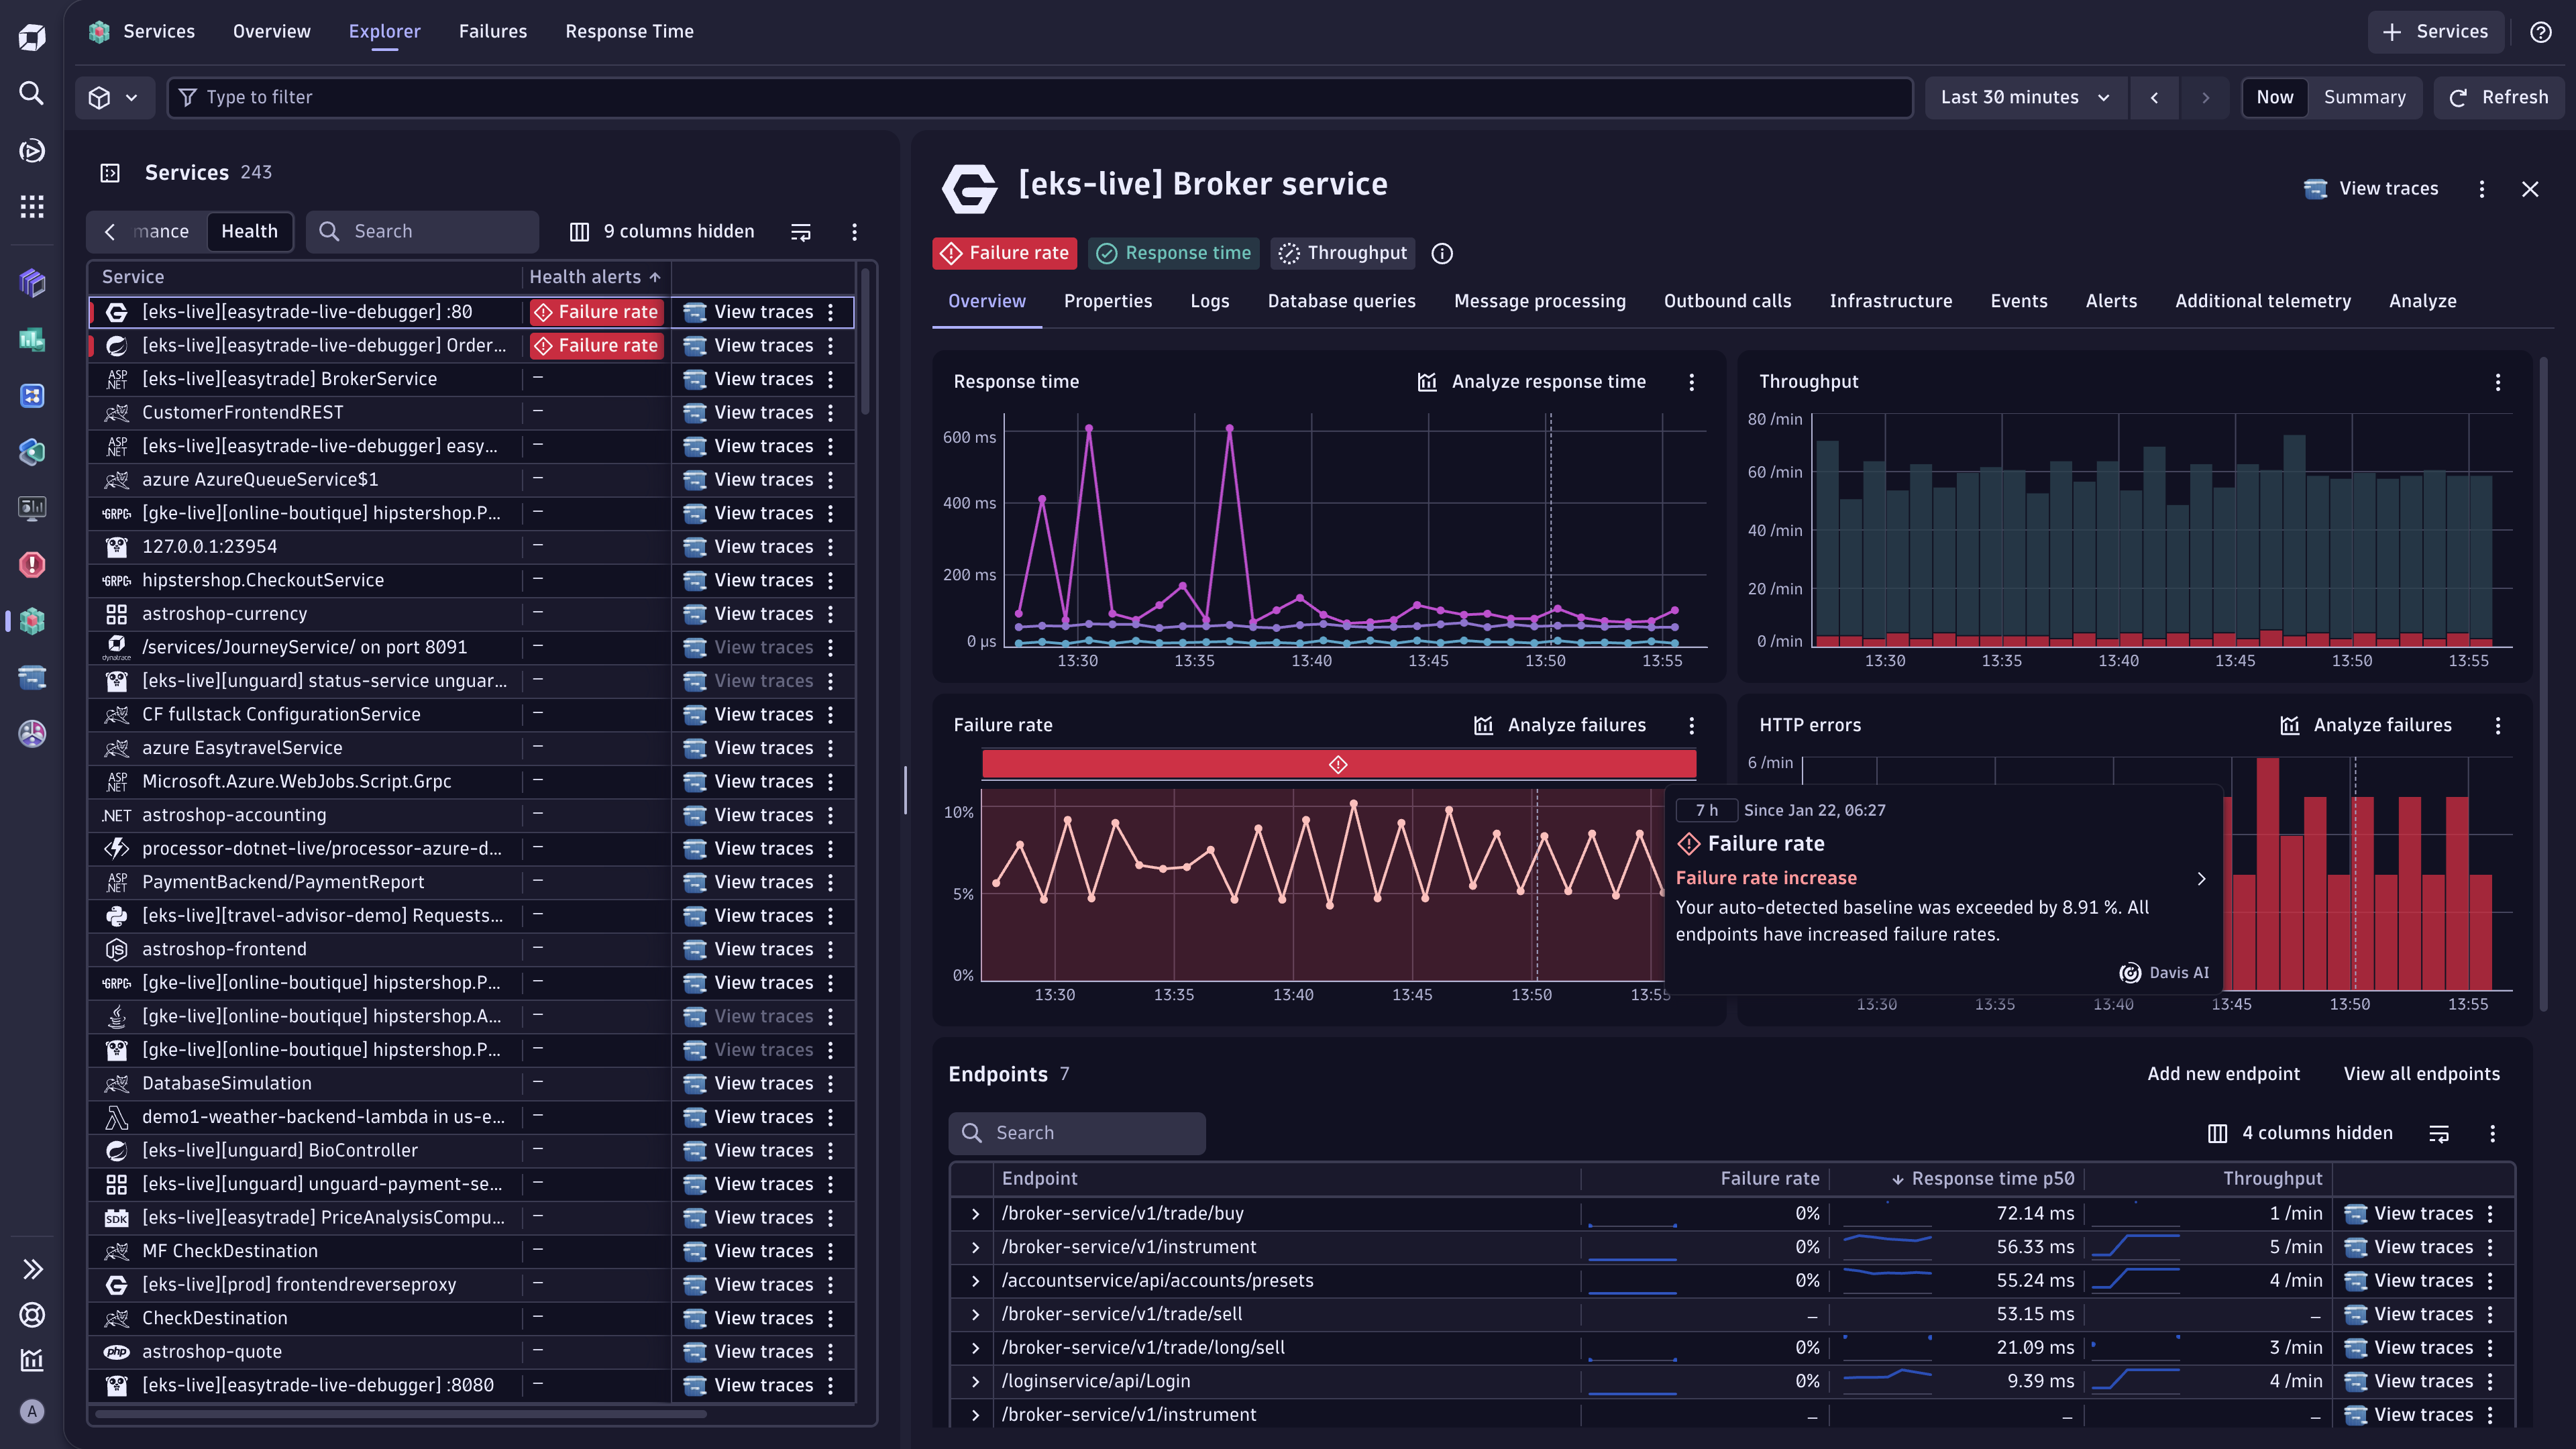
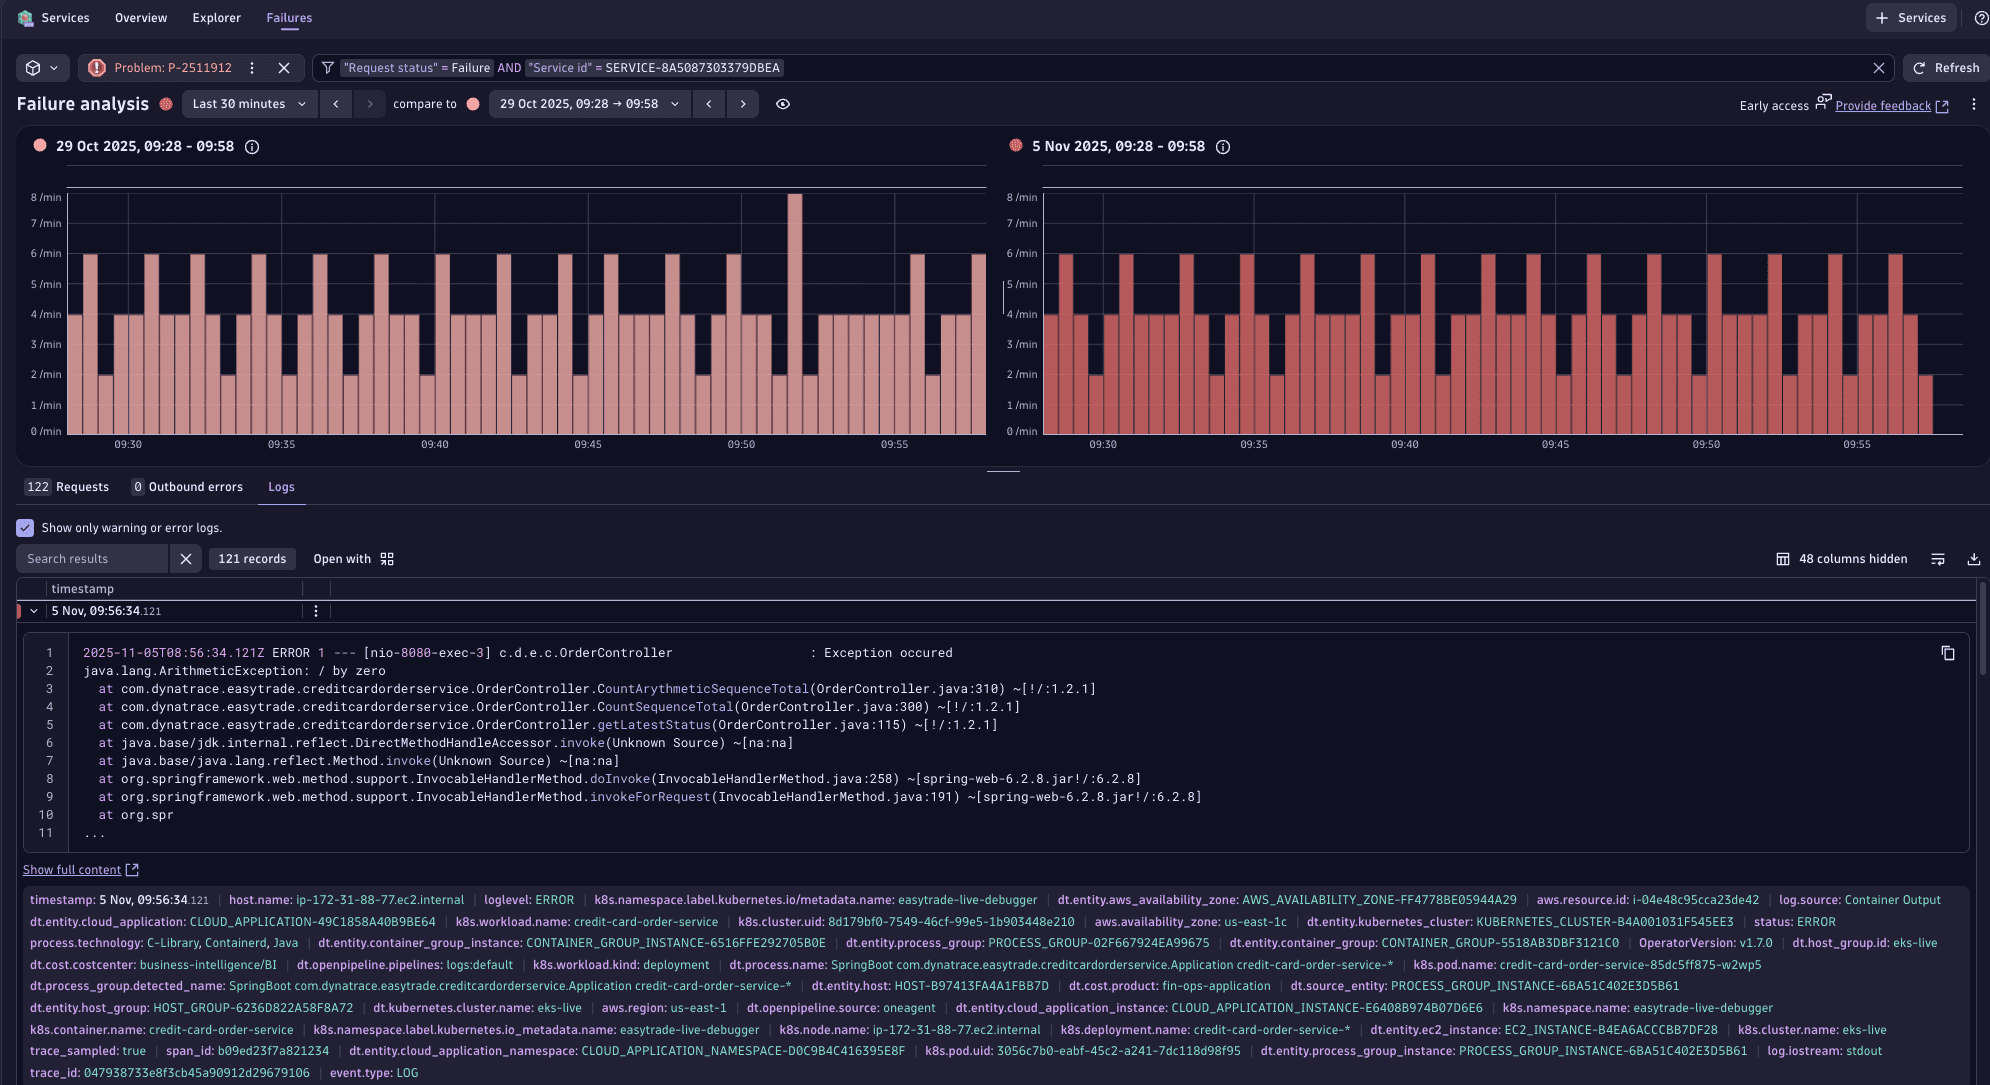
Services provides detailed insights into the performance and health of your services. Use it to perform failure analysis, response times, query performance, and message processing. You can also utilize this app to filter by key attributes, for example, Kubernetes namespaces or HTTP endpoints, and examine relationships to Kubernetes, host, and cloud infrastructure. Moreover, you can view logs emitted by your services and jump directly to  Distributed Tracing for deeper analysis of specific transactions.
For more information, see Services app.
Add services to Dynatrace
Add services to Dynatrace using OneAgent or OpenTelemetry integration.
Both options capture metrics, traces, and logs and include support for Serverless functions.
Choose one of the following options to learn more:
Cloud Workload
AWS
- AWS Lambda AWS Fargate Amazon EC2 Amazon ECS Amazon EKS AWS App Runner AWS Elastic Beanstalk All AWS cloud services
Microsoft Azure
- Azure Monitor metrics Azure Logs Azure Kubernetes Service (AKS) Azure App Service Azure Functions Azure Virtual Machines (VM) Azure Virtual Machine Scale Set (VMSS) Azure Service Fabric Azure Spring Apps All Azure cloud services
Google Cloud
")


Kubernetes
Host-based
OpenTelemetry
Other setup options
Service flow
Find out how Dynatrace can help you trace the sequence of service calls that are triggered by each service request in your environment.
- How-to guide
Service backtrace
Trace the sequence of service calls all the way back up to the browser click that triggered the sequence of calls.
- How-to guide