Pin tiles to your dashboard
- How-to guide
- 5-min read
The dashboards discussed here are classic dashboards created using the dashboarding functionality integrated with previous Dynatrace.
- For more about classic dashboards, see Dashboards Classic.
- For more about dashboards created with the Dashboards app in the latest Dynatrace, see Dashboards.
- To improve your dashboard experience, you can upgrade existing dashboards from Dashboards Classic to the Dashboards app in the latest Dynatrace.
You can automatically create a new dashboard tile from any Dynatrace page that includes a Pin to dashboard button. All you need is edit permission for the dashboard. In this example, we create a new dashboard, so you are guaranteed to have edit permission.
Create a dashboard
We start by creating an empty dashboard.
- Go to
 Dashboards Classic.
 - Select Create dashboard, enter a Dashboard name (in this example, use
Filtered Dashboard), and select Create.
This creates the dashboard and opens it in edit mode. - Select Done.
Now we have an empty dashboard namedFiltered Dashboard.
Create a filtered tile
Now we create a tile based on a filtered view of the Hosts page and pin the tile to the empty dashboard.
-
Go to
 Hosts Classic.
 -
Set a filter on the list. In this example, we set
Data center: Gdańsk, Poland.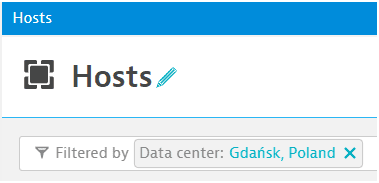
How to set a filter
-
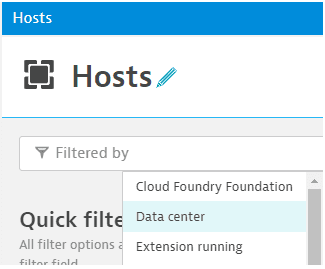
On the Filtered by line, start typing to select a filter
-
Select or type a value
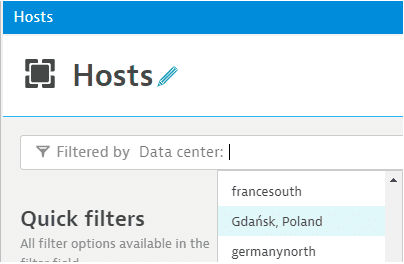
For more common filters, you can select a filter directly from the Quick filters column of the Hosts page.
-
-
Select Pin to dashboard.
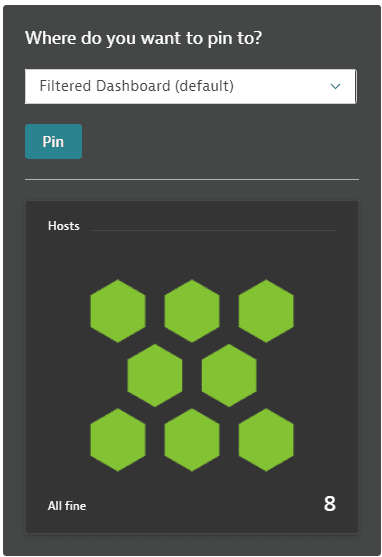
Dynatrace displays a preview of the tile and asks you to select the dashboard to which you want to pin it. The list of dashboards is searchable: select in the list and start typing to filter the list, and then select the dashboard from the filtered list.
-
Select a dashboard (in this example,
Filtered Dashboard) and select Pin. This creates the tile and pins it to that dashboard.
-
Select Open dashboard.
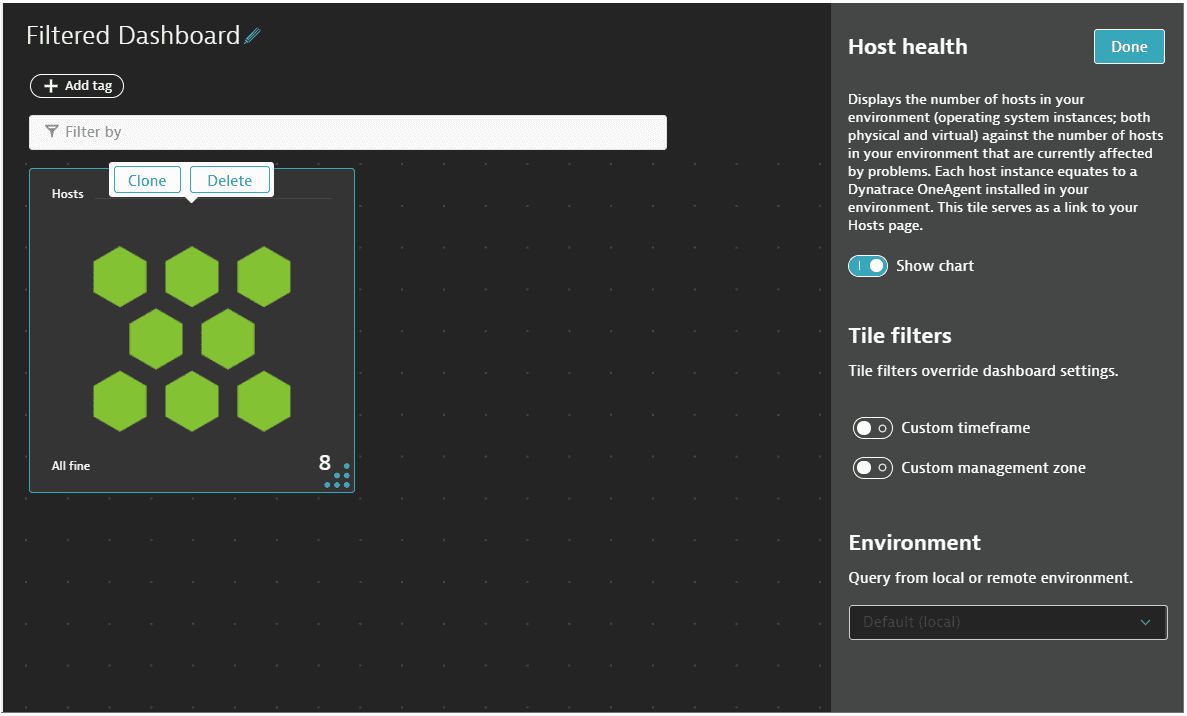
The formerly empty dashboard now opens in edit mode with the new tile selected for editing. You can make optional settings to this tile before saving it. For a Host health tile, you have the following options:- Optional Select whether to show a visualization on the tile
- Optional Select a custom timeframe
- Optional Select a custom management zone
- Optional Select an environment
-
Select Done.
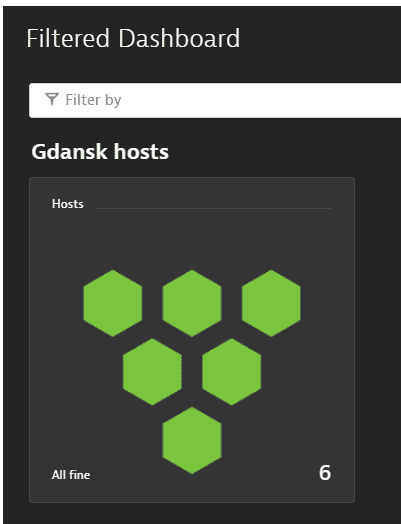
The dashboard is displayed with the new tile representing hosts in Gdańsk, Poland.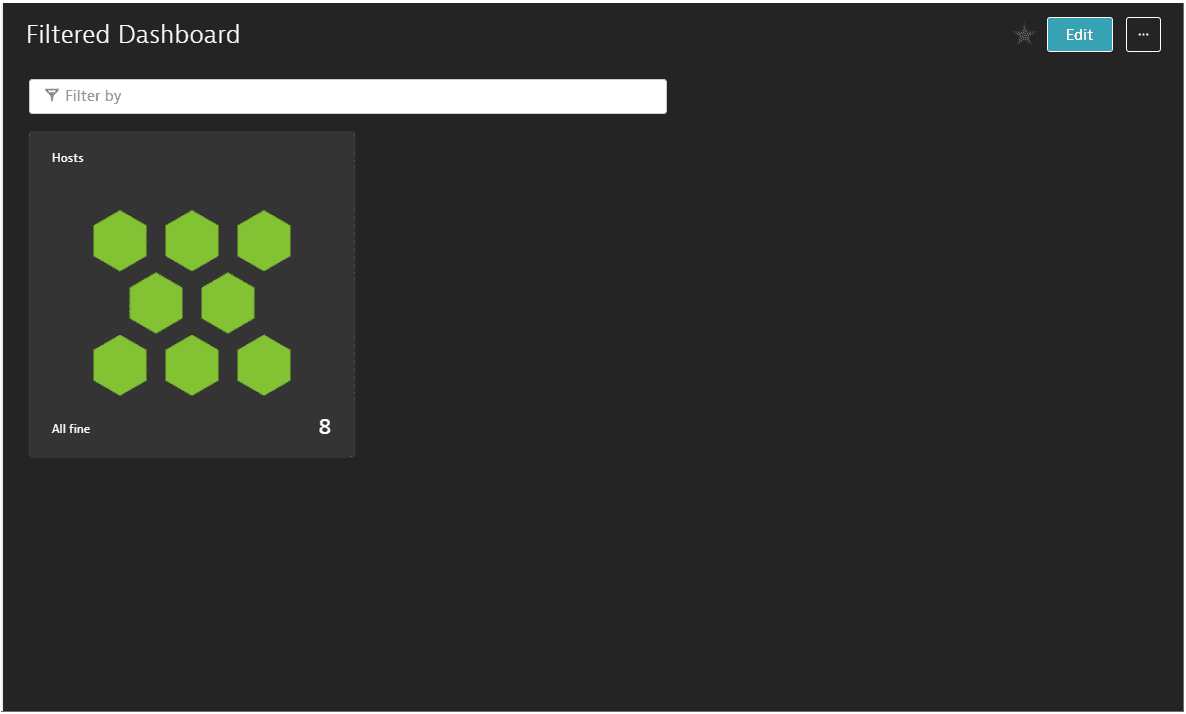
Now we have a tile that's specific to the hosts in the Gdańsk, Poland, data center.
- The filter is fully dynamic. If hosts are added or removed, or if their statuses change, the tile updates automatically.
- To view the filtered Hosts page from which we created the tile, open the menu in the tile's upper-right corner and select View details.
Add a header to your tile
Optional
To add a meaningful label to your tile
-
Select Edit to edit your dashboard.
-
Drag a Header tile from the Edit dashboard pane to your dashboard.
This will be the title of your tile. -
Edit the header text. In this example, we use Gdansk hosts.
-
Drag your Header tile into position above your Hosts tile.
Depending on the position of your Hosts tile on the dashboard, you may need to drag both tiles to new positions so you can fit the Header tile over the Hosts tile.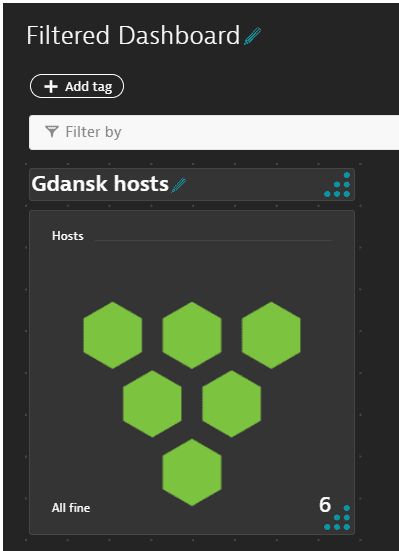
-
Select Done.
Update a filtered tile
To change the filters on your tile
-
On your dashboard, select the tile to display the Hosts table with your filter applied.
-
Add or delete filters.
In this example, we keep
Data center: Gdańsk, Polandand addOperating system: Linux. Because we have changed the filters, the Update dashboard tile button is enabled so you can save changes.
-
Select Update dashboard tile.
The new filter settings are saved to the tile. In this example, the tile on your dashboard displays the health of hosts matchingData center: Gdańsk, PolandandOperating system: Linux, and it opens the Hosts page with those filters. -
To return to the dashboard, select the dashboard button in the upper-left corner of Dynatrace.

Pin as new tile
Instead of updating a tile, you might want to save a new copy of the tile. For example, you might want multiple similar tiles but with each tile filtered for a different operating system.
- On the same example dashboard, open the tile menu (in the upper-right of the tile) and select View details.
The Hosts page opens with the same filters set. - Select More (…) > Pin as new tile.
- Select a different dashboard to have copies of the same tile on two different dashboards.
- Select the same dashboard to have two copies of the tile on the same dashboard, which might seem pointless. However:
- You can edit each copy of the tile to have a different management zone, timerange, and environment
- You can set different filters on each copy of the tile
Clone tiles
Tile cloning can save you a lot of work. For example, suppose you want your dashboard to display three visualizations that are identical except that they each query a different host. The easiest solution is to create the first visualization, experiment with the visualization settings until it's perfect, and then clone it twice. After that, you just need to edit the clones to query the other two hosts.
Clone a tile to the current dashboard
To pin the cloned tiles to the same dashboard
- Go to
 Dashboards Classic.
 - Select the name of a dashboard to display that dashboard.
- Select Edit in the upper-right corner of the dashboard. The dashboard opens in edit mode.
- If you don't see an Edit option, you don't have permission to edit that dashboard.
- Select the tile that you want to clone (add a copy of the tile to the current dashboard) and then select Clone.
- To clone multiple tiles to the current dashboard, drag a selection rectangle around the x tiles you want to clone and then select Clone x tiles.
- Edit the cloned tiles as needed.
Clone a tile to another dashboard
To pin the cloned tiles to another existing dashboard, or to create another dashboard and pin the clones to it
- Go to
 Dashboards Classic.
 - Select the name of a dashboard to display that dashboard.
- Select Edit in the upper-right corner of the dashboard. The dashboard opens in edit mode.
- If you don't see an Edit option, you don't have permission to edit that dashboard.
- Select the tile you want to clone to another dashboard and then select Clone to.
- To clone multiple tiles to another dashboard, drag a selection rectangle around the x tiles you want to clone and then select Clone x to.
- In the Where do you want to pin to? pop-up window, select an existing dashboard or Create new dashboard.
- Select Pin to add the selected tiles to the dashboard.
- Edit the cloned tiles as needed.