Custom topology model
- Latest Dynatrace
- 4-min read
The Dynatrace software platform and Dynatrace Intelligence depend on context-rich, high-quality data that is provided by OneAgent, cloud integrations, or technology monitoring extensions.
Context-rich observability
Context-rich observability means that each incoming observation (metric, trace, log, or event) is stored with a reference to the monitored entity that it belongs to. Simple examples here are a CPU metric measurement that was observed on a given host, or a response time that was observed on a given service trace.
Built-in topology model
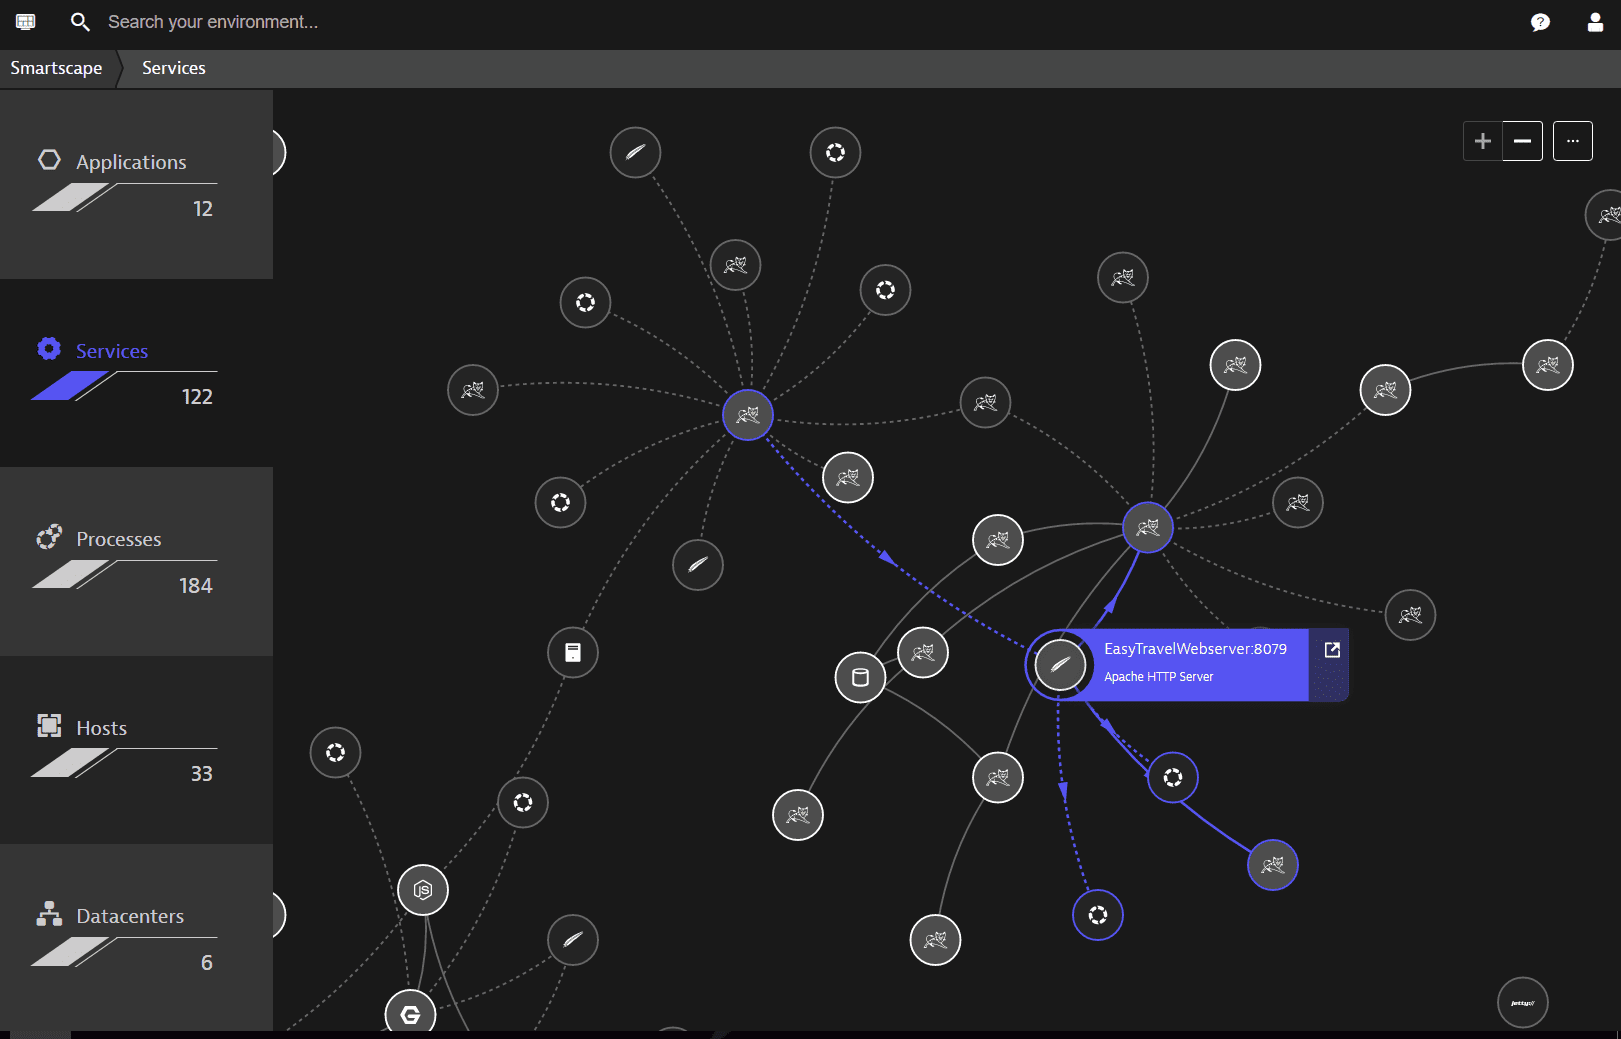
Using all these observations and the related entities, Dynatrace can extract and visualize the huge topological graph that we call Smartscape.
Each OneAgent that is deployed within your IT landscape sends in its own observations. Dynatrace then extracts and auto-discovers all context-relevant topology information. As a result, your Smartscape topology visualization grows in size and detail.
Smartscape, the Dynatrace built-in topological model, is entirely focused on entity types that are relevant for IT operations management, such as hosts, compute nodes, processes, web services, and more.
Topology examples
You can find examples of topological models all over Dynatrace, for example, the service deployment stack shown in Smartscape.
Smartscape example

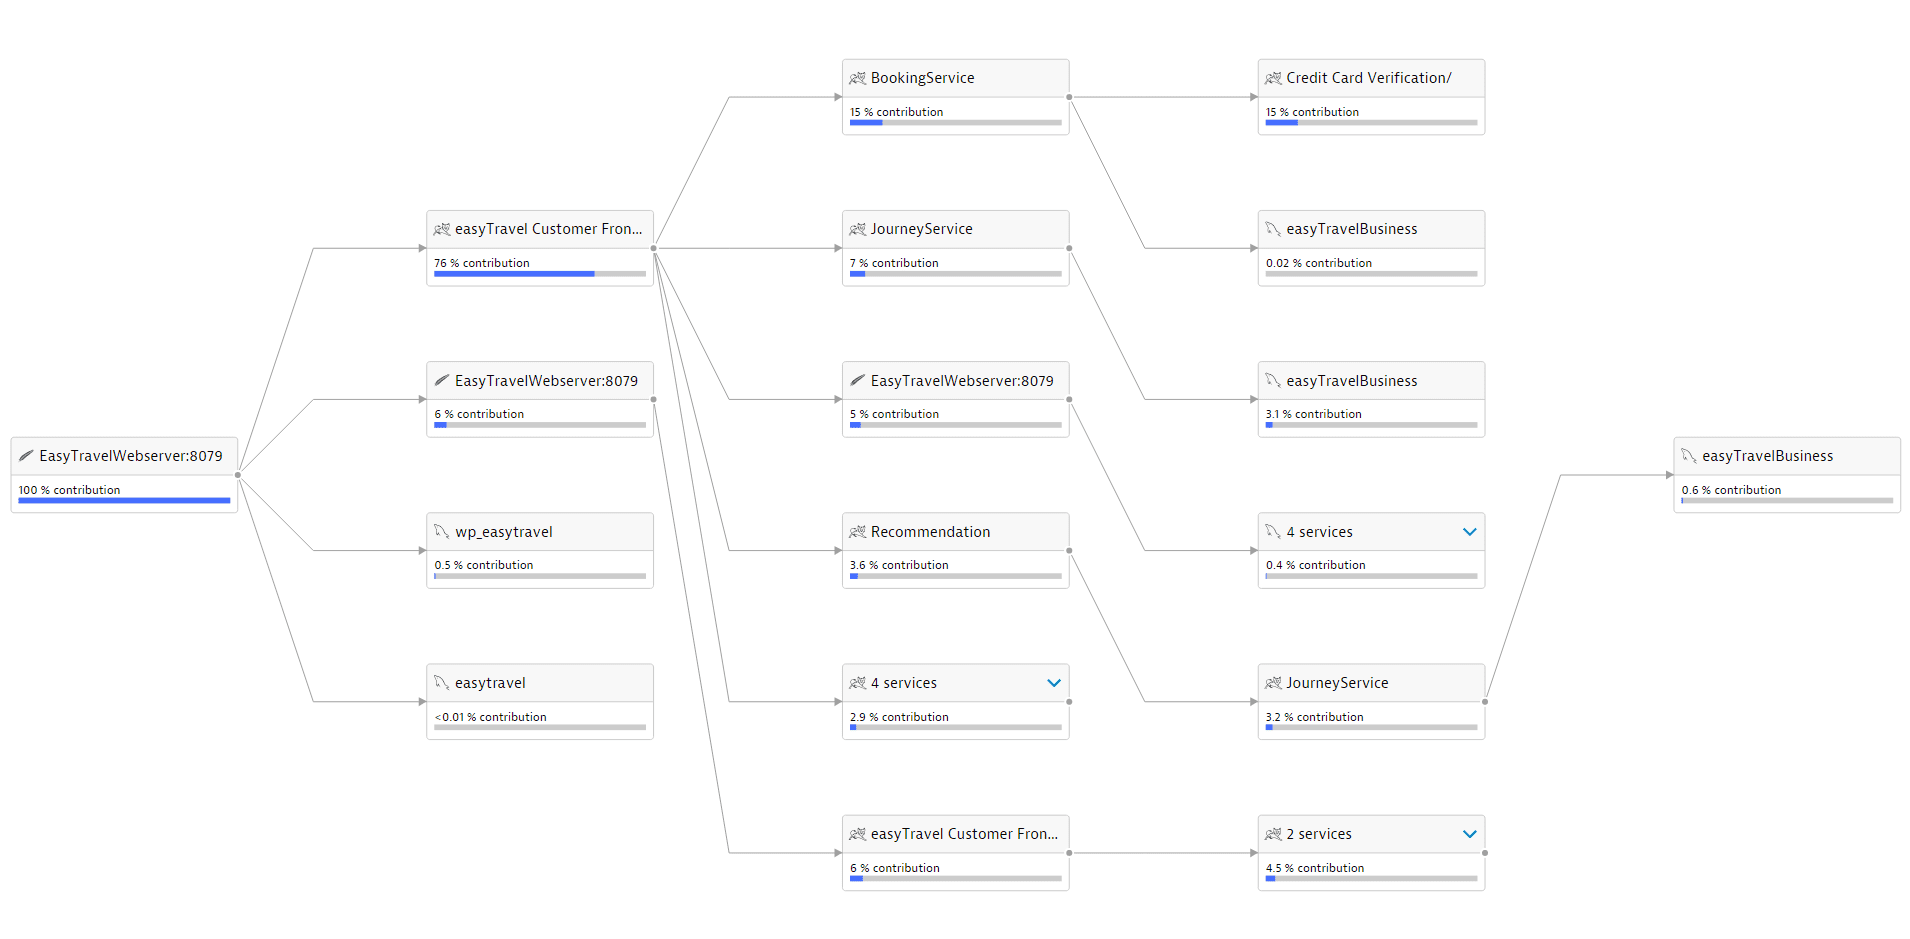
Another topological view is shown within Service flow, which shows the real-time call relationships of services extracted from all incoming transactions and traces.
Service flow example

The built-in topology model automatically detects more than a hundred entity types and their relationships, but is limited to well-known IT and software related types.
Custom topology model
Once you start to send in your own data sources—such as Telegraf metric streams, StatsD application measurements, or your own business metrics—through the metric ingest channel, you might be interested in extending the built-in model by adding your own domain-related types and relationships.
The extensibility of the topological model is especially interesting for IoT use cases, where you want to model your own device types (such as cars, ships, or vending machines) and connect them via well-defined relationships.
See the topology-related step in the WMI extension tutorial to learn more about extending the Dynatrace topology.
Custom topology model in action
Let's look at a simple example from the logistics domain that we want to model within Dynatrace.
Suppose we have a company, Easy Shipping LTD, that provides transport services. Easy Shipping LTD operates smart containers mounted on trucks that carry the containers from loading dock to loading dock.
- Each truck continuously sends basic telemetry data, such as fuel consumption, operation hours, and error logs.
- Each smart container is able to report the truck number to which it's currently mounted and its container temperature.
With the above example, the company can ingest a continuous stream of observations in the form of truck and container telemetry.
Truck telemetry data
Easy Shipping LTD trucks send a continuous data stream on fuel (truck.fuel.total and truck.fuel.usage) and operation hours (operation.hours). Each measurement is sent in the context of the individual truck (trucknr) and its model (model). For example:
truck.fuel.total,trucknr=99,model=mac-granite 10234truck.fuel.usage,trucknr=99,model=mac-granite 17truck.operation.hours,trucknr=99,model=mac-granite 23766truck.fuel.total,trucknr=12,model=mac-anthem 234truck.fuel.usage,trucknr=12,model=mac-anthem 10truck.operation.hours,trucknr=12,model=mac-anthem 13766
Container telemetry data
Smart containers carried by the company trucks send a continuous data stream on the currently measured temperature (container.temperature). Each measurement is sent in the context of the individual container (containernr) and the truck it is carried on (trucknr):
container.temperature,containernr=234321,trucknr=99 40container.temperature.dev,containernr=234321,trucknr=99 0
container.temperature,containernr=111111,trucknr=12 39container.temperature.dev,containernr=111111,trucknr=12 2,5
and so on.
Instances of the types truck and container and their relationship can be extracted automatically from the continuous data stream.
Benefits of custom topology
The benefit of having a domain model on top of your telemetry data is:
- Dynatrace-wide monitoring
Domain-specific terminology is used for your entity types and their relationships within all parts of the monitoring platform, such as charting, dashboard, and alerting. - Information in context
Analytics can be performed on top of the given domain model, such as to check on which truck a container was mounted over time. Slicing and dicing of telemetry data as well as on logs and events is offered on top of your own domain model. - Single pane view
Observed telemetry data no longer represents an isolated view but begins to shape a complete picture of your own domain topology.
See Define custom topology to learn how to create a custom topology suited to your telemetry data.