Generic network topology
- Latest Dynatrace
- How-to guide
- 10-min read
- Published Jan 29, 2025
The SNMP Autodiscovery extension scans through subnets and helps users discover their full inventory of SNMP-enabled network devices. In addition, this extension also includes a topology model that aims to be generic enough that most sources for data relating to network devices can be expressed through a simple set of common entities: network device, network port, and network interface.
We've started applying this model to some of our most popular SNMP extensions for technologies like Cisco, F5, Palo Alto, and Juniper. This has allowed us to unify all network entities, simplify our queries, and show relevant network data regardless of the monitoring source.
To see how the  Infrastructure & Operations app visualizes this data, see Supercharge your end-to-end infrastructure and operations observability experience (Dynatrace blog).
Scenario
This guide walks you through the concepts that tie this topology together, and explain how you—as an extension developer or data integrator—can leverage the same model.
As this is a technical guide, we will take a complete example based on a trimmed-down version of the F5 BIG-IP extension.
Three extension manifests are attached to this guide:
-
1_initial.yamlis the unmodified extension.It monitors an F5 load balancer, sending data to Dynatrace, but without any awareness of the model.
-
2_basic.yamlshowcases basic usage.Dynatrace now knows that the F5 load balancer is a network device with interfaces and ports. Other apps will show it too.
-
3_advanced.yamlshowcases advanced usage.The network device and interface now have access to more data. The network device has also been given additional attributes and charts to display.
See the Manifest files section below to learn more about these files.
You can use an online tool like diffchecker to better focus on the changes between the three manifests.
 Key concepts
It's important to understand that the topology model is defined largely by the SNMP Autodiscovery extension. Other extensions and integrations only need to ensure the right data is sent to Dynatrace and optionally define any additional charts to display as part of the web UI.
Let's have a look at the topology entities and relationships.
Network device
(network:device)
- A network device is like a physical device on the network. This is the core entity that hosts the OS and runs the technology required to deliver network communications and other capabilities.
- A network device is identified by its management IP address and labeled by the system name.
Network port
(network:port)
- A network port is like a physical hardware network port on a network device.
- A network port is identified and labeled by its MAC address.
Network interface
(network:interface)
- A network interface is like a physical or virtual network interface (NIC). This is typically the first point of reference in device-to-device network communications.
- A network interface is identified by a combination of MAC address and interface name, and labeled by its name.
Relationships
These entity types are tied together by the following relationships:
-
network:port-runsOn->network:device -
network:interface-runsOn->network:device -
network:interface-isChildOf->network:port
 Basic usage
As mentioned earlier, other extensions and integrations only need to send the data in the correct format to leverage this topology. Mandatory dimensions must be present on all metrics, whereas optional dimensions can be added to a single metric to reduce unnecessary data splitting.
Dimensions and metrics for network devices
The following metrics and dimensions are available for network devices.
-
Mandatory dimensions:
-
Key:
device.addressUsage: identifies each device and decides when new entity instances should be created
-
Key:
monitoring.modeUsage: must have fixed value "Extension". This affects the UI and tell Dynatrace this entity is monitored.
-
Key:
sys.nameUsage: labels the device, giving the entity its name.
-
Key:
device.typeUsage: a string to represent the type of device. Can be the name of a technology, make/model, or simply a label like "L3 Switch". Will populate the
devTypeattribute of the entity.
-
-
Optional (recommended) dimensions:
-
Key:
device.portUsage: registers a listening port on the device. No additional entities are created, but the
dt.listen\portsattribute will be populated from it. -
Key:
sys.descriptionUsage: registers the device’s description against the devDescription attribute. Can be manufacturer information or any descriptive text.
-
-
Metrics:
-
Key:
com.dynatrace.extension.network_device.sysuptimeDescription: The time, in system ticks (1/100 second), since the last system reboot.
-
Key:
com.dynatrace.extension.network_device.cpu_usageDescription: The system's CPU usage expressed as a percentage
-
Key:
com.dynatrace.extension.network_device.cpu_ratioDescription: The system's CPU usage expressed as a ratio
-
Key:
com.dynatrace.extension.network_device.memory_usedDescription: The amount of memory, in kilobytes, used by the device
-
Key:
com.dynatrace.extension.network_device.memory_freeDescription: The amount of memory, in kilobytes, currently free on the device
-
Key:
com.dynatrace.extension.network_device.memory_totalDescription: The total (used and free) amount of memory, in kilobytes, available on the device
-
Key:
com.dynatrace.extension.network_device.memory_usageDescription: The current memory used by the device, expressed as a percentage of total memory
-
Dimensions and metrics for network interfaces
The following are metrics and dimensions available for network interfaces.
-
Mandatory dimensions:
-
Key:
mac.addressUsage: in combination with the name, identifies each interface and when to create new entity instances. Separately, it also identifies network ports and when to create new instances.
-
Key:
if.nameUsage: in combination with the MAC address, identifies each interface. It also gives each interface entity a name.
-
-
Metrics:
-
Key:
com.dynatrace.extension.network_device.if.statusDescription: A state metric representing a network interface, whose value is always 1 and its dimensions indicate its state details.
Additional dimensions (extracted as entity attributes):
-
Key:
oper.statusUsage: The operational state of the interface (up/down/etc.).
-
Key:
admin.statusUsage: The admin state of the interface (up/down/etc.).
-
Key:
if.speedUsage: The speed/bandwidth of the interface.
-
Key:
com.dynatrace.extension.network_device.if.bytes_in.countDescription: The volume of traffic, in bytes, inboud to the network interface.
-
Key:
com.dynatrace.extension.network_device.if.bytes_out.countDescription: The volume of traffic, in bytes, outbound from the network interface.
-
What can be expected at this stage?
This should guarantee that network device, network port, and network interface entities are created correctly from your data. At this point, you can leverage either the (Classic) Technologies or Infrastructure & Operations app to visualize these devices.
-
In the (Classic) Technologies app, navigate to
../ui/apps/dynatrace.classic.technologies/ui/entity/list/network:interface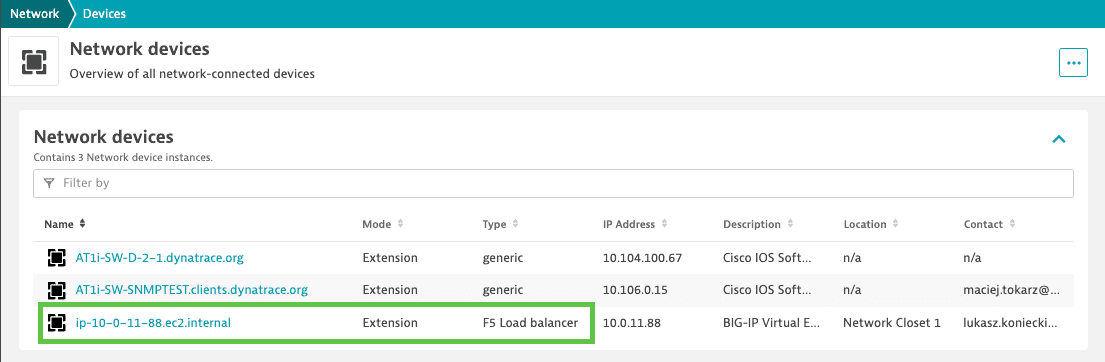 Network devices
 -
In the
Infrastructure & Operations app, select the Network Devices tab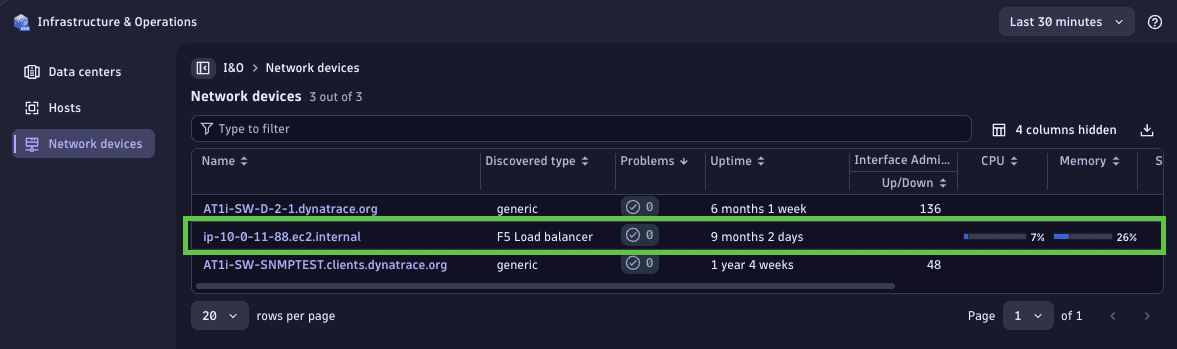 Network devices
 Advanced usage
Building on top of the previous changes, this section focuses on how to extend the network model with additional metrics, relationships to existing entities, and UI customizations.
In many cases, you probably already have an extension or integration that sends specialized data about a particular type of network device. In these situations, the model can be used to draw some “same as” relationships from your existing entities to the generic ones, effectively attaching new metrics to them, customizing their attributes, and injecting some of your existing charts into their UI.
Once you implemented the proposed changes, follow these additional steps:
-
Attach your existing data to the network device:
-
Create a new entry in
topology.typesas follows:- name: network:deviceenabled: truedisplayName: Network devicerules: [] # You will populate this at the next step -
Add rules to attach your data to the entity (replace
[])Note: You can identify an existing entity type that resembles a network device and copy all the rules from its definition
Ensure that every rule defines the following:
- idPattern: network_device_{device.address}instanceNamePattern: "{sys.name}"role: defaultNote:
device.addressandsys.nameare placeholders that can hold any other dimension, but they must identify a management IP address and a device name.
-
-
Attach your existing data to the network interface:
-
Create a new entry in
topology.typesas follows:- name: network:interfaceenabled: truedisplayName: Network interfacerules: [] # You will populate this in the next step -
Add rules to attach your data to the entity (replace the above
[]).Note: You can identify an existing type that resembles a network interface and copy all the rules from its definition.
Ensure that every rule defines the following:
- idPattern: network_interface_{mac.address}_{if.name}instanceNamePattern: "{if.name}"role: defaultNote:
mac.addressandif.nameare placeholders that can hold any other dimension, but they must identify a MAC address and an interface name.
-
-
Draw the "same as" relationships:
-
Create two entries in
topology.relationships. Each should be based on data similar to what you used in the previous steps.- fromType: "" # Add your existing entity type that resembles a network devicetypeOfRelation: SAME_AStoType: `network:device`sources:- sourceType: Metricscondition: "" # Match any of the metrics that you used for the network:device entity rule- fromType: "" # Add your existing entity type that resembles a network interfacetypeOfRelation: SAME_AStoType: `network:interface`sources:- sourceType: Metricscondition: "" # Match any of the metrics that you used for the network:interface entity rule
-
-
Customize the UI:
-
Create a new entry in
screensfor the network device:screens:- entityType: network:device -
Display a drilldown link to the specialized entity:
Add a
RELATIONtype property to thepropertiesCardpointing to your existing entitypropertiesCard:properties:- type: RELATIONrelation:# replace your_type with your existing entity typeentitySelectorTemplate: type(your_type),fromRelationships.isSameAs($(entityConditions))displayName: Linked entityconditions:# Replace your_type with your existing entity type- relatedEntity|entitySelectorTemplate=type(your_type),fromRelationships.isSameAs($(entityConditions))# Ensures it only appears on monitored devices- entityAttribute|devMonitoringMode=Extension -
Display your existing charts on the Network Device screen:
The easiest way is to inject them by reference from your existing entity's screen.
Note: Never define anything in
detailsSettings, always indetailsInjections.detailsInjections:- type: CHART_GROUPkey: my-custom-chart# replace your_type with your existing entity typeentitySelectorTemplate: type(your_type),fromRelationships.isSameAs($(entityConditions))conditions:# Replace your_type with your existing entity type- relatedEntity|entitySelectorTemplate=type(your_type),fromRelationships.isSameAs($(entityConditions))# Ensures it only appears on monitored devices- entityAttribute|devMonitoringMode=Extension -
Define new charts for the network device:
detailsInjections:- type: CHART_GROUPkey: my-custom-chartconditions:# Ensures it only appears on monitored devices- entityAttribute|devMonitoringMode=ExtensionchartsCards:- key: my-custom-charttype: CHART_GROUP# Rest of definition goes here...
-
What can be expected at this stage?
The network device entity is associated with an extended set of metrics (coming from the specialized extension), reports additional attributes, displays some of the specialized extension's data on its details page, and retains a drilldown link to the specialized entity.
Manifest files
1_initial.yaml
This is the unmodified extension.
It monitors an F5 load balancer, sending data to Dynatrace, but without any awareness of the model.
Show me the 1_initial.yaml manifest file
name: custom:f5-load-balancerversion: 1.0.0minDynatraceVersion: 1.289.0author:name: Dynatracesnmp:- group: f5interval:minutes: 1dimensions:- key: instance.namevalue: oid:1.3.6.1.2.1.1.5.0- key: failover.statevalue: oid:1.3.6.1.4.1.3375.2.1.14.3.1.0- key: sync.statevalue: oid:1.3.6.1.4.1.3375.2.1.14.1.1.0subgroups:- subgroup: f5-instance-detailstable: falsedimensions:- key: instance.systemnamevalue: oid:1.3.6.1.4.1.3375.2.1.6.1.0- key: instance.systemreleasevalue: oid:1.3.6.1.4.1.3375.2.1.6.3.0- key: instance.systemarchvalue: oid:1.3.6.1.4.1.3375.2.1.6.5.0- key: instance.productversionvalue: oid:1.3.6.1.4.1.3375.2.1.4.2.0metrics:- key: f5.lb.sys.uptimevalue: oid:1.3.6.1.4.1.3375.2.1.6.6.0- subgroup: f5-interface-detailsfeatureSet: interfacetable: truedimensions:- key: interface.namevalue: oid:1.3.6.1.4.1.3375.2.1.2.4.1.2.1.1- key: interface.enabledvalue: oid:1.3.6.1.4.1.3375.2.1.2.4.1.2.1.8- key: interface.statusvalue: oid:1.3.6.1.4.1.3375.2.1.2.4.1.2.1.17- key: mac.addressvalue: $networkFormat(const:macAddress, oid:1.3.6.1.4.1.3375.2.1.2.4.1.2.1.6)metrics:- key: f5.lb.sys.interface.statusvalue: const:1- subgroup: f5-interface-metricsfeatureSet: interfacetable: truedimensions:- key: interface.namevalue: oid:1.3.6.1.4.1.3375.2.1.2.4.4.3.1.1metrics:- key: f5.lb.sys.interface.stat.bytes.in.countvalue: oid:1.3.6.1.4.1.3375.2.1.2.4.4.3.1.3type: count- key: f5.lb.sys.interface.stat.bytes.out.countvalue: oid:1.3.6.1.4.1.3375.2.1.2.4.4.3.1.5type: count- key: f5.lb.sys.interface.stat.pkts.in.countvalue: oid:1.3.6.1.4.1.3375.2.1.2.4.4.3.1.2type: count- key: f5.lb.sys.interface.stat.pkts.out.countvalue: oid:1.3.6.1.4.1.3375.2.1.2.4.4.3.1.4type: count- subgroup: f5-cputable: falsefeatureSet: instance-cpumetrics:- key: f5.lb.sys.global.host.cpu.idle1mvalue: oid:1.3.6.1.4.1.3375.2.1.1.2.20.25.0- key: f5.lb.sys.global.host.cpu.iowait1mvalue: oid:1.3.6.1.4.1.3375.2.1.1.2.20.28.0- key: f5.lb.sys.global.host.cpu.irq1mvalue: oid:1.3.6.1.4.1.3375.2.1.1.2.20.26.0- key: f5.lb.sys.global.host.cpu.softirq1minvalue: oid:1.3.6.1.4.1.3375.2.1.1.2.20.27.0- key: f5.lb.sys.global.host.cpu.stolen1mvalue: oid:1.3.6.1.4.1.3375.2.1.1.2.20.40.0- key: f5.lb.sys.global.host.cpu.system1mvalue: oid:1.3.6.1.4.1.3375.2.1.1.2.20.24.0- key: f5.lb.sys.global.host.cpu.user1mvalue: oid:1.3.6.1.4.1.3375.2.1.1.2.20.22.0- subgroup: f5-memorytable: falsefeatureSet: instance-memorymetrics:- key: f5.lb.sys.host.memory.totalvalue: oid:1.3.6.1.4.1.3375.2.1.7.1.1.0- key: f5.lb.sys.host.memory.usedvalue: oid:1.3.6.1.4.1.3375.2.1.7.1.2.0topology:types:- name: f5lb:instancedisplayName: F5 BIG-IP Instancerules:- idPattern: f5_instance_{instance.name}instanceNamePattern: '{instance.name}'iconPattern: f5sources:- sourceType: Metricscondition: $eq(f5.lb.sys.uptime)attributes:- key: dt.ip_addressesdisplayName: IP Addresspattern: '{device.address}'- key: dt.dns_namesdisplayName: DNS Namepattern: '{instance.name}'- key: OSReleasedisplayName: OS releasepattern: '{instance.systemrelease}'- key: OSArchitecturedisplayName: OS architecturepattern: '{instance.systemarch}'- key: OSNamedisplayName: OS namepattern: '{instance.systemname}'- key: ProductVersiondisplayName: Product versionpattern: '{instance.productversion}'- key: FailoverStatuspattern: '{failover.state}'displayName: Failover status- key: SyncStatuspattern: '{sync.state}'displayName: Config sync statusrole: default- idPattern: f5_instance_{instance.name}instanceNamePattern: '{instance.name}'iconPattern: f5sources:- sourceType: Metricscondition: $prefix(f5.lb)requiredDimensions: []attributes: []role: default- name: f5lb:interfacedisplayName: F5 BIG-IP Interfacerules:- idPattern: f5_interface_{instance.name}_{interface.name}instanceNamePattern: '{interface.name}'iconPattern: network-interfacessources:- sourceType: Metricscondition: $eq(f5.lb.sys.interface.status)attributes:- key: EnabledStatedisplayName: Enabled Statepattern: '{interface.enabled}'- key: MacAddressdisplayName: MAC Addresspattern: '{mac.address}'- key: StatusdisplayName: Statuspattern: '{interface.status}'role: default- idPattern: f5_interface_{instance.name}_{interface.name}instanceNamePattern: '{interface.name}'iconPattern: network-interfacessources:- sourceType: Metricscondition: $prefix(f5.lb.sys.interface)requiredDimensions: []attributes: []role: defaultrelationships:- fromType: f5lb:interfacetypeOfRelation: RUNS_ONtoType: f5lb:instancesources:- sourceType: Metricscondition: $prefix(f5.lb.sys.interface)screens:- entityType: f5lb:instancedetailsSettings:staticContent:showProblems: trueshowProperties: trueshowTags: trueshowGlobalFilter: trueshowAddTag: truetarget: BOTHlayout:autoGenerate: falsecards:- key: f5_instance-charts-cputype: CHART_GROUP- key: f5_instance-charts-memorytype: CHART_GROUPchartsCards:- key: f5_instance-charts-cputarget: BOTHmode: NORMALdisplayName: CPUnumberOfVisibleCharts: 4chartsInRow: 4charts:- displayName: CPU BreakdownvisualizationType: GRAPH_CHARTgraphChartConfig:connectGaps: truestacked: truemetrics:- metricSelector: f5.lb.sys.global.host.cpu.idle1m:splitBy("dt.entity.f5lb:instance")dqlQuery: timeseries idle1m=avg(f5.lb.sys.global.host.cpu.idle1m),by:{`dt.entity.f5lb:instance`},filter:{`dt.entity.f5lb:instance`==$(entityId)}visualization:displayName: Idle- metricSelector: f5.lb.sys.global.host.cpu.system1m:splitBy("dt.entity.f5lb:instance")dqlQuery: timeseries system1m=avg(f5.lb.sys.global.host.cpu.system1m),by:{`dt.entity.f5lb:instance`},filter:{`dt.entity.f5lb:instance`==$(entityId)}visualization:displayName: System- metricSelector: f5.lb.sys.global.host.cpu.user1m:splitBy("dt.entity.f5lb:instance")dqlQuery: timeseries user1m=avg(f5.lb.sys.global.host.cpu.user1m),by:{`dt.entity.f5lb:instance`},filter:{`dt.entity.f5lb:instance`==$(entityId)}visualization:displayName: Uservisualization:themeColor: DEFAULTseriesType: AREA- displayName: System CPUvisualizationType: GRAPH_CHARTgraphChartConfig:connectGaps: truemetrics:- metricSelector: f5.lb.sys.global.host.cpu.system1m:splitBy("dt.entity.f5lb:instance")dqlQuery: timeseries system1m=avg(f5.lb.sys.global.host.cpu.system1m),by:{`dt.entity.f5lb:instance`},filter:{`dt.entity.f5lb:instance`==$(entityId)}visualization:themeColor: BLUEseriesType: LINE- displayName: User CPUvisualizationType: GRAPH_CHARTgraphChartConfig:connectGaps: truemetrics:- metricSelector: f5.lb.sys.global.host.cpu.user1m:splitBy("dt.entity.f5lb:instance")dqlQuery: timeseries user1m=avg(f5.lb.sys.global.host.cpu.user1m),by:{`dt.entity.f5lb:instance`},filter:{`dt.entity.f5lb:instance`==$(entityId)}visualization:themeColor: BLUEseriesType: LINE- displayName: Idle CPUvisualizationType: GRAPH_CHARTgraphChartConfig:connectGaps: truemetrics:- metricSelector: f5.lb.sys.global.host.cpu.idle1m:splitBy("dt.entity.f5lb:instance")dqlQuery: timeseries idle1m=avg(f5.lb.sys.global.host.cpu.idle1m),by:{`dt.entity.f5lb:instance`},filter:{`dt.entity.f5lb:instance`==$(entityId)}visualization:themeColor: BLUEseriesType: LINE- key: f5_instance-charts-memorytarget: BOTHmode: NORMALdisplayName: MemorynumberOfVisibleCharts: 4hideEmptyCharts: truecharts:- displayName: Memory breakdownvisualizationType: GRAPH_CHARTgraphChartConfig:connectGaps: trueyAxes:- key: y-absoluteposition: LEFTvisible: true- key: y-relativeposition: RIGHTvisible: truemin: '0'max: '100'metrics:- metricSelector: f5.lb.sys.host.memory.total:splitBy("dt.entity.f5lb:instance")dqlQuery: timeseries total=avg(f5.lb.sys.host.memory.total),by:{`dt.entity.f5lb:instance`},filter:{`dt.entity.f5lb:instance`==$(entityId)}yAxisKey: y-absolutevisualization:themeColor: BLUEseriesType: AREAdisplayName: Total- metricSelector: f5.lb.sys.host.memory.used:splitBy("dt.entity.f5lb:instance")dqlQuery: timeseries used=avg(f5.lb.sys.host.memory.used),by:{`dt.entity.f5lb:instance`},filter:{`dt.entity.f5lb:instance`==$(entityId)}yAxisKey: y-absolutevisualization:themeColor: ORANGEseriesType: AREAdisplayName: Used
2_basic.yaml
This showcases basic usage.
Dynatrace now knows that the F5 load balancer is a network device with interfaces and ports. Other apps will show it too.
Show me the 2_basic.yaml manifest file
name: custom:f5-load-balancerversion: 1.1.0minDynatraceVersion: 1.289.0author:name: Dynatrace# In this example, we add the basic metrics & dimensions for the network model.# We chose to spread them in-between the existing metrics where possible, but# they could just as well be extracted into separate groups & subgroups.snmp:- group: f5interval:minutes: 1dimensions:- key: instance.namevalue: oid:1.3.6.1.2.1.1.5.0- key: failover.statevalue: oid:1.3.6.1.4.1.3375.2.1.14.3.1.0- key: sync.statevalue: oid:1.3.6.1.4.1.3375.2.1.14.1.1.0# Adding the mandatory dimensions here ensures they appear everywhere- key: monitoring.modevalue: const:Extension- key: sys.namevalue: oid:1.3.6.1.2.1.1.5.0- key: device.typevalue: const:F5 Load balancersubgroups:- subgroup: f5-instance-detailstable: falsedimensions:- key: instance.systemnamevalue: oid:1.3.6.1.4.1.3375.2.1.6.1.0- key: instance.systemreleasevalue: oid:1.3.6.1.4.1.3375.2.1.6.3.0- key: instance.systemarchvalue: oid:1.3.6.1.4.1.3375.2.1.6.5.0- key: instance.productversionvalue: oid:1.3.6.1.4.1.3375.2.1.4.2.0metrics:- key: f5.lb.sys.uptimevalue: oid:1.3.6.1.4.1.3375.2.1.6.6.0- key: com.dynatrace.extension.network_device.sysuptimevalue: oid:1.3.6.1.4.1.3375.2.1.6.6.0- subgroup: f5-interface-detailsfeatureSet: interfacetable: truedimensions:- key: interface.namevalue: oid:1.3.6.1.4.1.3375.2.1.2.4.1.2.1.1- key: if.namevalue: oid:1.3.6.1.4.1.3375.2.1.2.4.1.2.1.1- key: interface.enabledvalue: oid:1.3.6.1.4.1.3375.2.1.2.4.1.2.1.8- key: interface.statusvalue: oid:1.3.6.1.4.1.3375.2.1.2.4.1.2.1.17- key: mac.addressvalue: $networkFormat(const:macAddress, oid:1.3.6.1.4.1.3375.2.1.2.4.1.2.1.6)metrics:- key: f5.lb.sys.interface.statusvalue: const:1- key: com.dynatrace.extension.network_device.if.statusvalue: const:1- subgroup: f5-interface-metricsfeatureSet: interfacetable: truedimensions:- key: interface.namevalue: oid:1.3.6.1.4.1.3375.2.1.2.4.4.3.1.1metrics:- key: f5.lb.sys.interface.stat.bytes.in.countvalue: oid:1.3.6.1.4.1.3375.2.1.2.4.4.3.1.3type: count- key: f5.lb.sys.interface.stat.bytes.out.countvalue: oid:1.3.6.1.4.1.3375.2.1.2.4.4.3.1.5type: count- key: com.dynatrace.extension.network_device.if.bytes_in.countvalue: oid:1.3.6.1.4.1.3375.2.1.2.4.4.3.1.3type: count- key: com.dynatrace.extension.network_device.if.bytes_out.countvalue: oid:1.3.6.1.4.1.3375.2.1.2.4.4.3.1.5type: count- key: f5.lb.sys.interface.stat.pkts.in.countvalue: oid:1.3.6.1.4.1.3375.2.1.2.4.4.3.1.2type: count- key: f5.lb.sys.interface.stat.pkts.out.countvalue: oid:1.3.6.1.4.1.3375.2.1.2.4.4.3.1.4type: count- subgroup: f5-cputable: falsefeatureSet: instance-cpumetrics:- key: com.dynatrace.extension.network_device.cpu_usagevalue: oid:1.3.6.1.4.1.3375.2.1.1.2.20.29.0- key: f5.lb.sys.global.host.cpu.idle1mvalue: oid:1.3.6.1.4.1.3375.2.1.1.2.20.25.0- key: f5.lb.sys.global.host.cpu.iowait1mvalue: oid:1.3.6.1.4.1.3375.2.1.1.2.20.28.0- key: f5.lb.sys.global.host.cpu.irq1mvalue: oid:1.3.6.1.4.1.3375.2.1.1.2.20.26.0- key: f5.lb.sys.global.host.cpu.softirq1minvalue: oid:1.3.6.1.4.1.3375.2.1.1.2.20.27.0- key: f5.lb.sys.global.host.cpu.stolen1mvalue: oid:1.3.6.1.4.1.3375.2.1.1.2.20.40.0- key: f5.lb.sys.global.host.cpu.system1mvalue: oid:1.3.6.1.4.1.3375.2.1.1.2.20.24.0- key: f5.lb.sys.global.host.cpu.user1mvalue: oid:1.3.6.1.4.1.3375.2.1.1.2.20.22.0- subgroup: f5-memorytable: falsefeatureSet: instance-memorymetrics:- key: f5.lb.sys.host.memory.totalvalue: oid:1.3.6.1.4.1.3375.2.1.7.1.1.0- key: f5.lb.sys.host.memory.usedvalue: oid:1.3.6.1.4.1.3375.2.1.7.1.2.0- key: com.dynatrace.extension.network_device.memory_usedvalue: oid:1.3.6.1.4.1.3375.2.1.7.1.4.0- key: com.dynatrace.extension.network_device.memory_totalvalue: oid:1.3.6.1.4.1.3375.2.1.7.1.3.0topology:types:- name: f5lb:instancedisplayName: F5 BIG-IP Instancerules:- idPattern: f5_instance_{instance.name}instanceNamePattern: '{instance.name}'iconPattern: f5sources:- sourceType: Metricscondition: $eq(f5.lb.sys.uptime)attributes:- key: dt.ip_addressesdisplayName: IP Addresspattern: '{device.address}'- key: dt.dns_namesdisplayName: DNS Namepattern: '{instance.name}'- key: OSReleasedisplayName: OS releasepattern: '{instance.systemrelease}'- key: OSArchitecturedisplayName: OS architecturepattern: '{instance.systemarch}'- key: OSNamedisplayName: OS namepattern: '{instance.systemname}'- key: ProductVersiondisplayName: Product versionpattern: '{instance.productversion}'- key: FailoverStatuspattern: '{failover.state}'displayName: Failover status- key: SyncStatuspattern: '{sync.state}'displayName: Config sync statusrole: default- idPattern: f5_instance_{instance.name}instanceNamePattern: '{instance.name}'iconPattern: f5sources:- sourceType: Metricscondition: $prefix(f5.lb)requiredDimensions: []attributes: []role: default- name: f5lb:interfacedisplayName: F5 BIG-IP Interfacerules:- idPattern: f5_interface_{instance.name}_{interface.name}instanceNamePattern: '{interface.name}'iconPattern: network-interfacessources:- sourceType: Metricscondition: $eq(f5.lb.sys.interface.status)attributes:- key: EnabledStatedisplayName: Enabled Statepattern: '{interface.enabled}'- key: MacAddressdisplayName: MAC Addresspattern: '{mac.address}'- key: StatusdisplayName: Statuspattern: '{interface.status}'role: default- idPattern: f5_interface_{instance.name}_{interface.name}instanceNamePattern: '{interface.name}'iconPattern: network-interfacessources:- sourceType: Metricscondition: $prefix(f5.lb.sys.interface)requiredDimensions: []attributes: []role: defaultrelationships:- fromType: f5lb:interfacetypeOfRelation: RUNS_ONtoType: f5lb:instancesources:- sourceType: Metricscondition: $prefix(f5.lb.sys.interface)screens:- entityType: f5lb:instancedetailsSettings:staticContent:showProblems: trueshowProperties: trueshowTags: trueshowGlobalFilter: trueshowAddTag: truetarget: BOTHlayout:autoGenerate: falsecards:- key: f5_instance-charts-cputype: CHART_GROUP- key: f5_instance-charts-memorytype: CHART_GROUPchartsCards:- key: f5_instance-charts-cputarget: BOTHmode: NORMALdisplayName: CPUnumberOfVisibleCharts: 4chartsInRow: 4charts:- displayName: CPU BreakdownvisualizationType: GRAPH_CHARTgraphChartConfig:connectGaps: truestacked: truemetrics:- metricSelector: f5.lb.sys.global.host.cpu.idle1m:splitBy("dt.entity.f5lb:instance")dqlQuery: timeseries idle1m=avg(f5.lb.sys.global.host.cpu.idle1m),by:{`dt.entity.f5lb:instance`},filter:{`dt.entity.f5lb:instance`==$(entityId)}visualization:displayName: Idle- metricSelector: f5.lb.sys.global.host.cpu.system1m:splitBy("dt.entity.f5lb:instance")dqlQuery: timeseries system1m=avg(f5.lb.sys.global.host.cpu.system1m),by:{`dt.entity.f5lb:instance`},filter:{`dt.entity.f5lb:instance`==$(entityId)}visualization:displayName: System- metricSelector: f5.lb.sys.global.host.cpu.user1m:splitBy("dt.entity.f5lb:instance")dqlQuery: timeseries user1m=avg(f5.lb.sys.global.host.cpu.user1m),by:{`dt.entity.f5lb:instance`},filter:{`dt.entity.f5lb:instance`==$(entityId)}visualization:displayName: Uservisualization:themeColor: DEFAULTseriesType: AREA- displayName: System CPUvisualizationType: GRAPH_CHARTgraphChartConfig:connectGaps: truemetrics:- metricSelector: f5.lb.sys.global.host.cpu.system1m:splitBy("dt.entity.f5lb:instance")dqlQuery: timeseries system1m=avg(f5.lb.sys.global.host.cpu.system1m),by:{`dt.entity.f5lb:instance`},filter:{`dt.entity.f5lb:instance`==$(entityId)}visualization:themeColor: BLUEseriesType: LINE- displayName: User CPUvisualizationType: GRAPH_CHARTgraphChartConfig:connectGaps: truemetrics:- metricSelector: f5.lb.sys.global.host.cpu.user1m:splitBy("dt.entity.f5lb:instance")dqlQuery: timeseries user1m=avg(f5.lb.sys.global.host.cpu.user1m),by:{`dt.entity.f5lb:instance`},filter:{`dt.entity.f5lb:instance`==$(entityId)}visualization:themeColor: BLUEseriesType: LINE- displayName: Idle CPUvisualizationType: GRAPH_CHARTgraphChartConfig:connectGaps: truemetrics:- metricSelector: f5.lb.sys.global.host.cpu.idle1m:splitBy("dt.entity.f5lb:instance")dqlQuery: timeseries idle1m=avg(f5.lb.sys.global.host.cpu.idle1m),by:{`dt.entity.f5lb:instance`},filter:{`dt.entity.f5lb:instance`==$(entityId)}visualization:themeColor: BLUEseriesType: LINE- key: f5_instance-charts-memorytarget: BOTHmode: NORMALdisplayName: MemorynumberOfVisibleCharts: 4hideEmptyCharts: truecharts:- displayName: Memory breakdownvisualizationType: GRAPH_CHARTgraphChartConfig:connectGaps: trueyAxes:- key: y-absoluteposition: LEFTvisible: true- key: y-relativeposition: RIGHTvisible: truemin: '0'max: '100'metrics:- metricSelector: f5.lb.sys.host.memory.total:splitBy("dt.entity.f5lb:instance")dqlQuery: timeseries total=avg(f5.lb.sys.host.memory.total),by:{`dt.entity.f5lb:instance`},filter:{`dt.entity.f5lb:instance`==$(entityId)}yAxisKey: y-absolutevisualization:themeColor: BLUEseriesType: AREAdisplayName: Total- metricSelector: f5.lb.sys.host.memory.used:splitBy("dt.entity.f5lb:instance")dqlQuery: timeseries used=avg(f5.lb.sys.host.memory.used),by:{`dt.entity.f5lb:instance`},filter:{`dt.entity.f5lb:instance`==$(entityId)}yAxisKey: y-absolutevisualization:themeColor: ORANGEseriesType: AREAdisplayName: Used
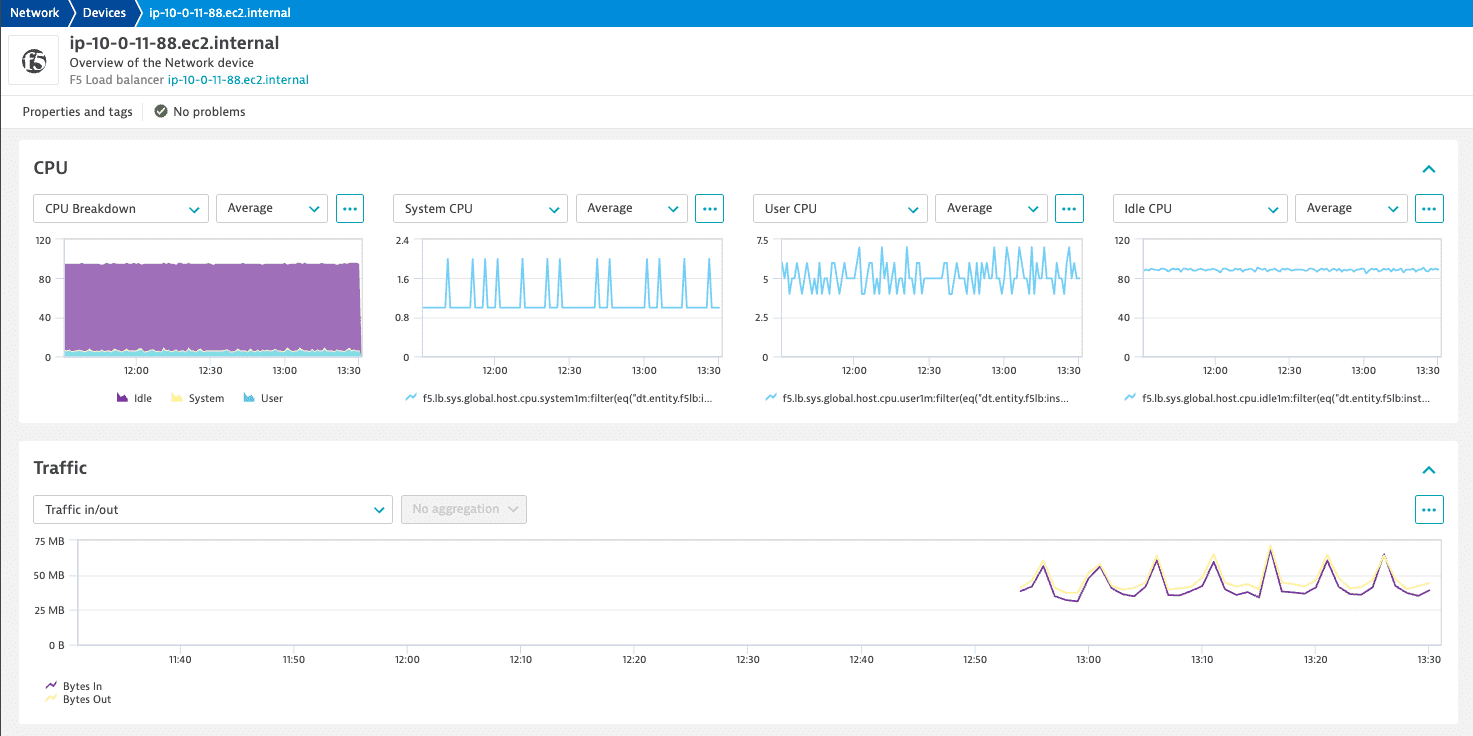
3_advanced.yaml
This showcases advanced usage.
The network device and interface now have access to more data. The network device has also been given additional attributes and charts to display.
Show me the 3_advanced.yaml manifest file
name: custom:f5-load-balancerversion: 1.2.0minDynatraceVersion: 1.289.0author:name: Dynatrace# In this example, we add topology rules for customizing the network model.# And modify the screens to customize the UI of the network device.# All other changes done so far stay the same.snmp:- group: f5interval:minutes: 1dimensions:- key: instance.namevalue: oid:1.3.6.1.2.1.1.5.0- key: failover.statevalue: oid:1.3.6.1.4.1.3375.2.1.14.3.1.0- key: sync.statevalue: oid:1.3.6.1.4.1.3375.2.1.14.1.1.0# Adding the mandatory dimensions here ensures they appear everywhere- key: monitoring.modevalue: const:Extension- key: sys.namevalue: oid:1.3.6.1.2.1.1.5.0- key: device.typevalue: const:F5 Load balancersubgroups:- subgroup: f5-instance-detailstable: falsedimensions:- key: instance.systemnamevalue: oid:1.3.6.1.4.1.3375.2.1.6.1.0- key: instance.systemreleasevalue: oid:1.3.6.1.4.1.3375.2.1.6.3.0- key: instance.systemarchvalue: oid:1.3.6.1.4.1.3375.2.1.6.5.0- key: instance.productversionvalue: oid:1.3.6.1.4.1.3375.2.1.4.2.0metrics:- key: f5.lb.sys.uptimevalue: oid:1.3.6.1.4.1.3375.2.1.6.6.0- key: com.dynatrace.extension.network_device.sysuptimevalue: oid:1.3.6.1.4.1.3375.2.1.6.6.0- subgroup: f5-interface-detailsfeatureSet: interfacetable: truedimensions:- key: interface.namevalue: oid:1.3.6.1.4.1.3375.2.1.2.4.1.2.1.1- key: if.namevalue: oid:1.3.6.1.4.1.3375.2.1.2.4.1.2.1.1- key: interface.enabledvalue: oid:1.3.6.1.4.1.3375.2.1.2.4.1.2.1.8- key: interface.statusvalue: oid:1.3.6.1.4.1.3375.2.1.2.4.1.2.1.17- key: mac.addressvalue: $networkFormat(const:macAddress, oid:1.3.6.1.4.1.3375.2.1.2.4.1.2.1.6)metrics:- key: f5.lb.sys.interface.statusvalue: const:1- key: com.dynatrace.extension.network_device.if.statusvalue: const:1- subgroup: f5-interface-metricsfeatureSet: interfacetable: truedimensions:- key: interface.namevalue: oid:1.3.6.1.4.1.3375.2.1.2.4.4.3.1.1metrics:- key: f5.lb.sys.interface.stat.bytes.in.countvalue: oid:1.3.6.1.4.1.3375.2.1.2.4.4.3.1.3type: count- key: f5.lb.sys.interface.stat.bytes.out.countvalue: oid:1.3.6.1.4.1.3375.2.1.2.4.4.3.1.5type: count- key: com.dynatrace.extension.network_device.if.bytes_in.countvalue: oid:1.3.6.1.4.1.3375.2.1.2.4.4.3.1.3type: count- key: com.dynatrace.extension.network_device.if.bytes_out.countvalue: oid:1.3.6.1.4.1.3375.2.1.2.4.4.3.1.5type: count- key: f5.lb.sys.interface.stat.pkts.in.countvalue: oid:1.3.6.1.4.1.3375.2.1.2.4.4.3.1.2type: count- key: f5.lb.sys.interface.stat.pkts.out.countvalue: oid:1.3.6.1.4.1.3375.2.1.2.4.4.3.1.4type: count- subgroup: f5-cputable: falsefeatureSet: instance-cpumetrics:- key: com.dynatrace.extension.network_device.cpu_usagevalue: oid:1.3.6.1.4.1.3375.2.1.1.2.20.29.0- key: f5.lb.sys.global.host.cpu.idle1mvalue: oid:1.3.6.1.4.1.3375.2.1.1.2.20.25.0- key: f5.lb.sys.global.host.cpu.iowait1mvalue: oid:1.3.6.1.4.1.3375.2.1.1.2.20.28.0- key: f5.lb.sys.global.host.cpu.irq1mvalue: oid:1.3.6.1.4.1.3375.2.1.1.2.20.26.0- key: f5.lb.sys.global.host.cpu.softirq1minvalue: oid:1.3.6.1.4.1.3375.2.1.1.2.20.27.0- key: f5.lb.sys.global.host.cpu.stolen1mvalue: oid:1.3.6.1.4.1.3375.2.1.1.2.20.40.0- key: f5.lb.sys.global.host.cpu.system1mvalue: oid:1.3.6.1.4.1.3375.2.1.1.2.20.24.0- key: f5.lb.sys.global.host.cpu.user1mvalue: oid:1.3.6.1.4.1.3375.2.1.1.2.20.22.0- subgroup: f5-memorytable: falsefeatureSet: instance-memorymetrics:- key: f5.lb.sys.host.memory.totalvalue: oid:1.3.6.1.4.1.3375.2.1.7.1.1.0- key: f5.lb.sys.host.memory.usedvalue: oid:1.3.6.1.4.1.3375.2.1.7.1.2.0- key: com.dynatrace.extension.network_device.memory_usedvalue: oid:1.3.6.1.4.1.3375.2.1.7.1.4.0- key: com.dynatrace.extension.network_device.memory_totalvalue: oid:1.3.6.1.4.1.3375.2.1.7.1.3.0topology:types:# These are already existing rules which we can copy & adjust- name: f5lb:instance # Closely resembles a network devicedisplayName: F5 BIG-IP Instancerules:- idPattern: f5_instance_{instance.name}instanceNamePattern: '{instance.name}'iconPattern: f5sources:- sourceType: Metricscondition: $eq(f5.lb.sys.uptime)attributes:- key: dt.ip_addressesdisplayName: IP Addresspattern: '{device.address}'- key: dt.dns_namesdisplayName: DNS Namepattern: '{instance.name}'- key: OSReleasedisplayName: OS releasepattern: '{instance.systemrelease}'- key: OSArchitecturedisplayName: OS architecturepattern: '{instance.systemarch}'- key: OSNamedisplayName: OS namepattern: '{instance.systemname}'- key: ProductVersiondisplayName: Product versionpattern: '{instance.productversion}'- key: FailoverStatuspattern: '{failover.state}'displayName: Failover status- key: SyncStatuspattern: '{sync.state}'displayName: Config sync statusrole: default- idPattern: f5_instance_{instance.name}instanceNamePattern: '{instance.name}'iconPattern: f5sources:- sourceType: Metricscondition: $prefix(f5.lb)requiredDimensions: []attributes: []role: default- name: f5lb:interface # Closely resembles a network interfacedisplayName: F5 BIG-IP Interfacerules:- idPattern: f5_interface_{instance.name}_{interface.name}instanceNamePattern: '{interface.name}'iconPattern: network-interfacessources:- sourceType: Metricscondition: $eq(f5.lb.sys.interface.status)attributes:- key: EnabledStatedisplayName: Enabled Statepattern: '{interface.enabled}'- key: MacAddressdisplayName: MAC Addresspattern: '{mac.address}'- key: StatusdisplayName: Statuspattern: '{interface.status}'role: default- idPattern: f5_interface_{instance.name}_{interface.name}instanceNamePattern: '{interface.name}'iconPattern: network-interfacessources:- sourceType: Metricscondition: $prefix(f5.lb.sys.interface)requiredDimensions: []attributes: []role: default# These are new rules added to customize the model- name: network:deviceenabled: truedisplayName: Network devicerules:- idPattern: network_device_{device.address} # must follow `network_device_{...}` patterninstanceNamePattern: '{instance.name}'iconPattern: f5sources:- sourceType: Metricscondition: $eq(f5.lb.sys.uptime) # It's important to target specialized metrics, not the generic onesattributes:- key: dt.ip_addressesdisplayName: IP Addresspattern: '{device.address}'- key: dt.dns_namesdisplayName: DNS Namepattern: '{instance.name}'- key: OSReleasedisplayName: OS releasepattern: '{instance.systemrelease}'- key: OSArchitecturedisplayName: OS architecturepattern: '{instance.systemarch}'- key: OSNamedisplayName: OS namepattern: '{instance.systemname}'- key: ProductVersiondisplayName: Product versionpattern: '{instance.productversion}'- key: FailoverStatuspattern: '{failover.state}'displayName: Failover status- key: SyncStatuspattern: '{sync.state}'displayName: Config sync statusrole: default- idPattern: network_device_{device.address}instanceNamePattern: '{instance.name}'iconPattern: f5sources:- sourceType: Metricscondition: $prefix(f5.lb)requiredDimensions: []attributes: []role: default- name: network:interfaceenabled: truedisplayName: Network interfacerules:- idPattern: network_interface_{mac.address}_{interface.name} # must follow `network_interface_{...}_{...}` patterninstanceNamePattern: '{interface.name}'iconPattern: network-interfacessources:- sourceType: Metricscondition: $eq(f5.lb.sys.interface.status) # Again, we target specialized metrics, not generic onesattributes:- key: EnabledStatedisplayName: Enabled Statepattern: '{interface.enabled}'- key: MacAddressdisplayName: MAC Addresspattern: '{mac.address}'- key: ifOperStatusdisplayName: Operational statuspattern: '{interface.status}'role: default- idPattern: network_interface_{mac.address}_{interface.name}instanceNamePattern: '{interface.name}'iconPattern: network-interfacessources:- sourceType: Metricscondition: $prefix(f5.lb.sys.interface)requiredDimensions: []attributes: []role: defaultrelationships:- fromType: f5lb:interfacetypeOfRelation: RUNS_ONtoType: f5lb:instancesources:- sourceType: Metricscondition: $prefix(f5.lb.sys.interface)# Adding the same as relationships- fromType: f5lb:interfacetypeOfRelation: SAME_AStoType: network:interfacesources:- sourceType: Metricscondition: $prefix(f5.lb.sys.interface)- fromType: f5lb:instancetypeOfRelation: SAME_AStoType: network:devicesources:- sourceType: Metricscondition: $prefix(f5.lb)screens:# Customizing the screen for the network device- entityType: network:devicepropertiesCard:properties:# Show a link to the specialized entity- type: RELATIONrelation:entitySelectorTemplate: type(f5lb:instance),fromRelationships.isSameAs($(entityConditions))displayName: F5 Load balancerconditions:# Apply only to devices that have a same as relation, who are monitored by Extension# These 2 conditions are used althroughout the screen definition- relatedEntity|entitySelectorTemplate=type(f5lb:instance),fromRelationships.isSameAs($(entityConditions))- entityAttribute|devMonitoringMode=Extension# Must define everything in `detailsInjections` and not `detailsSettings`!detailsInjections:# This card is injected by reference, meaning we don't have to duplicate the definition again- type: CHART_GROUPkey: f5_instance-charts-cpu# When using `entitySelectorTemplate`, the card is understood to be defined as part of the# resolved entity's screen definition, and not the current screen definition.entitySelectorTemplate: type(f5lb:instance),fromRelationships.isSameAs($(entityConditions))conditions:- relatedEntity|entitySelectorTemplate=type(f5lb:instance),fromRelationships.isSameAs($(entityConditions))- entityAttribute|devMonitoringMode=Extension# Of course, full definitions are still supported- type: CHART_GROUPkey: network-interfaces-listchartsCards:- key: network-interfaces-listmode: NORMALtarget: BOTH # Use CLASSIC for Managed, PLATFORM for SaaS, or BOTH for bothdisplayName: TrafficnumberOfVisibleCharts: 1conditions:# Even if your card is generic, you should still apply this condition so that only# monitored devices display the card.- entityAttribute|devMonitoringMode=Extensioncharts:- displayName: Traffic in/outvisualizationType: GRAPH_CHARTgraphChartConfig:metrics:# metricSelector is required for Managed- metricSelector: com.dynatrace.extension.network_device.if.bytes_in.count:splitBy("dt.entity.network:device)# dqlQuery is required for SaaSdqlQuery: timeseries bytesIn=avg(com.dynatrace.extension.network_device.if.bytes_in.count),by:{`dt.entity.network:device`},filter:{`dt.entity.network:device`==$(entityId)}visualization:displayName: Bytes In- metricSelector: com.dynatrace.extension.network_device.if.bytes_out.count:splitBy("dt.entity.network:device")dqlQuery: timeseries bytesOut=avg(com.dynatrace.extension.network_device.if.bytes_out.count),by:{`dt.entity.network:device`},filter:{`dt.entity.network:device`==$(entityId)}visualization:displayName: Bytes Out- entityType: f5lb:instancedetailsSettings:staticContent:showProblems: trueshowProperties: trueshowTags: trueshowGlobalFilter: trueshowAddTag: truetarget: BOTHlayout:autoGenerate: falsecards:- key: f5_instance-charts-cputype: CHART_GROUP- key: f5_instance-charts-memorytype: CHART_GROUPchartsCards:- key: f5_instance-charts-cputarget: BOTHmode: NORMALdisplayName: CPUnumberOfVisibleCharts: 4chartsInRow: 4charts:- displayName: CPU BreakdownvisualizationType: GRAPH_CHARTgraphChartConfig:connectGaps: truestacked: truemetrics:- metricSelector: f5.lb.sys.global.host.cpu.idle1m:splitBy("dt.entity.f5lb:instance")dqlQuery: timeseries idle1m=avg(f5.lb.sys.global.host.cpu.idle1m),by:{`dt.entity.f5lb:instance`},filter:{`dt.entity.f5lb:instance`==$(entityId)}visualization:displayName: Idle- metricSelector: f5.lb.sys.global.host.cpu.system1m:splitBy("dt.entity.f5lb:instance")dqlQuery: timeseries system1m=avg(f5.lb.sys.global.host.cpu.system1m),by:{`dt.entity.f5lb:instance`},filter:{`dt.entity.f5lb:instance`==$(entityId)}visualization:displayName: System- metricSelector: f5.lb.sys.global.host.cpu.user1m:splitBy("dt.entity.f5lb:instance")dqlQuery: timeseries user1m=avg(f5.lb.sys.global.host.cpu.user1m),by:{`dt.entity.f5lb:instance`},filter:{`dt.entity.f5lb:instance`==$(entityId)}visualization:displayName: Uservisualization:themeColor: DEFAULTseriesType: AREA- displayName: System CPUvisualizationType: GRAPH_CHARTgraphChartConfig:connectGaps: truemetrics:- metricSelector: f5.lb.sys.global.host.cpu.system1m:splitBy("dt.entity.f5lb:instance")dqlQuery: timeseries system1m=avg(f5.lb.sys.global.host.cpu.system1m),by:{`dt.entity.f5lb:instance`},filter:{`dt.entity.f5lb:instance`==$(entityId)}visualization:themeColor: BLUEseriesType: LINE- displayName: User CPUvisualizationType: GRAPH_CHARTgraphChartConfig:connectGaps: truemetrics:- metricSelector: f5.lb.sys.global.host.cpu.user1m:splitBy("dt.entity.f5lb:instance")dqlQuery: timeseries user1m=avg(f5.lb.sys.global.host.cpu.user1m),by:{`dt.entity.f5lb:instance`},filter:{`dt.entity.f5lb:instance`==$(entityId)}visualization:themeColor: BLUEseriesType: LINE- displayName: Idle CPUvisualizationType: GRAPH_CHARTgraphChartConfig:connectGaps: truemetrics:- metricSelector: f5.lb.sys.global.host.cpu.idle1m:splitBy("dt.entity.f5lb:instance")dqlQuery: timeseries idle1m=avg(f5.lb.sys.global.host.cpu.idle1m),by:{`dt.entity.f5lb:instance`},filter:{`dt.entity.f5lb:instance`==$(entityId)}visualization:themeColor: BLUEseriesType: LINE- key: f5_instance-charts-memorytarget: BOTHmode: NORMALdisplayName: MemorynumberOfVisibleCharts: 4hideEmptyCharts: truecharts:- displayName: Memory breakdownvisualizationType: GRAPH_CHARTgraphChartConfig:connectGaps: trueyAxes:- key: y-absoluteposition: LEFTvisible: true- key: y-relativeposition: RIGHTvisible: truemin: '0'max: '100'metrics:- metricSelector: f5.lb.sys.host.memory.total:splitBy("dt.entity.f5lb:instance")dqlQuery: timeseries total=avg(f5.lb.sys.host.memory.total),by:{`dt.entity.f5lb:instance`},filter:{`dt.entity.f5lb:instance`==$(entityId)}yAxisKey: y-absolutevisualization:themeColor: BLUEseriesType: AREAdisplayName: Total- metricSelector: f5.lb.sys.host.memory.used:splitBy("dt.entity.f5lb:instance")dqlQuery: timeseries used=avg(f5.lb.sys.host.memory.used),by:{`dt.entity.f5lb:instance`},filter:{`dt.entity.f5lb:instance`==$(entityId)}yAxisKey: y-absolutevisualization:themeColor: ORANGEseriesType: AREAdisplayName: Used
FAQ
Where does device.address come from?
You may have noticed there's no special OID-based capturing of the device.address dimension in the shared manifests. This is because the example given is based on the SNMP data source, which automatically adds these dimensions to every collected metric.
Can this guide be used for any extension data source?
Yes. SNMP was given as an example as it is focused on network devices, but any extension can leverage this topology model so long as it sends the same metrics and dimensions described in this guide.
Is it possible to extend the details UI within the Infrastructure & Operations app?
Not yet, but this capability is expected to be available soon, at which point this guide will be updated to include the additional usage details.