JMX extensions
- Latest Dynatrace
- 7-min read
- Published Jul 19, 2017
JMX (Java Management Extensions) is ideal for monitoring applications built using Java. With Dynatrace, you can monitor any metric in your JVM that is exposed via an MBean.
Infrastructure Monitoring mode
JMX and PMI extensions are also available in Infrastructure Monitoring mode You can use them to monitor any infrastructure component and backing service written in Java and have all the collected metrics reported by Dynatrace.
Create a JMX extension
- Sign in to Dynatrace and go to Settings > Monitoring > Monitored technologies and select Add new technology monitoring. Of the four available options, one is Monitor Java or WebSphere based technologies. Select Add JMX/PMI extension.
- Select Use JMX/PMI extensions editor.
- Type the extension name. You can only use letters
A-Z, a-z, numbers0-9, or-/_. - Add the metrics source.
- Select one of the available technologies.
- Based on your selection, the editor will suggest the Java process as a source for your metrics. This narrows the list of available MBeans or PMI modules you will use in the next step. The technology behind the process determines whether you'll browse JMX MBeans or PMI modules. Select Add metrics source to use a suggested source. Click
 to select a different process. When selecting it, you can narrow the list of available processes by choosing a particular host or Management Zone.
Selecting the process, host, or Management Zone doesn't limit the extension monitoring scope. JMX/PMI extensions monitor all Java processes accessible to OneAgent. The metric defined for the same MBean and attribute will be also available in other Java processes across your application, which can quickly exhaust your custom metric limit.
You can also select individual hosts on which to run your new JMX extension, instead of running it globally across your whole environment.
- Immediately after you add your JMX extension, go to Settings> Monitored technologies > Custom extensions tab and disable it globally.
- Navigate to individual host pages, open the host settings, find your JMX extension and enable it.
-
When the metrics list is downloaded, select Add metric to start creating your extension.
Domain
Select the domain.
Select key properties
Key properties filter the list of available MBeans. Note that property values can contain wildcards. Select Exact match to filter MBeans list only to the entries matching the exact key property values.
Select MBean
Select one MBean from the list or leave All matching MBeans option. If more than one MBean is matched, this will cause the aggregation of attributes from all matching MBeans into one metric. You will define the aggregation type below.
Select attribute
The attributes available in the list are only the numeric ones. To see other attributes, for example attributes of the
Stringtype, select Include non-numeric attributes. Note that selected attributes must be parsable to double, or boolean type. Otherwise, Dynatrace OneAgent will not collect any data from such a metric.Display name
You can define a custom display name for the metric.
Unit
Select the metric unit.
Aggregation
Select the aggregation method if you're pulling an attribute from a number of matching Mbeans.
Calculation
Delta calculates the change in values of the given attribute. Rate calculates the rate of changes per seconds. When you select both, you can convert an absolute attribute (eg. Request Count) to a rate (eg. Requests per Second). Value = attribute / query interval.
Creating the PMI extension
Creating the PMI extension is very similar to the JMX extension. PMI Module translates to JMX Mbean and statistics to attributes. All other settings behave accordingly.
Saving the extension
After you add the metric, you can still edit or delete its definition. You need to select Save to register the extension and start collecting data from all Java processes that contain defined MBeans. After you save the extension, you can't edit or delete the metrics, as this way we're able to maintain the continuity of your data. You can still add new metrics. This time, however, you won't be able to select the base Java process, because you'll use a process where the extension is already deployed.
Customizing your extension
The Dynatrace JMX extensions are highly customizable beyond the capabilities of the editor. You can download your extension and edit its JSON file that describes your JMX metrics and how you want to display them. For reference and examples, see Customizing JMX Plugins.
Viewing JMX metrics in Dynatrace
JMX metrics are available for all Java-based processes monitored by OneAgent.
Once your extension is uploaded, Dynatrace automatically begins querying the defined metrics for all Java processes. To find the metrics, go to a relevant process page and select Further details.
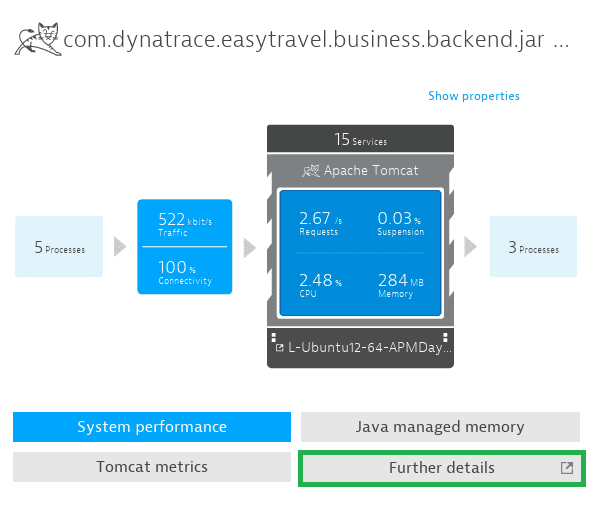
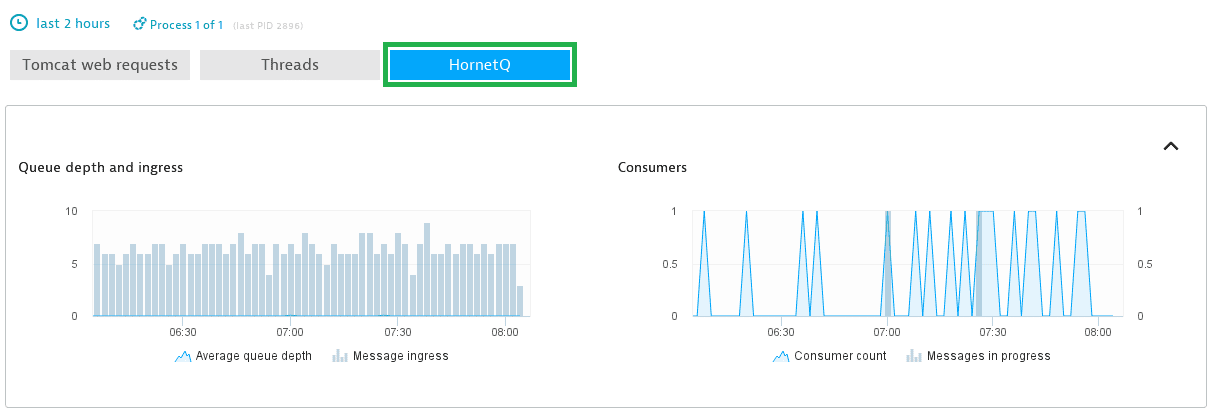
For example, for a extension named HornetQ, go to the process you selected when creating the extension, select Further details and then select the HornetQ tab named automatically after the extension name. You'll find all the defined metrics there.
Not seeing a certain metric?
JMX monitoring is highly dynamic. If a particular metric doesn’t exist in your JVM, it's not an error—the metric simply isn't available.
JMX/PMI extension custom metrics
You may notice that the number of metrics in the plugin.json file of your JMX/PMI extension differs from the number of billed custom metrics. This is because JMX/PMI extensions provide "splittings" which can be used to define additional dimensions for reported metrics. For each value of a selected property, a separate timeseries metric is created at runtime. The actual number of timeseries metrics depends on the number of distinct values for the selected property.
The following sample shows how to define a metric that provides multiple timeseries with a single metric:
"metrics": [{"timeseries": {"key": "XY.Size","unit": "Count","displayname": "Queue Consumer Count","dimensions": ["rx_pid","name"]}"source": {"domain": "com.sample","keyProperties": {"type": "XY","name": "*"},"attribute": "Size","splitting": {"name": "name","type": "keyProperty","keyProperty": "name"}}}]
In this example, MBeans com.sample:type=XY,name=A and com.sample:type=XY,name=B will result in two timeseries metrics (A and B).
Since such values typically aren't known in advance, and are subject to change, this can lead to an unexpectedly high number of consumed custom metrics. If the values of the property are known in advance, or if only some of the values are of interest, we recommend that you specify one metric for each value and not use splitting.
Metrics limit per JMX extension
There can be no more than 5,000 metrics per JMX extension. This limit is necessary to prevent underperforming or metric-heavy extensions from overwhelming the monitoring system.
Monitoring consumption
The JMX extension listed below initially consume each monitored host's quota of included metrics. Once the included metrics quota is exhausted, DDU consumption begins. The figures in the table below represent the expected consumption per process for each technology type that an extension monitors. The Custom metrics count reflects the default set of metrics that are generated by each extension.
| Technology | Type | Custom metrics |
|---|---|---|
ActiveMQ JMX | JMX Monitoring | 15 |
Apache Hadoop HDFS | JMX Monitoring | 43 |
Apache Hadoop YARN | JMX Monitoring | 48 |
Apache Spark | JMX Monitoring | 17 |
Cassandra JMX | JMX Monitoring | 28 |
HornetQ JMX | JMX Monitoring | 5 |
JBoss Connection Pools | JMX Monitoring | 14 |
Jetty JMX | JMX Monitoring | 7 |
Kafka JMX | JMX Monitoring | 42 |
Solr JMX | JMX Monitoring | 24 |
Tomcat Connection Pools | JMX Monitoring | |
WebLogic Connection Pools | JMX Monitoring | 12 |
WebSphere Liberty Connection Pools | JMX Monitoring | 5 |
WSO2 API Manager | JMX Monitoring | 27 |