What's new in Dynatrace SaaS 1.343
- Release notes
- 33-min read
- Rollout start on Jul 14, 2026
This page showcases new features, changes, and bug fixes in Dynatrace SaaS version 1.343. It contains:
Software Delivery
Configurable update windows and target versions for Environment ActiveGate
Environment ActiveGate auto-updates now offer the same controls as OneAgent.
You can pick a target version (Latest stable, Previous stable, Older stable, or a specific main version, and the latest sub-version is applied automatically), choose one of three update modes (Automatic at earliest convenience, Automatic during update window, or No automatic updates), and share the same update windows you already use for OneAgent.
Per-ActiveGate settings can override environment defaults, and manually managed ActiveGates expose an Update now to target version button.
The Environment Deployment API endpoints GET /api/v1/deployment/installer/gateway/{osType}/latest and GET /api/v1/deployment/installer/gateway/{osType}/latest/metainfo honor the configured target version too, so downloads and installer metadata stay consistent with the environment's chosen ActiveGate version.
Platform
Manage your Dynatrace monitoring fleet in one place
 Fleet Management is now available. It provides administrators with a new home to manage Dynatrace components at scale. From one consistent experience, you can:
- Monitor health and deployment overviews for OneAgent and ActiveGate.
- Troubleshoot, install, and keep components up to date.
- Manage network zones at scale.
- Apply attribute-based access control for granular permissions.
- Schedule flexible updates across your fleet components.
- Manage settings centrally for all fleet components.
- Use fleet data across Dynatrace platform, including dashboards, workflows, and more.
Check out the app in Dynatrace Hub.
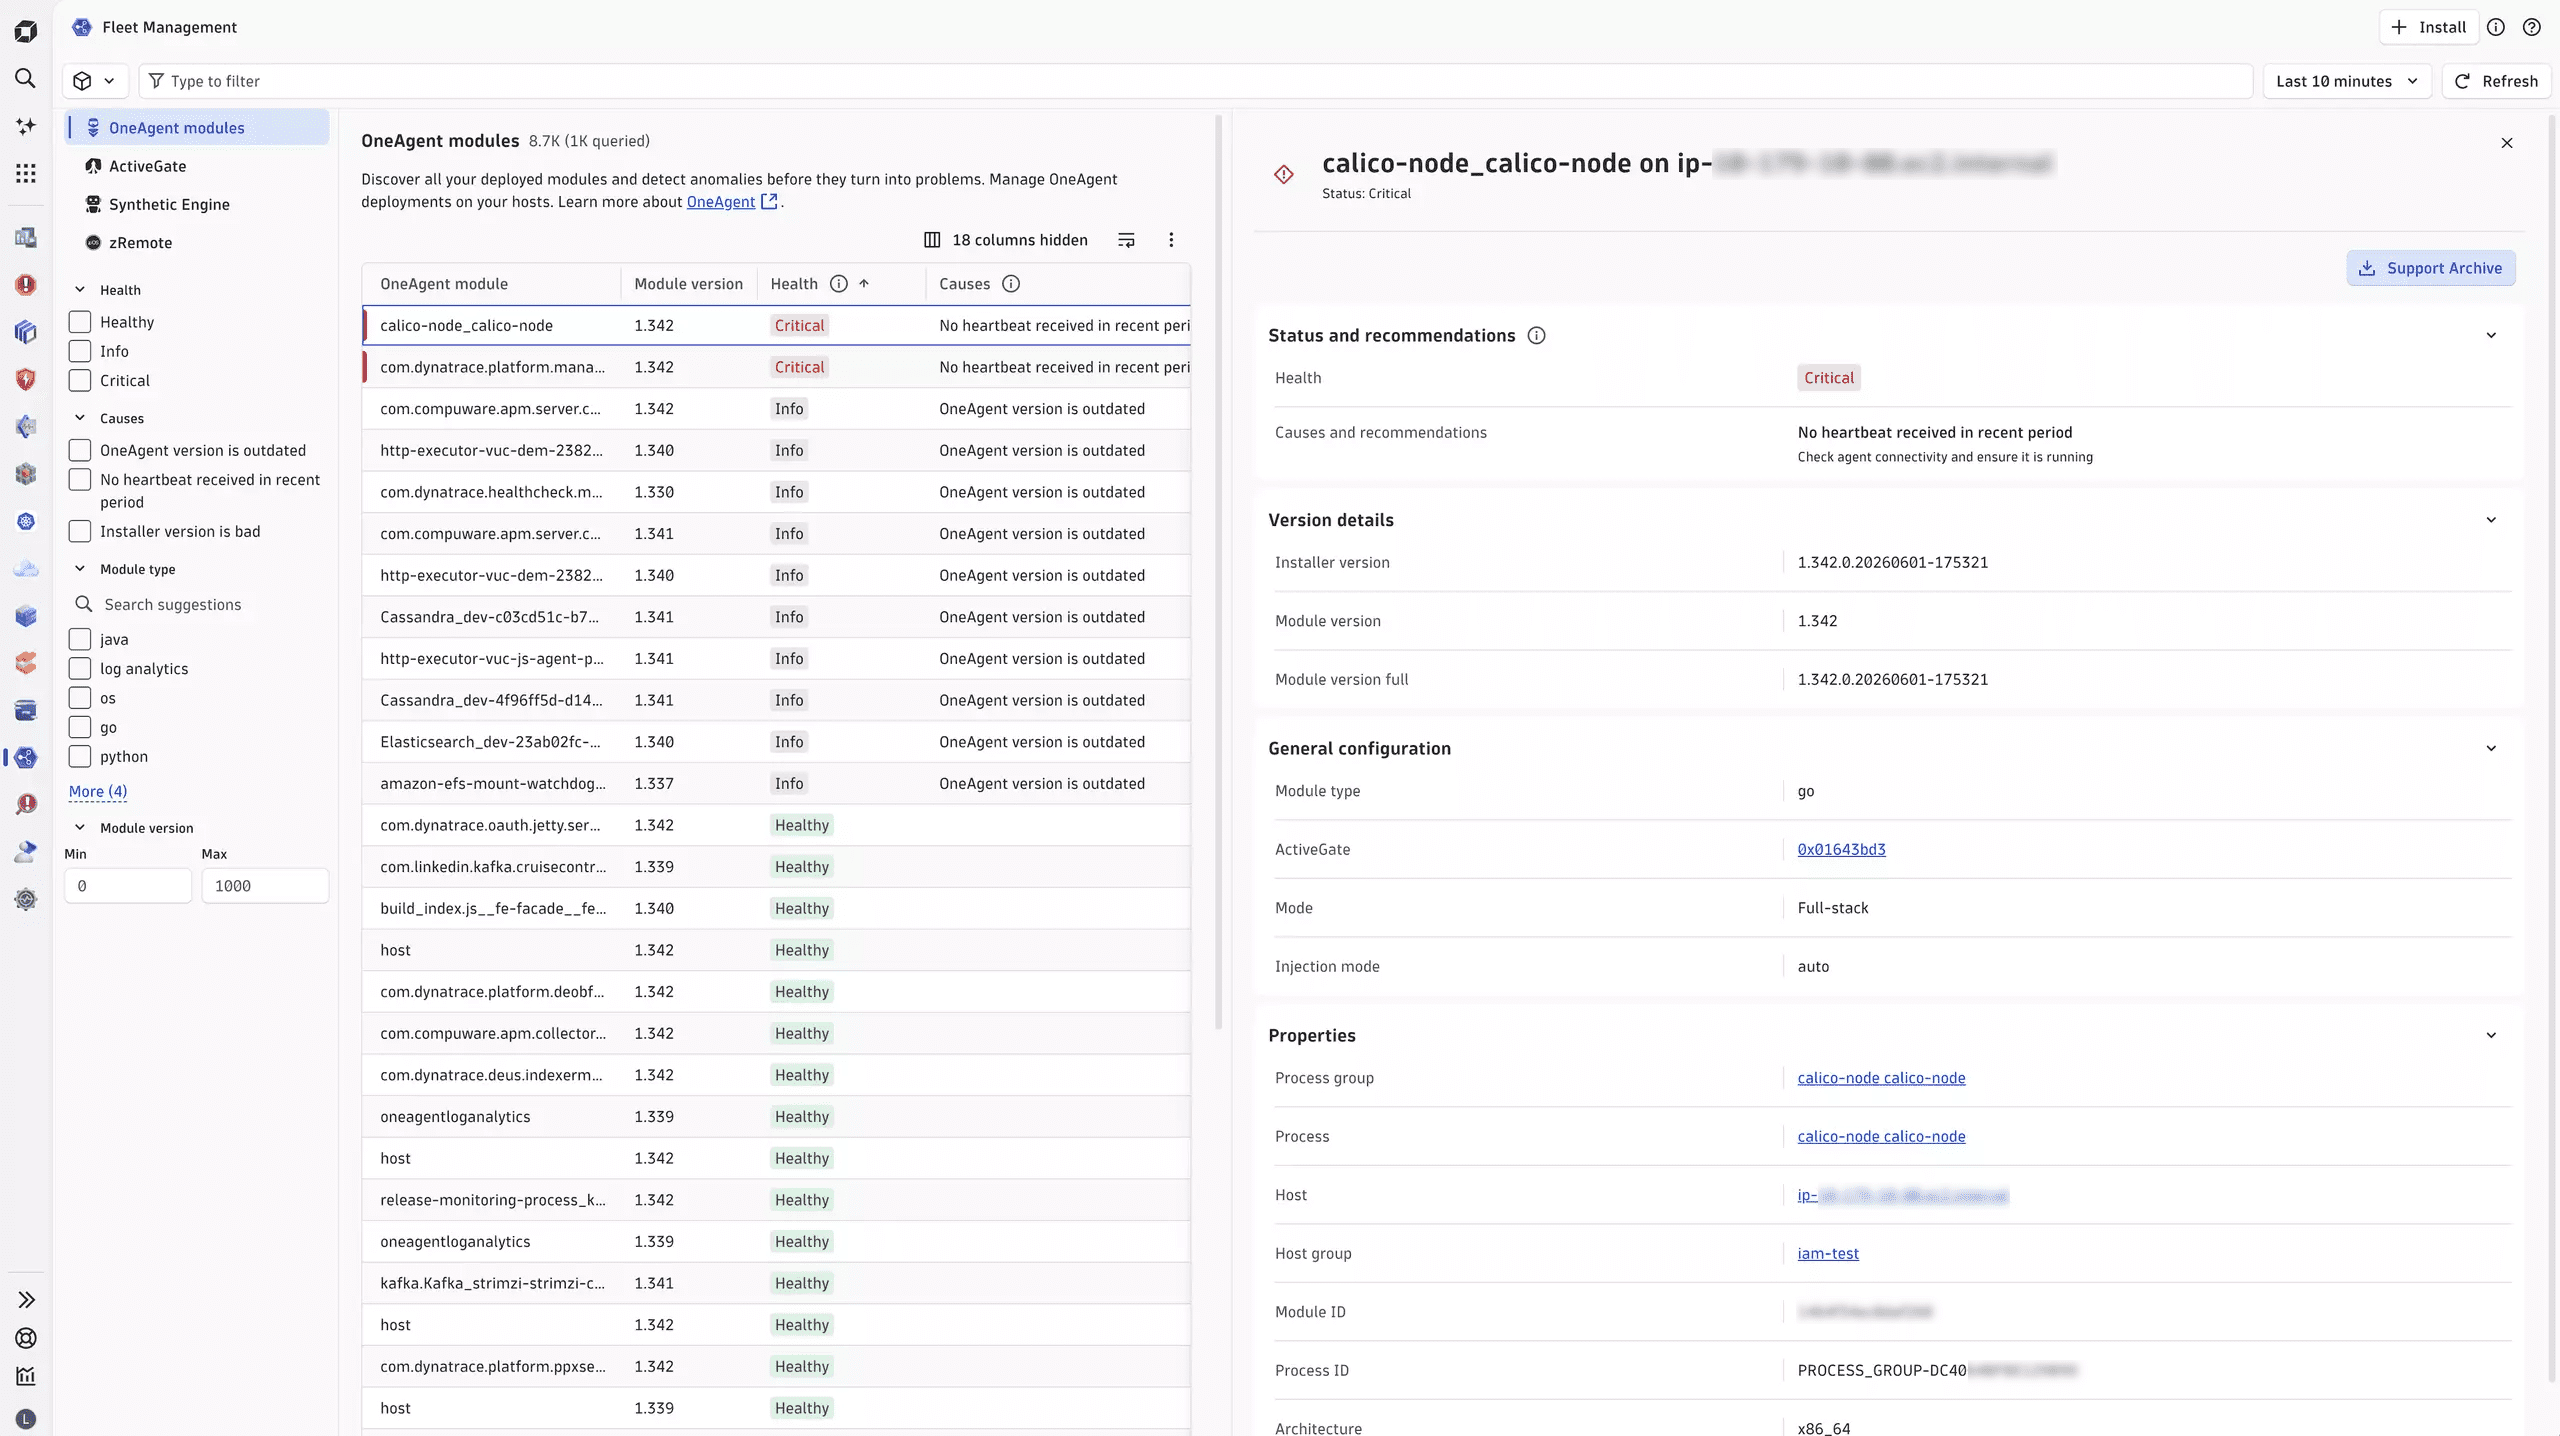
OneAgent in Fleet Management
You can now monitor and manage your OneAgent modules in the new Fleet Management. OneAgent module health and deployment details are enabled on a single view, making it easier to monitor, troubleshoot, and centrally manage configurations. You can query OneAgent health via DQL and integrate the Dynatrace platform experience with dashboards and more.
ActiveGate in Fleet Management
You can now monitor and manage your ActiveGates in the new Fleet Management. Use the purpose-driven views for ActiveGate, Synthetic Engine, and zRemote to surface operational data per deployment. This makes it easier to monitor, troubleshoot, and centrally manage configurations, such as updates. You can now schedule updates by defining target version and update windows for your ActiveGates—the same way you manage OneAgent updates.
Platform token support extended to ActiveGate and OneAgent fleet management APIs
You can now use platform tokens to authenticate against ActiveGate and OneAgent fleet management API endpoints, including new ActiveGate deployment APIs.
We recommend platform tokens over classic API tokens for new integrations. Platform tokens offer finer-grained access control tied to user permissions, environment-level scoping, and support for rotation and temporary disabling without deletion. The new deployment endpoints also use fine-grained permission scopes for better auditability. ActiveGate installers and images downloaded through the new deployment endpoints no longer include embedded environment configuration, reducing the risk of accidental credential exposure.
Existing API token authentication remains fully supported across all endpoints, so no changes are required for current integrations. To learn more, see Platform Tokens.
Digital Experience
Frontend-to-backend linking with OpenTelemetry
Dynatrace now supports frontend-to-backend linking from browser and mobile apps to backend services instrumented with OpenTelemetry.
- Frontend: Instrumented with Dynatrace Real User Monitoring (RUM). Dynatrace RUM now propagates trace context (traceparent, tracestate) from browsers and mobile apps.
- Backend: Instrumented via OTel SDKs and captured via OTel Collectors. OpenTelemetry‑instrumented backends receive and continue these traces.
This enables seamless correlation between user events and sessions in your web and mobile apps and distributed traces in backends monitored through OpenTelemetry, even when OneAgent is not used on the server side.
All existing UI features to navigate from frontend to backend are compatible with such setups.
To get started, see the documentation for web and mobile apps.
Digital Experience | Session Replay
New Session Replay is now generally available
Session Replay is now generally available for all Dynatrace SaaS customers using Digital Experience Monitoring (DEM) on Grail. Session recordings are natively stored in the Grail data lakehouse and fully integrated with  Users & Sessions.
The new Session Replay includes:
-
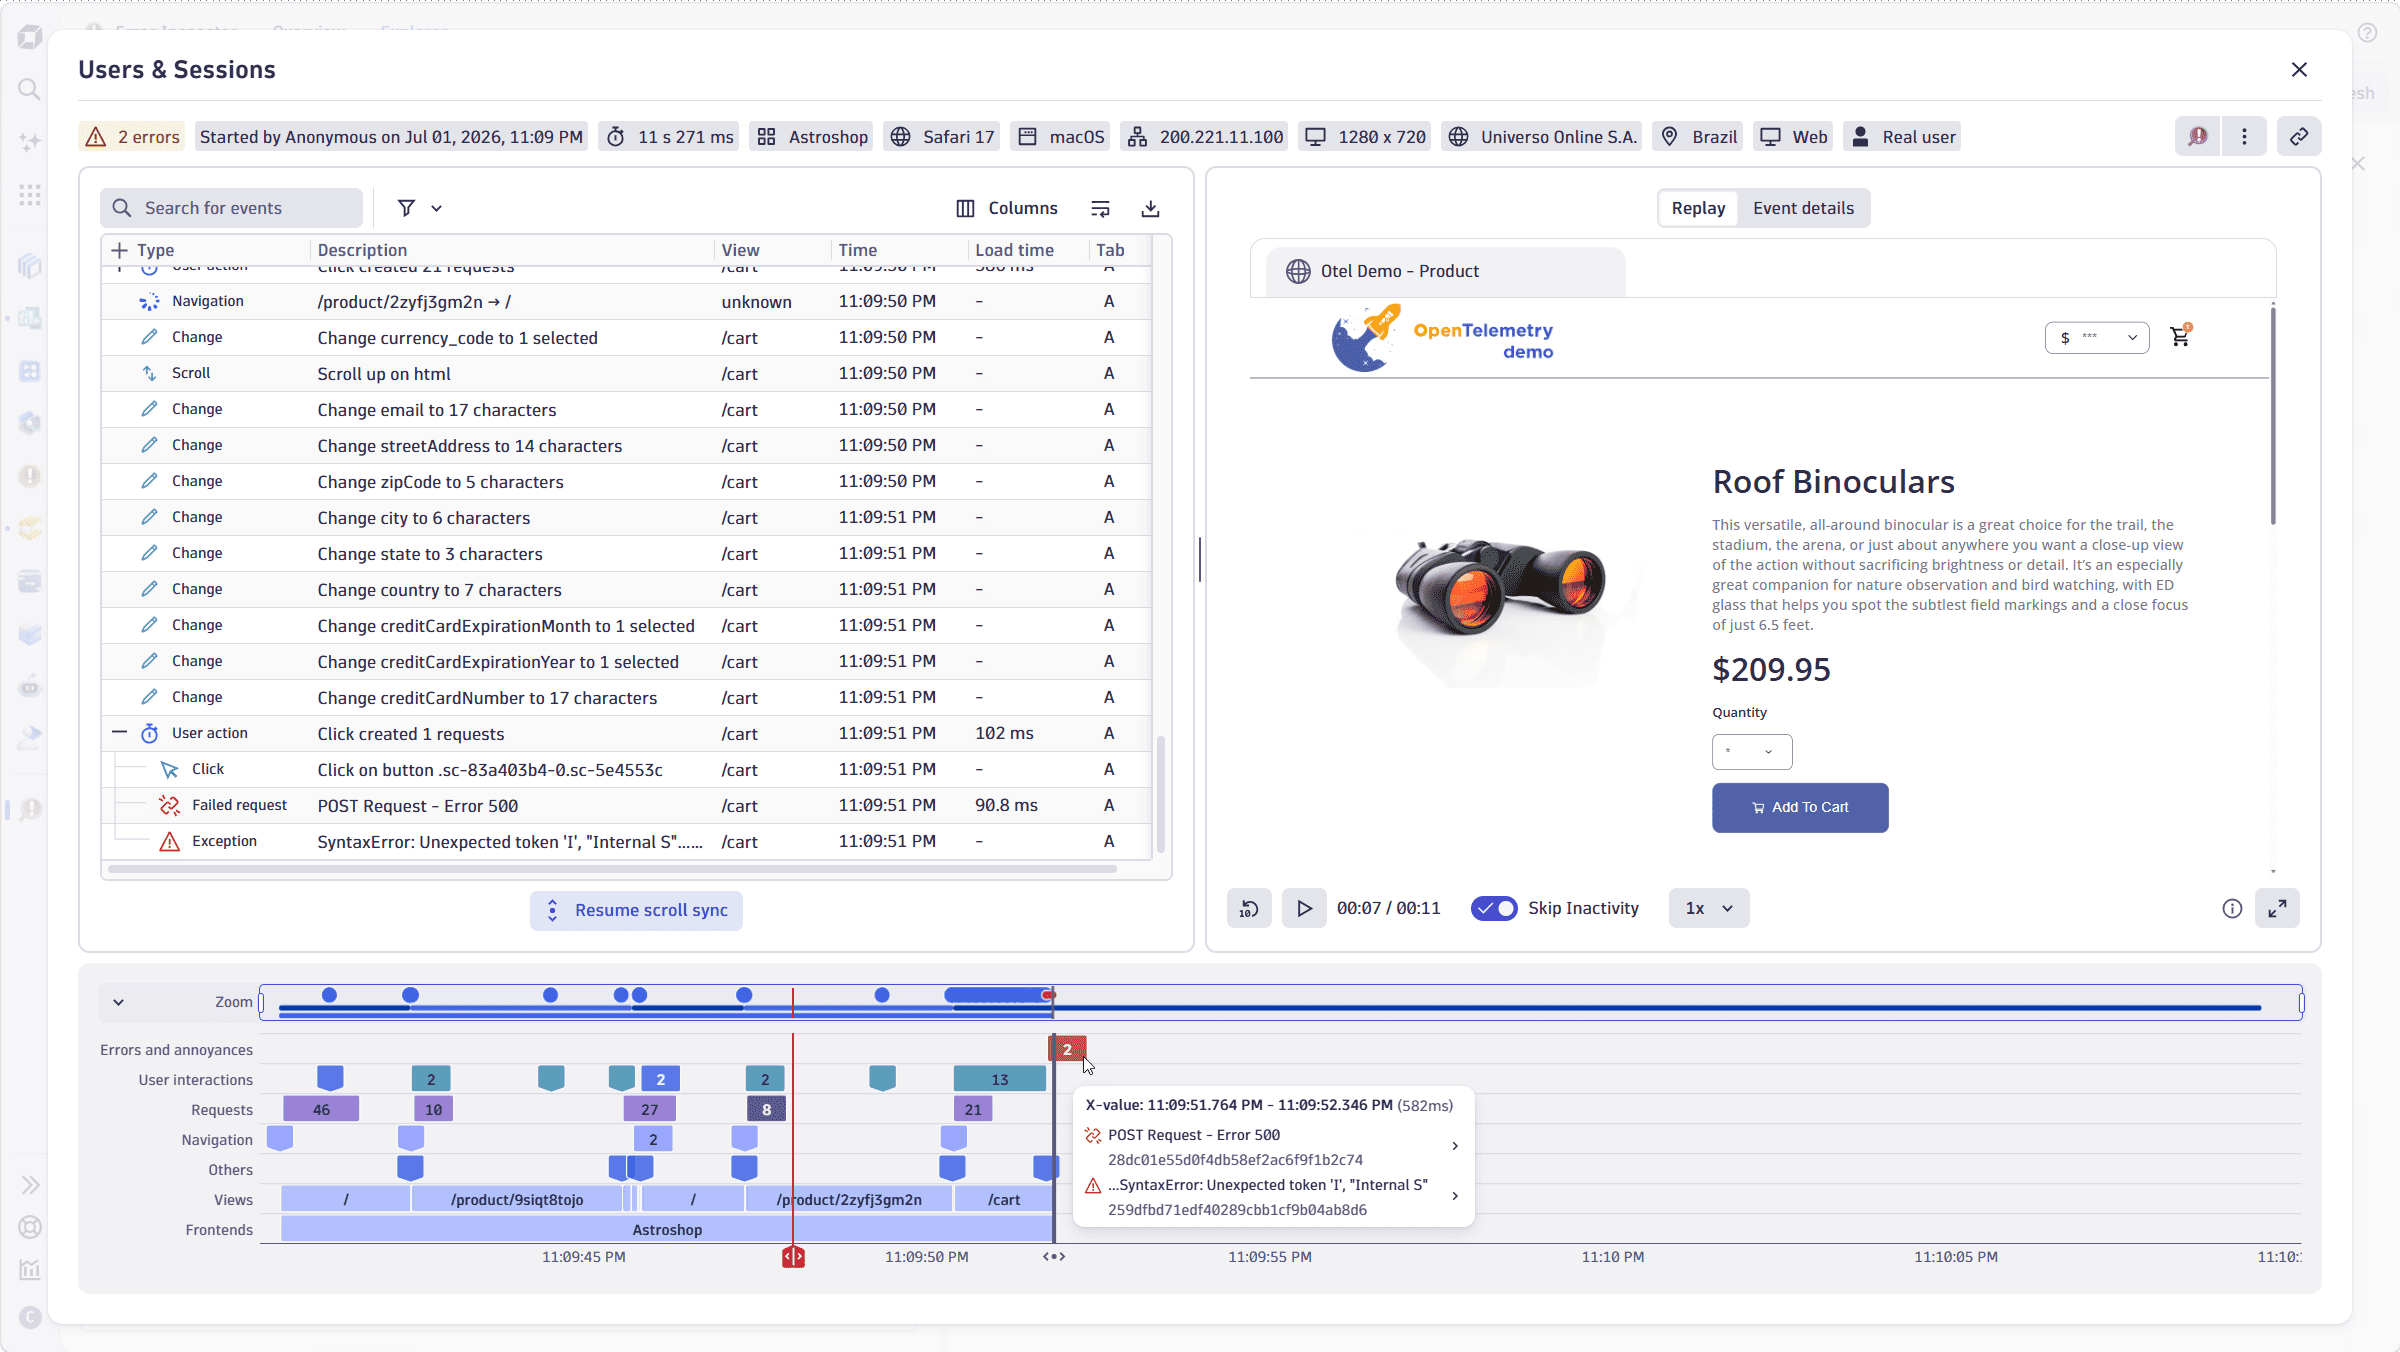
Video player view—Visual replay of browser sessions, including mouse movements, clicks, scrolls, and form interactions, with a chronological event timeline that auto-scrolls alongside the recording.
-
Timeline bar—Visual overlay of key events (errors, user actions, resource loads) at exact timestamps, so you can jump directly to what matters.
-
Session filtering and raw event access—Filter sessions and expand any event to access the underlying raw telemetry.
-
Extended retention (Preview)—Enables long-term session history for fraud detection, compliance, and customer complaint resolution.
-
Multi-platform support—Available for web (browser), iOS, and Android applications.
Session Replay must be configured and enabled per frontend, and requires explicit user permissions. Privacy masking settings are automatically inherited from Session Replay Classic, which ensures the same level of data protection without additional configuration. The classic and latest experience can run in parallel during migration at no additional cost.
For details, check the Session Replay documentation.
Feature updates
Account Management
Stability improvement for OAuth client refresh access tokens and central account management API
To improve service availability, Dynatrace now throttles OAuth client access token refresh requests. Requests that exceed the rate limit within a five-minute window receive an HTTP 429 response. For more information, see IAM limits.
AI Observability
Evaluation signals and LLM-as-judge support
You can now evaluate LLM and agent quality using dt-evals, turning AI quality into an operational signal.
With dt-evals, you can:
- Run online evaluations on sampled production or recent
gen_ai.*spans from Dynatrace. - Evaluate dimensions such as relevance, faithfulness, hallucination, completeness, toxicity, bias, PII leakage, prompt injections, user frustration, and drift via LLM-as-judge providers.
- Score responses with your own LLM-as-judge provider, including OpenAI, Anthropic, Google/Vertex/Gemini, AWS Bedrock, and Azure OpenAI.
- Send structured evaluations back to
 AI Observability to query and observe trends using business events in Dynatrace or create dashboards and alerts for quality regressions.
 - Use evaluation thresholds as CI/CD or release quality gates for prompt, model, retrieval, and agent changes.
To install the CLI, run
npm install -g @dynatrace-oss/dt-evals
dt-evals is an open-source CLI that runs quality and safety evaluations on real GenAI traces in Dynatrace. To learn more, see dynatrace-oss/dt-evals on GitHub.
Application Observability
Zero-config observability in one command
Use the dtwiz CLI to auto-discover your stack and get data flowing within minutes.
- Smart setup wizard: The wizard analyzes your system and installs the right ingest method automatically.
- Supports popular technologies: Support for OpenTelemetry, Kubernetes, AWS, Azure, GCP, and Windows/Linux hosts.
- Live watch mode: Confirm data the moment it hits Dynatrace.
To get started with dtwiz CLI, open the QuickStart app in Dynatrace and add data.

Application Observability
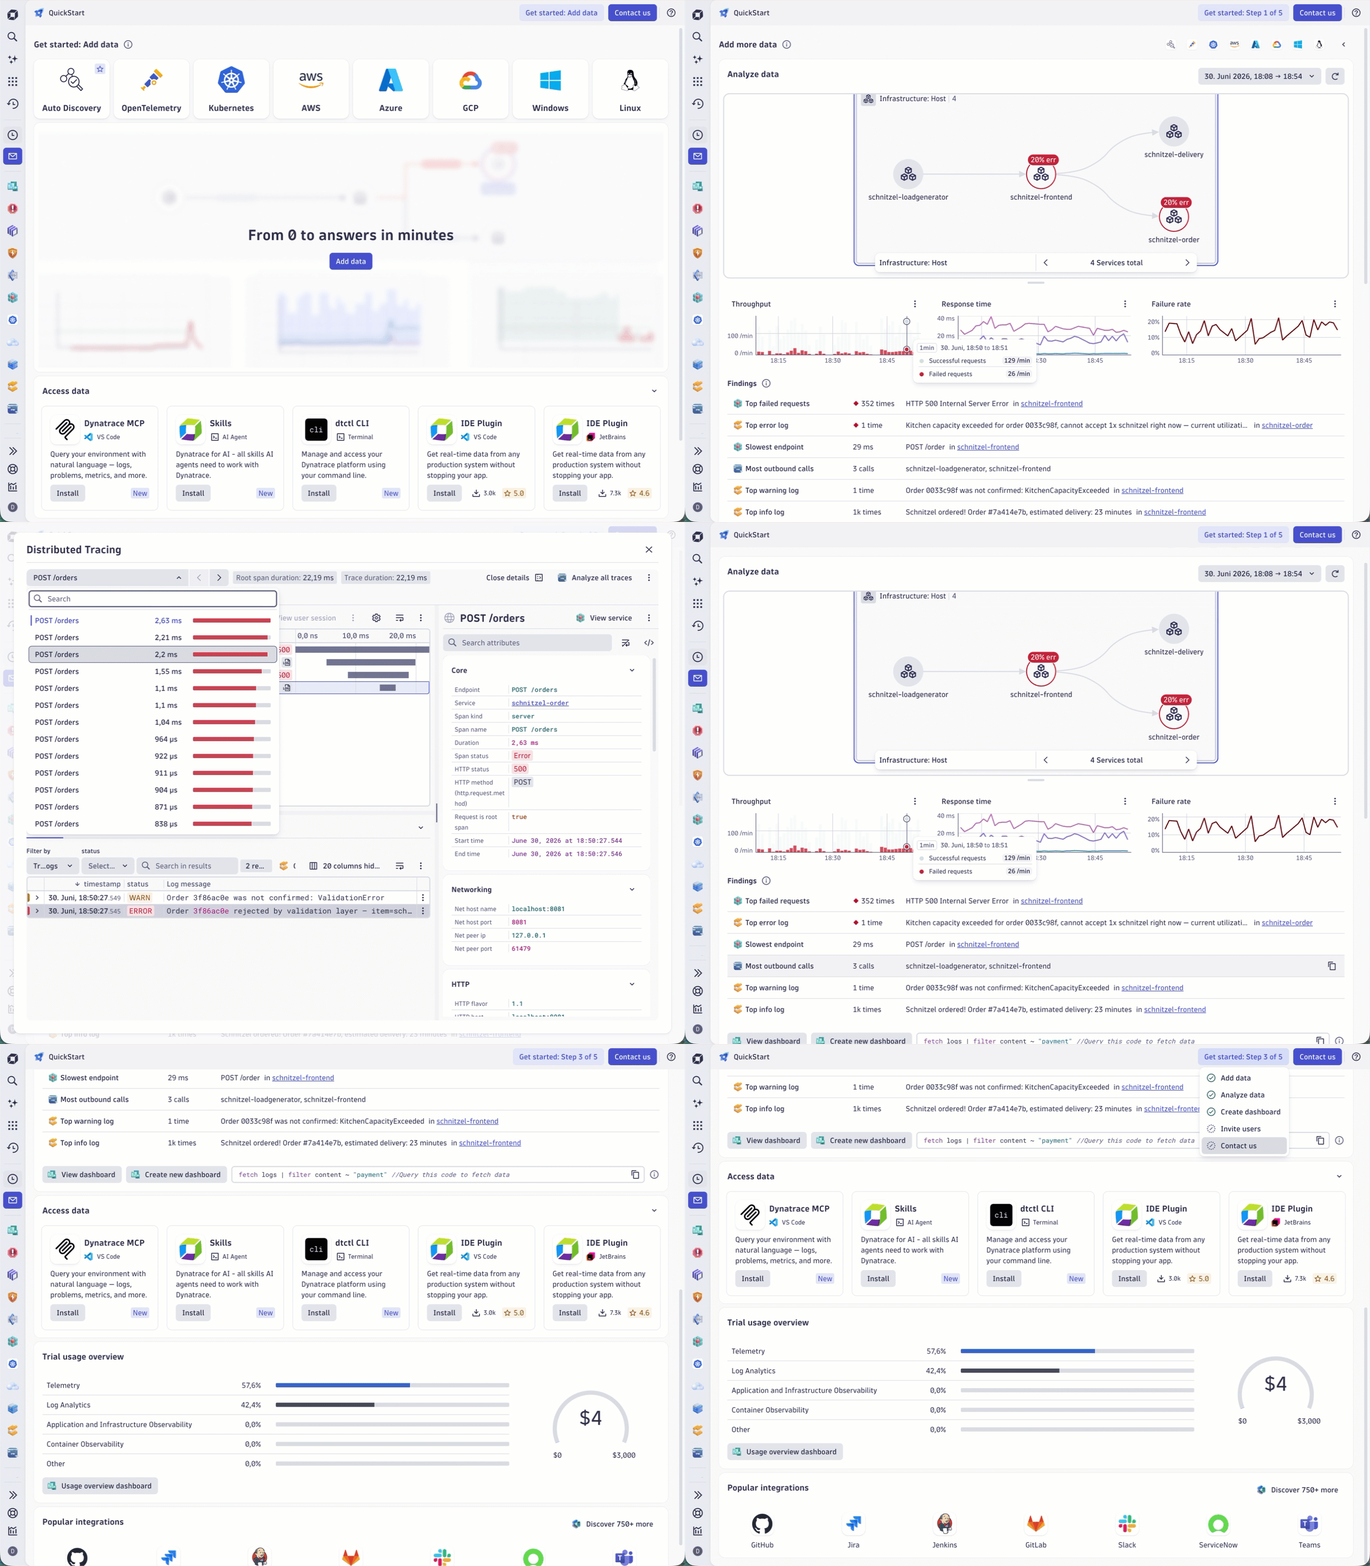
The new QuickStart app gets you from zero to answers in just minutes
The new QuickStart lets you:
- Start fast, see value instantly. With QuickStart, it's zero-config, one command, and done. In moments, connect your stack and see what matters.
- Understand your system at a glance. Visualize your full topology, drill into metrics, and jump to traces or logs with one click.
- Spot what matters most. Quickly see top errors, slowest endpoints, and highest-failure services.
Open QuickStart and eliminate your blind spots.
Application Observability | Distributed Tracing
Find any request with confidence, even in highest-volume environments
When your environment produces millions of traces, finding a specific request shouldn't be a guessing game. Now you can search for specific requests in  Distributed Tracing and reliably find them.
The list shows your most recent requests and spans matching your filter, and an indicator bar shows you exactly which timeframe the list covers, so you always know what you're looking at. You can also visualize large traces with full attribute search and see all your logs in the context of a trace.
Application Observability | Live Debugger
Advanced processing for  Live Debugger snapshots
You can now configure Live Debugger snapshot processing in OpenPipeline, with Grail access control.
Application Observability | Live Debugger
GitHub Live Debugger integration migrated to Dynatrace GitHub organization
The GitHub Live Debugger integration has been migrated to the Dynatrace GitHub organization.
Application Observability | Live Debugger
Start a debug session with Live Debugger from other Dynatrace apps
The Debug service intent now lets you start a Live Debugger session from other Dynatrace apps.
Application Observability | Log Analytics
Investigate problems directly in  Logs
Logs
Logs now provides quick access to problem details, and the context is preserved when you navigate to other apps such as  Kubernetes. You no longer need to switch to
  Problems to get essential problem information.
This helps you:
- Streamline troubleshooting. Spend less time switching between apps and more time resolving issues.
- Speed up root-cause analysis. Keep relevant problem context while inspecting logs and other observability data.
- Improve incident workflows. Maintain context when moving between Logs and other Dynatrace apps.
Application Observability | Services
Find failing endpoints across all your services
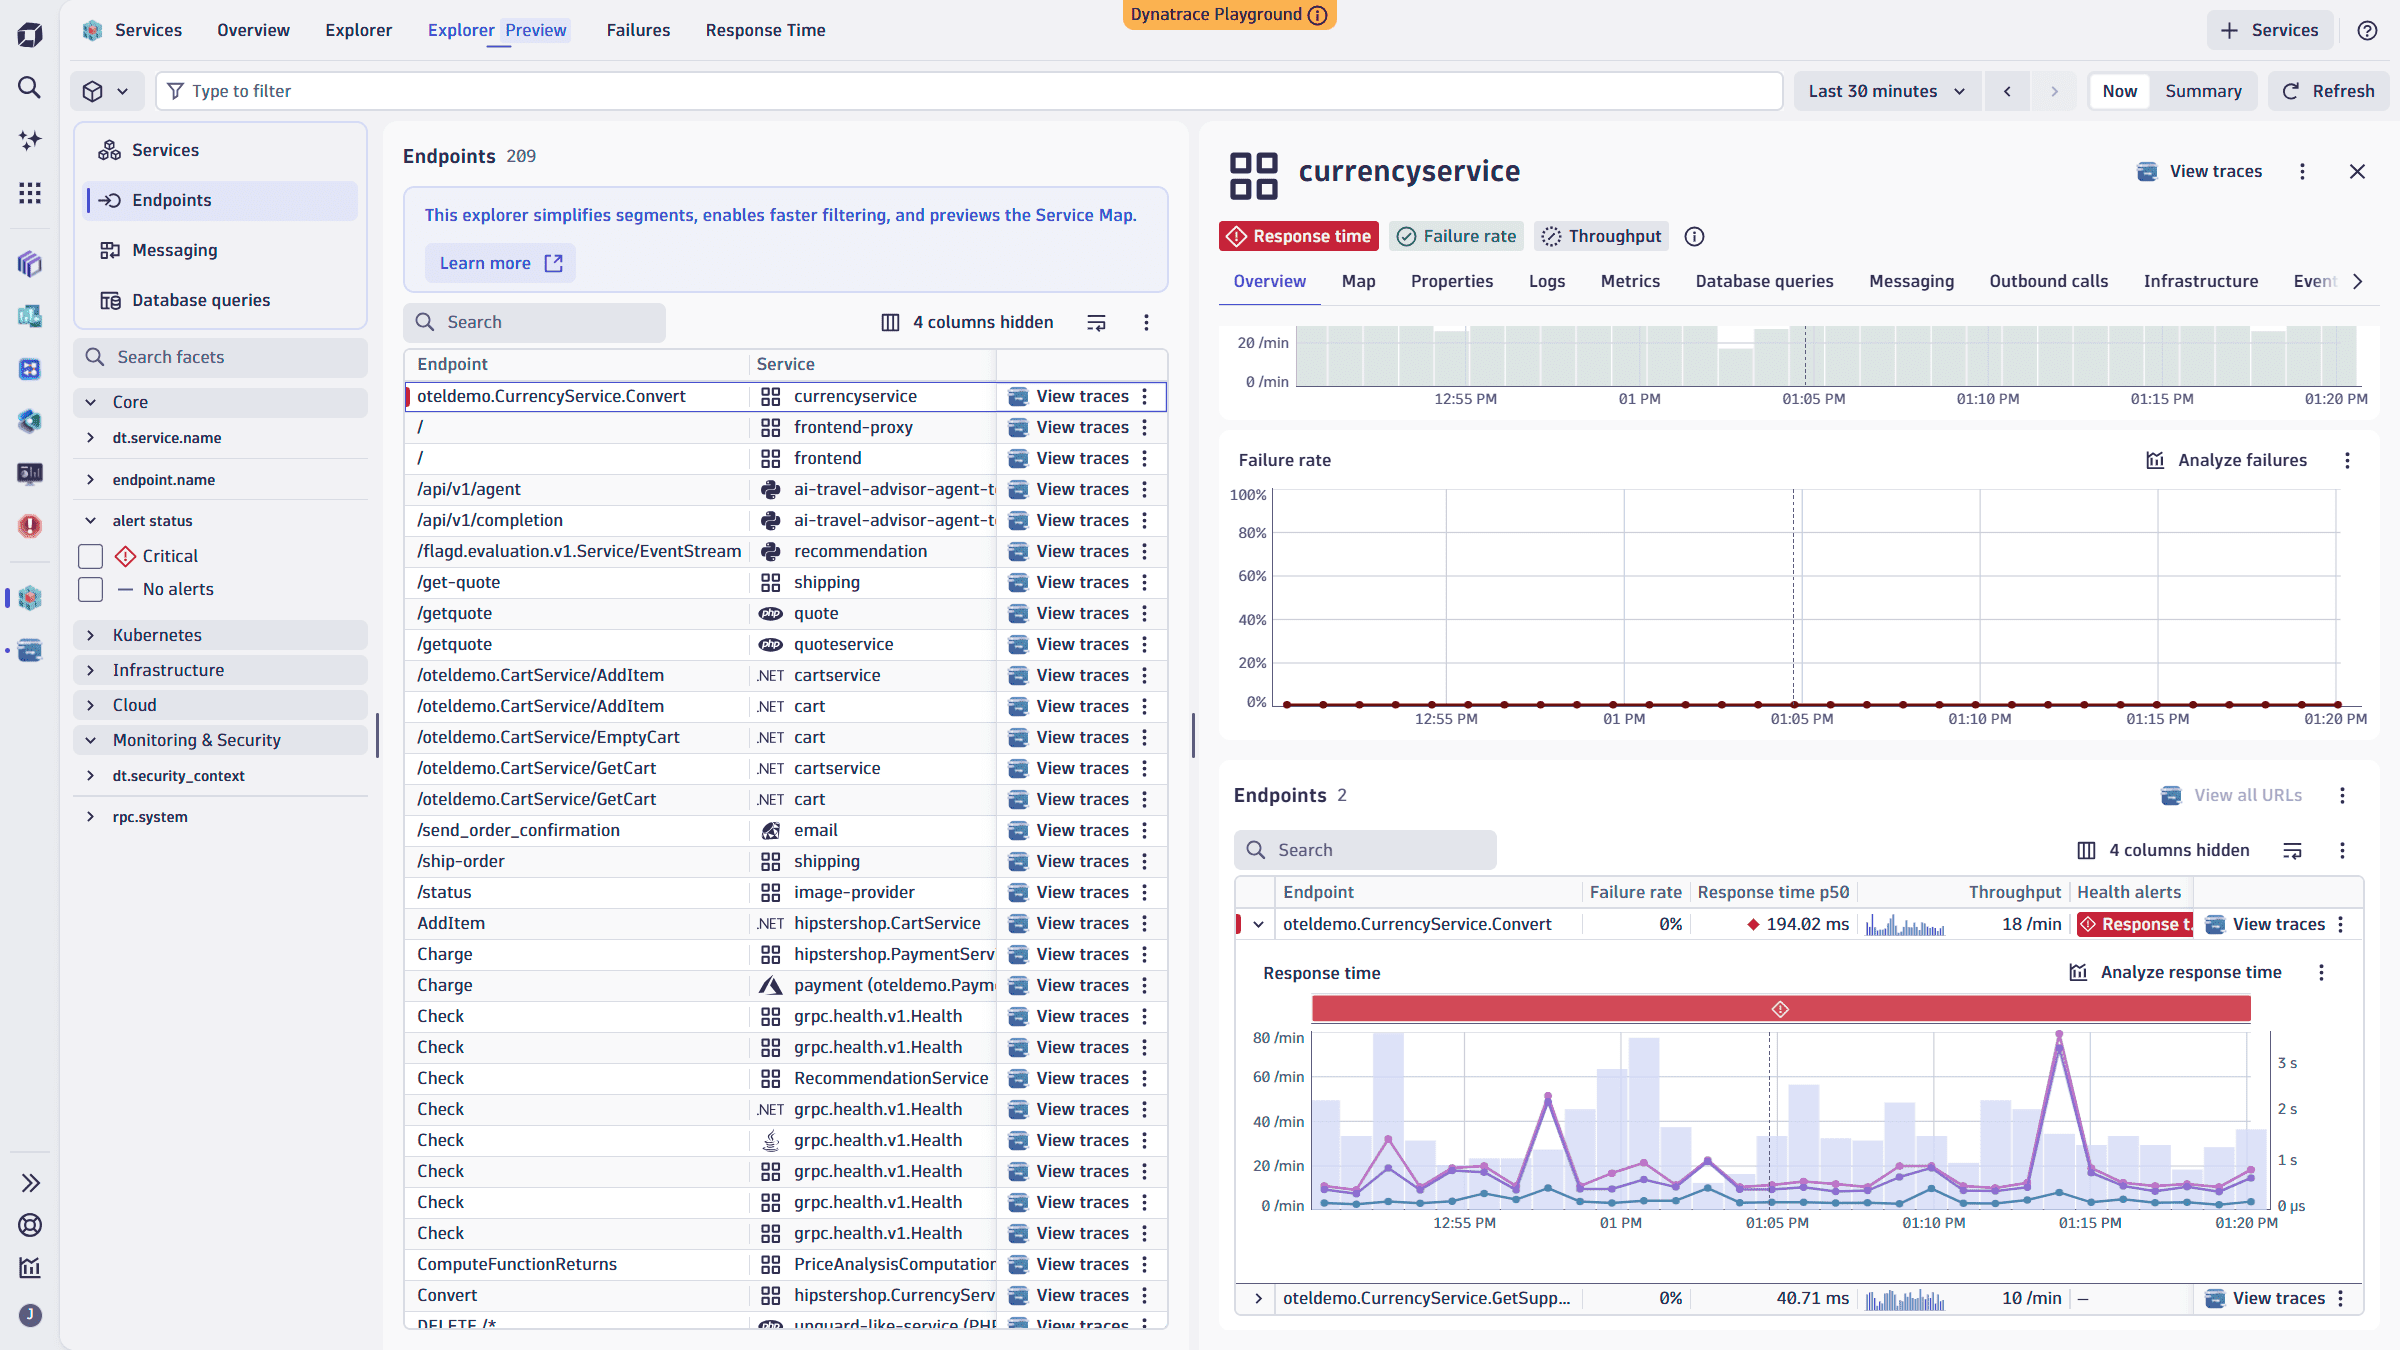
 Services now includes an Endpoints view that serves as a single inventory of all endpoints across your services, with red metrics and health indicators visible inline.
Each endpoint shows failure rate, response time, and throughput inline — no extra clicks to get the numbers that matter. When something looks off, a direct link to distributed traces takes you straight to the evidence.
Filter by cloud provider, Kubernetes cluster, HTTP status code, and more to focus on a specific part of your infrastructure.
Application Observability | Services
Service map: See every dependency, find each bottleneck
Most teams know when a service is slow. What they don't know is whether the slowdown originated in their own code, a downstream dependency, a saturated database, or a spike triggered by a specific frontend release. That gap costs hours.
The Services Map closes it. Now, frontend nodes, web and mobile, appear automatically upstream of the backend services they call. When users report a problem, you immediately see which frontend release drove the spike and which backend service absorbed the impact. The full topology—every upstream caller, every downstream dependency, every database, queue, and frontend—renders on a single interactive screen, automatically discovered from your existing OpenTelemetry or OneAgent instrumentation.
Health state propagates visually:
- A red-filled node has an active problem; a red-bordered node is impacted by one downstream, so you understand the blast radius before opening a single trace.
- Live RED metrics (error rate, response time, throughput) on every node show you which service is degraded, not just which one fired an alert.
- Database nodes (MySQL, PostgreSQL, MongoDB, Redis) and queue nodes (Kafka, RabbitMQ) are automatically created with no configuration required.
From any node, drill directly into Distributed Tracing, Logs,  Databases, or Frontends with full context preserved.
- In large or multi-team environments, a search highlights matching services in real time while keeping their dependencies visible.
- Filters by service name, Kubernetes namespace, Dynatrace segment, or metric dimension let each team scope the map to their own services—turning a company-wide topology into something immediately actionable for the team on call.
The Services Map starts rolling out on July 20th, with frontend-to-service and service-to-database dependencies following on July 27th.
Application Observability | Services
Services is now based on Smartscape unified foundation
Services is now built on service metrics and Smartscape services introduced with a new Explorer that surfaces this unified model with enhanced filtering, segment support, and a redesigned service detail experience. Use ready-made segments and filters to scope the list to the services your team owns and quickly find what matters to you. The service detail experience is consistent across every workflow, whether you arrive from an alert, a trace, or the Explorer directly.
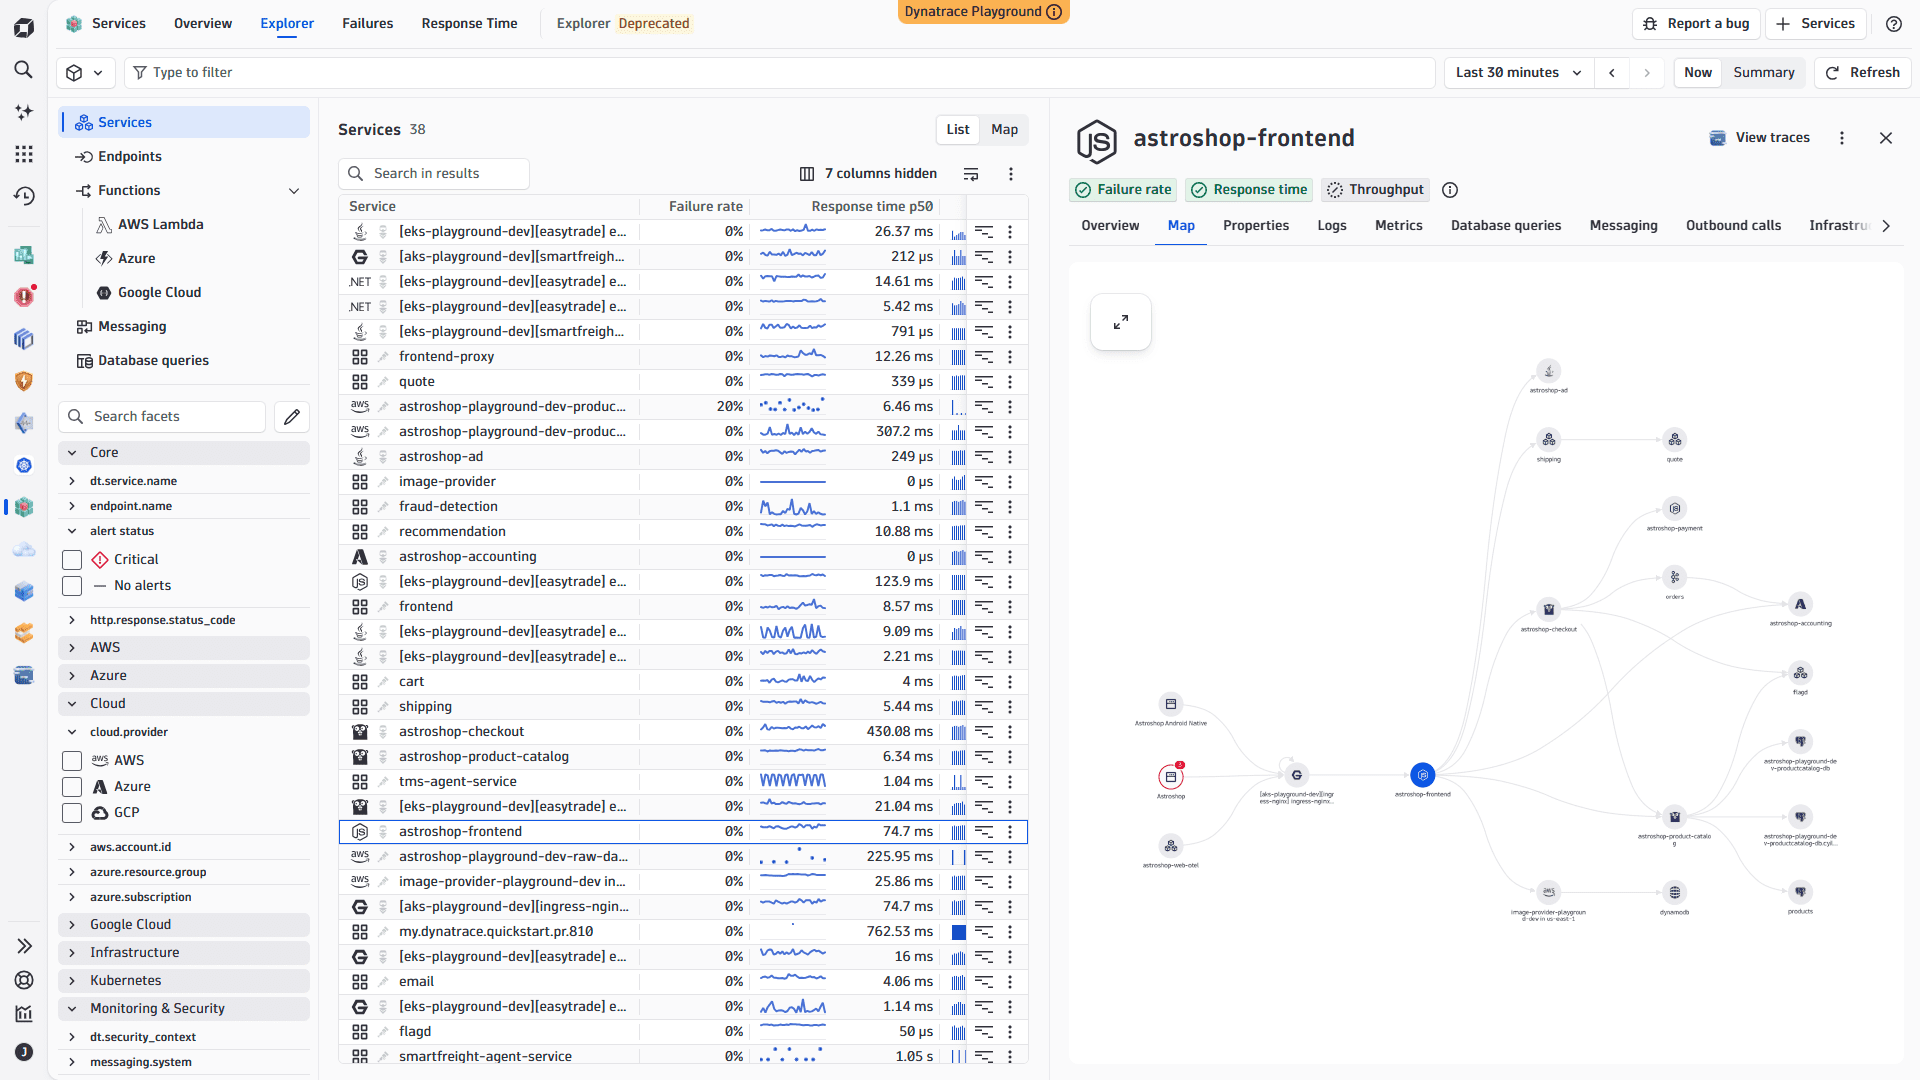
The existing Explorer remains available during the transition for teams that need to compare classic service entities with their Smartscape counterparts side-by-side.
Related highlights for Services Map and Endpoints are covered in separate release notes.
Rollout begins July 20th, when the Distributed Tracing will also switch to Smartscape-based service names.
Application Observability | Services
SDv2 for OneAgent: GA for K8s and Lambda, Early Access for generic workloads
Service Detection v2 (SDv2) brings unified, attribute-based service detection to OneAgent-monitored services.
GA release for Kubernetes and AWS Lambda services
Service Detection v2 (SDv2) is now generally available for services monitored by OneAgent on Kubernetes and AWS Lambda. SDv2 detects services using a single set of resource attribute-based rules, including built-in default rules and your own custom rules. Since SDv2 is already GA for OpenTelemetry, this release brings one unified way of detecting services across OpenTelemetry and OneAgent data sources. The same rules for service detection and naming, endpoint detection, service splitting, and failure detection now apply regardless of how your services are instrumented.
For details, see Activate SDv2 for AWS Lambda services and Activate SDv2 for Kubernetes services.
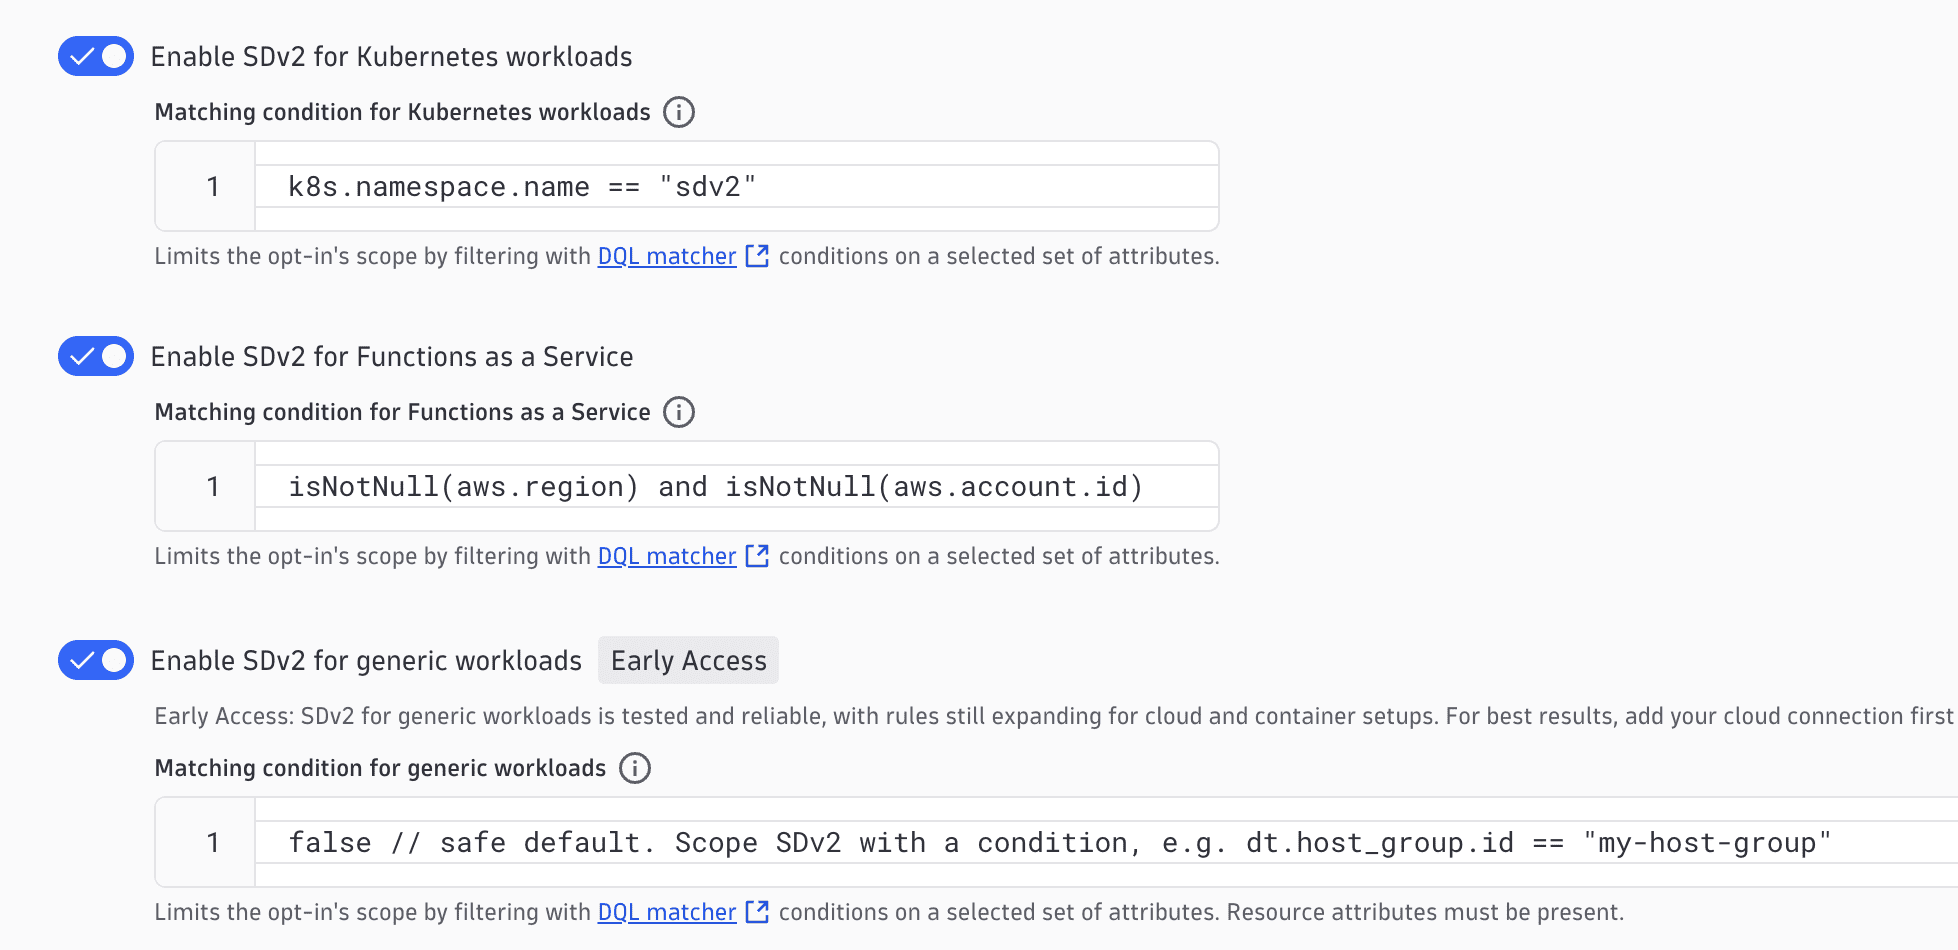
Early Access release for generic workloads
SDv2 is now available as an Early Access release for OneAgent-monitored workloads that don't run on Kubernetes or AWS Lambda, such as web servers, and processes on hosts or VMs. This extends the unified, attribute-based detection rules to your remaining OneAgent-instrumented services, completing a single consistent service detection approach across your entire environment.
You can join this Early Access release via the Service Detection v2 for OneAgent settings page. For details, see Activate SDv2 for generic workloads.
Application Observability | Services
Services automatically linked to underlying cloud compute infrastructure across AWS, Azure, and GCP
Dynatrace now automatically links services to their underlying cloud compute infrastructure across AWS, Azure, and GCP, for both OneAgent and OpenTelemetry instrumentation. This gives cloud architects and application owners a complete vertical view of their stack, from the service down to the cloud resource it runs on, without any manual configuration. The result is faster root-cause analysis and a single, consistent topology across your entire cloud-native environment.
Cost Intelligence
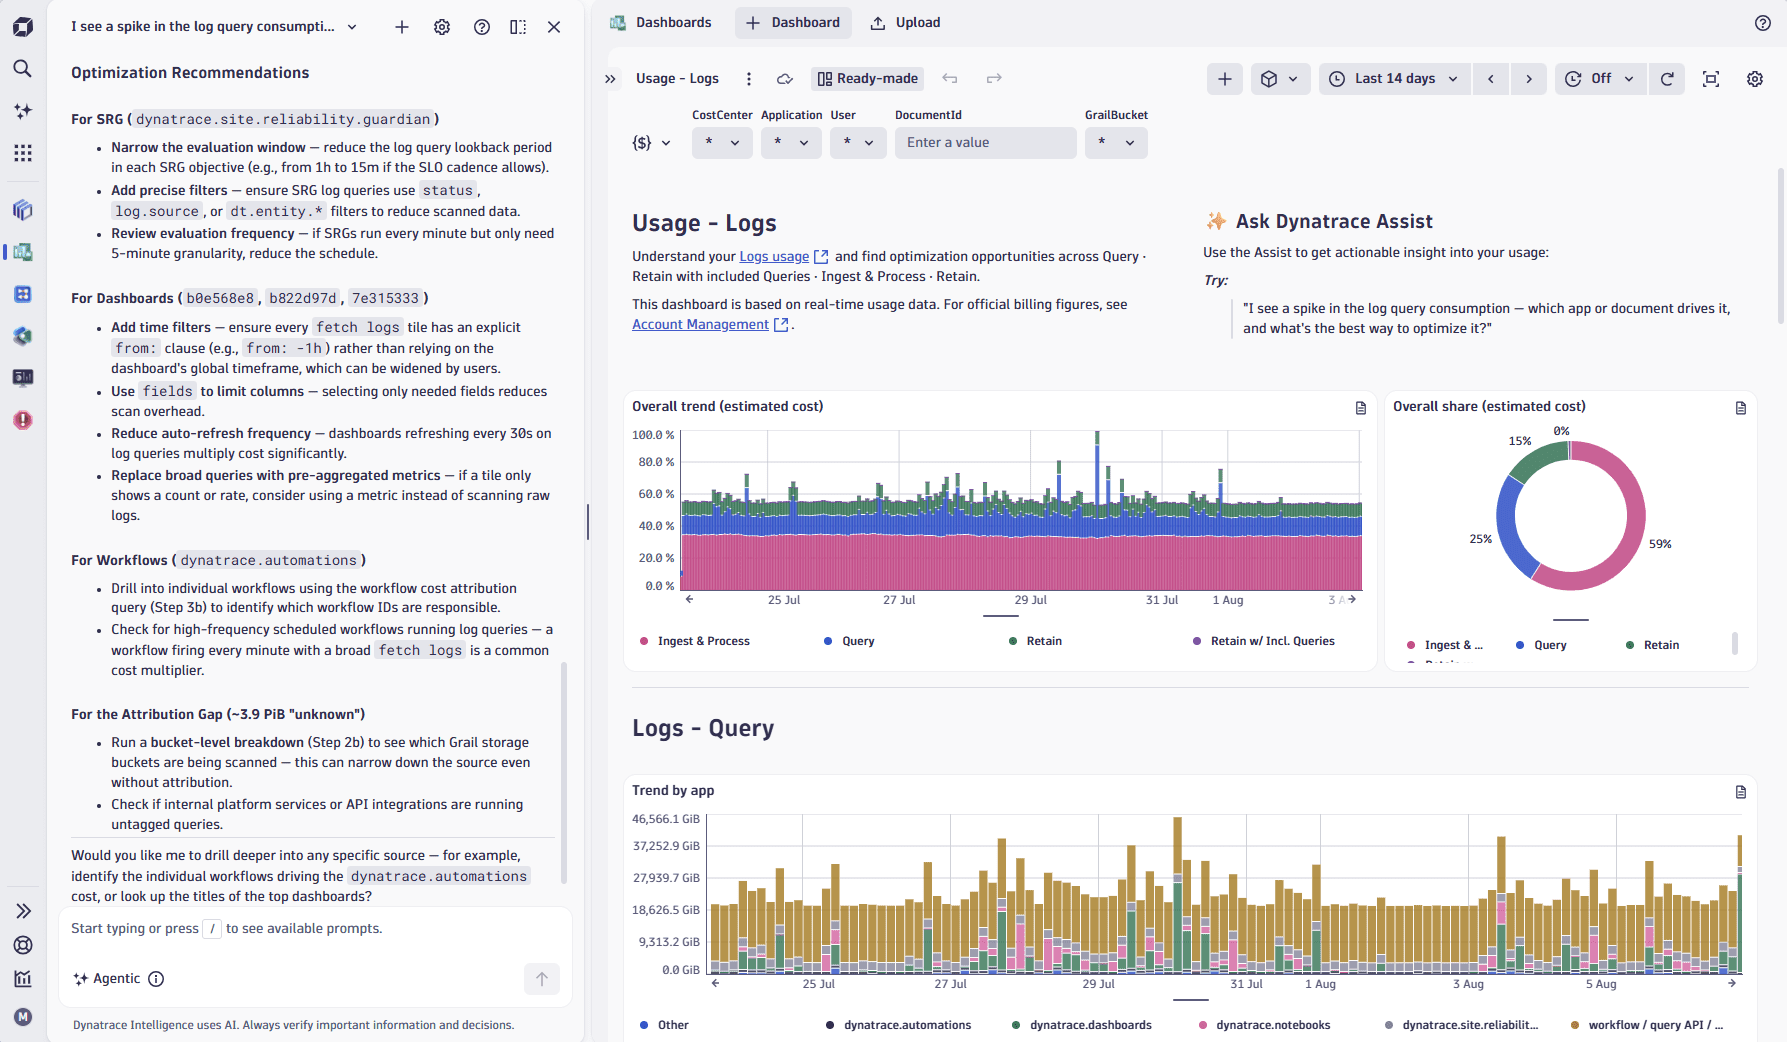
Self-service usage and cost insights dashboards
We've introduced self-service usage and cost insights dashboards that guide you from a free trial to a full deployment through a consistent experience.
If you're on a free trial, you can now see exactly how your usage maps to cost. Existing environments get actionable insights with drilldowns to quickly identify cost spikes, root causes, and the teams driving usage.
To get started:
- Open
 Dashboards in your environment.
 - Filter by Ready-made dashboards.
- Search for
usageortrialto see the available related dashboards.
Use side-by-side mode in Dynatrace Assist to get contextual intelligence alongside your usage data, turning raw consumption metrics into actionable decisions.
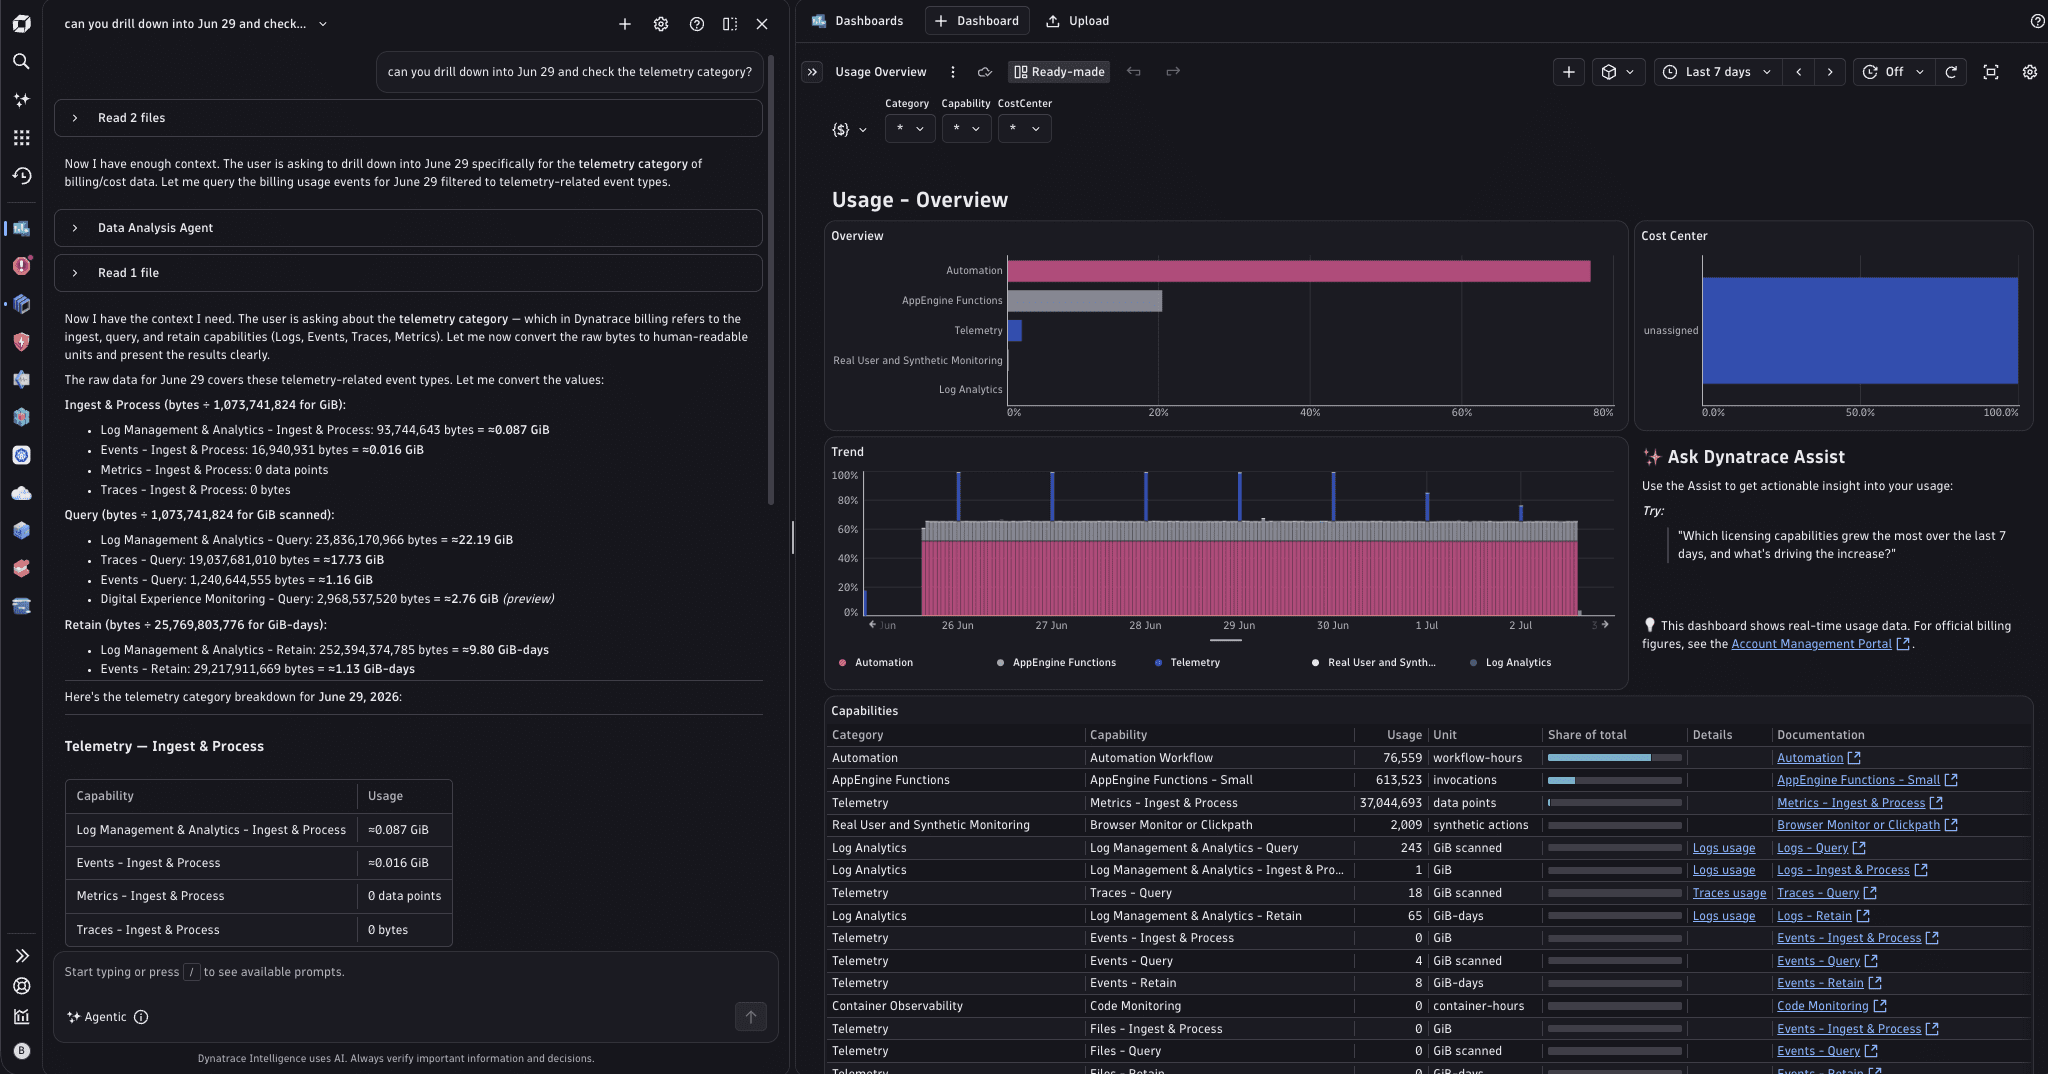
Usage - Full-Stack
The Usage - Full-Stack dashboard gives you a real-time, end-to-end view of your Full-Stack Monitoring consumption across memory (GiB-hours), metrics data points, and trace ingest—with built-in cost attribution and growth trend analysis to surface optimization opportunities.
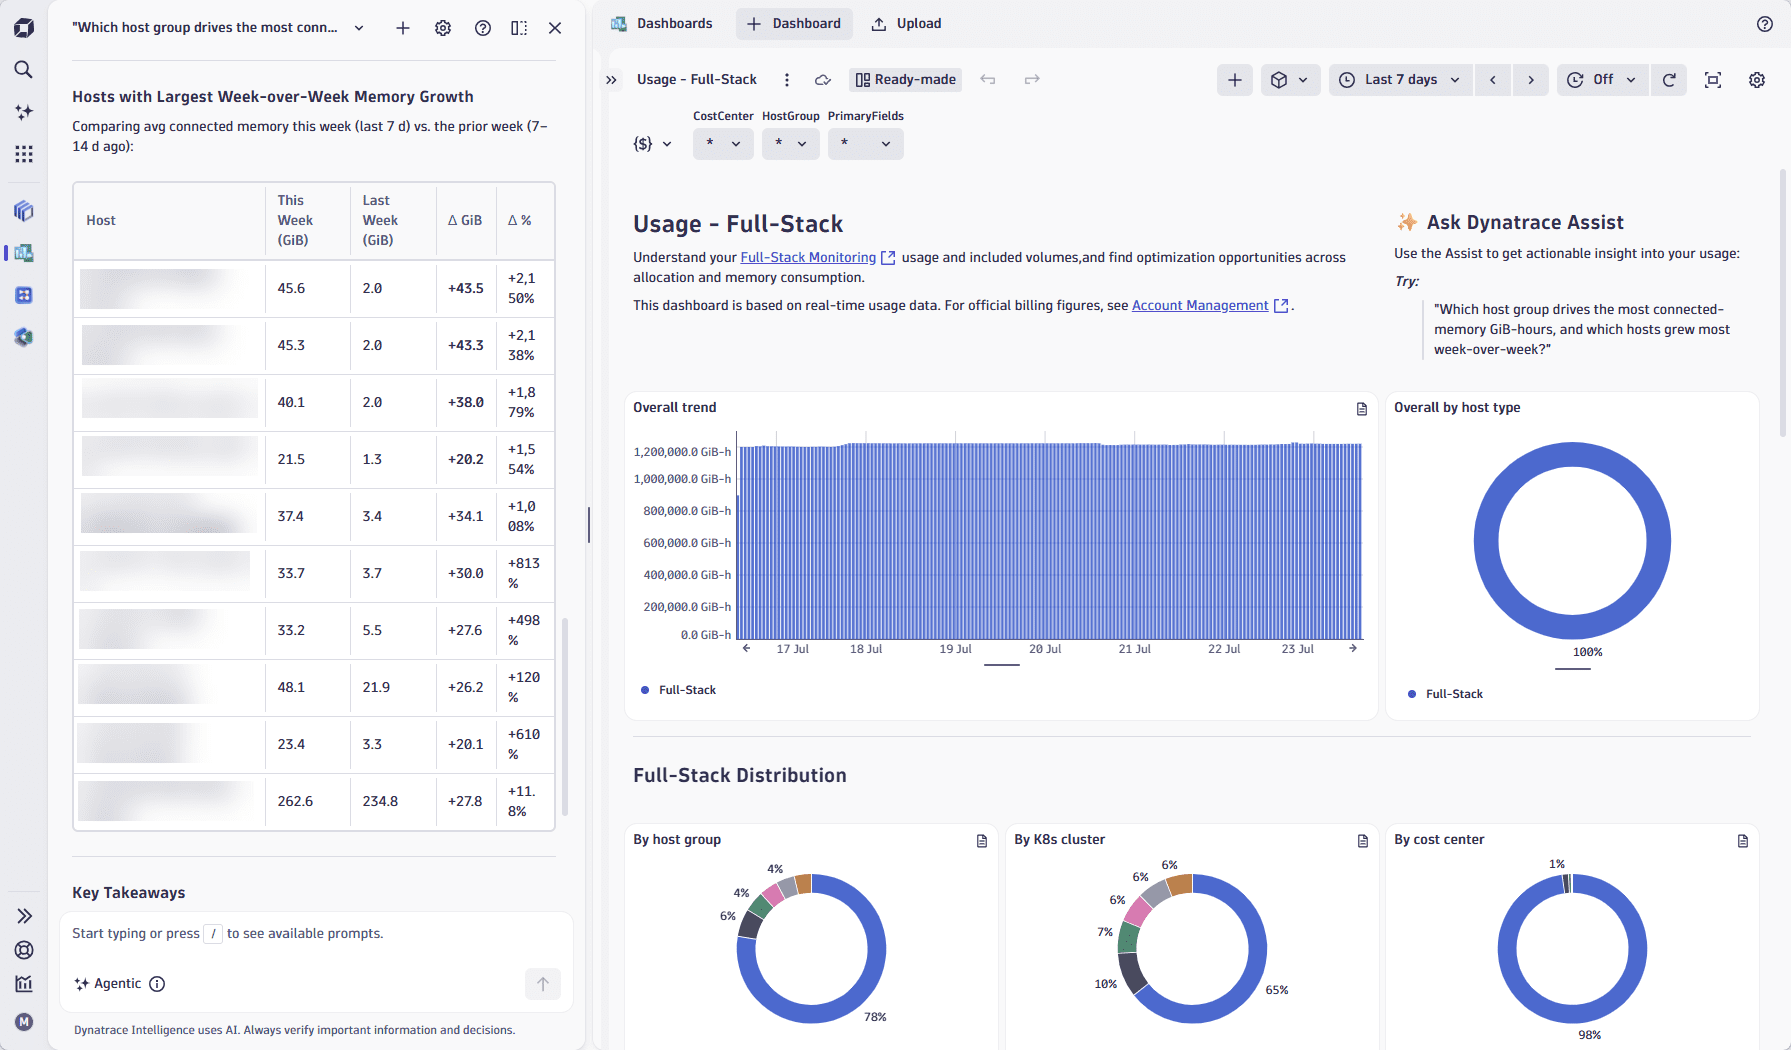
Usage - Traces
The Usage - Traces dashboard gives you a unified view of your traces billing across all three capabilities—Query, Ingest & Process, and Retain—with estimated cost attribution, growth trend analysis, and actionable query optimization guidance.
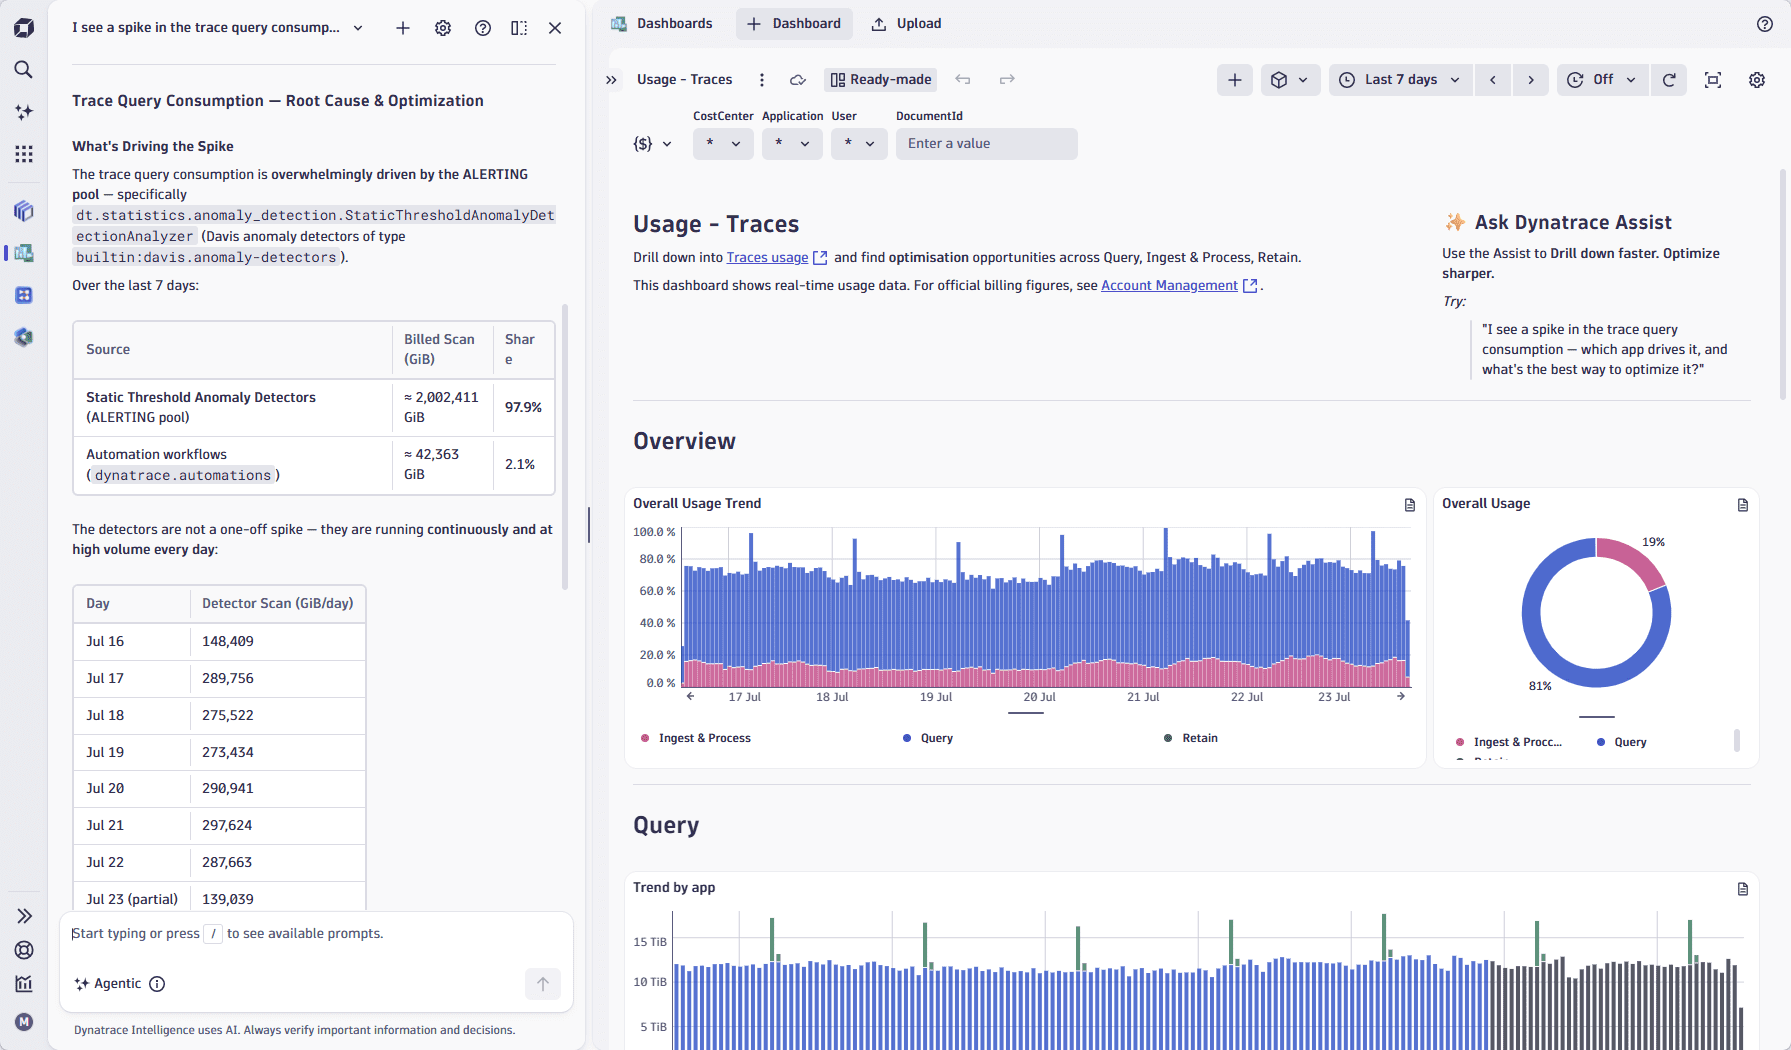
Usage - Logs
The Usage - Logs dashboard gives you a view of your Log Management & Analytics usage across Query, Ingest & Process, Retain, and Retain with Included Queries—with per-capability usage breakdowns, optimization recommendations, and consistent filters across all sections.
Digital Experience
Manage your RUM configuration in latest Dynatrace
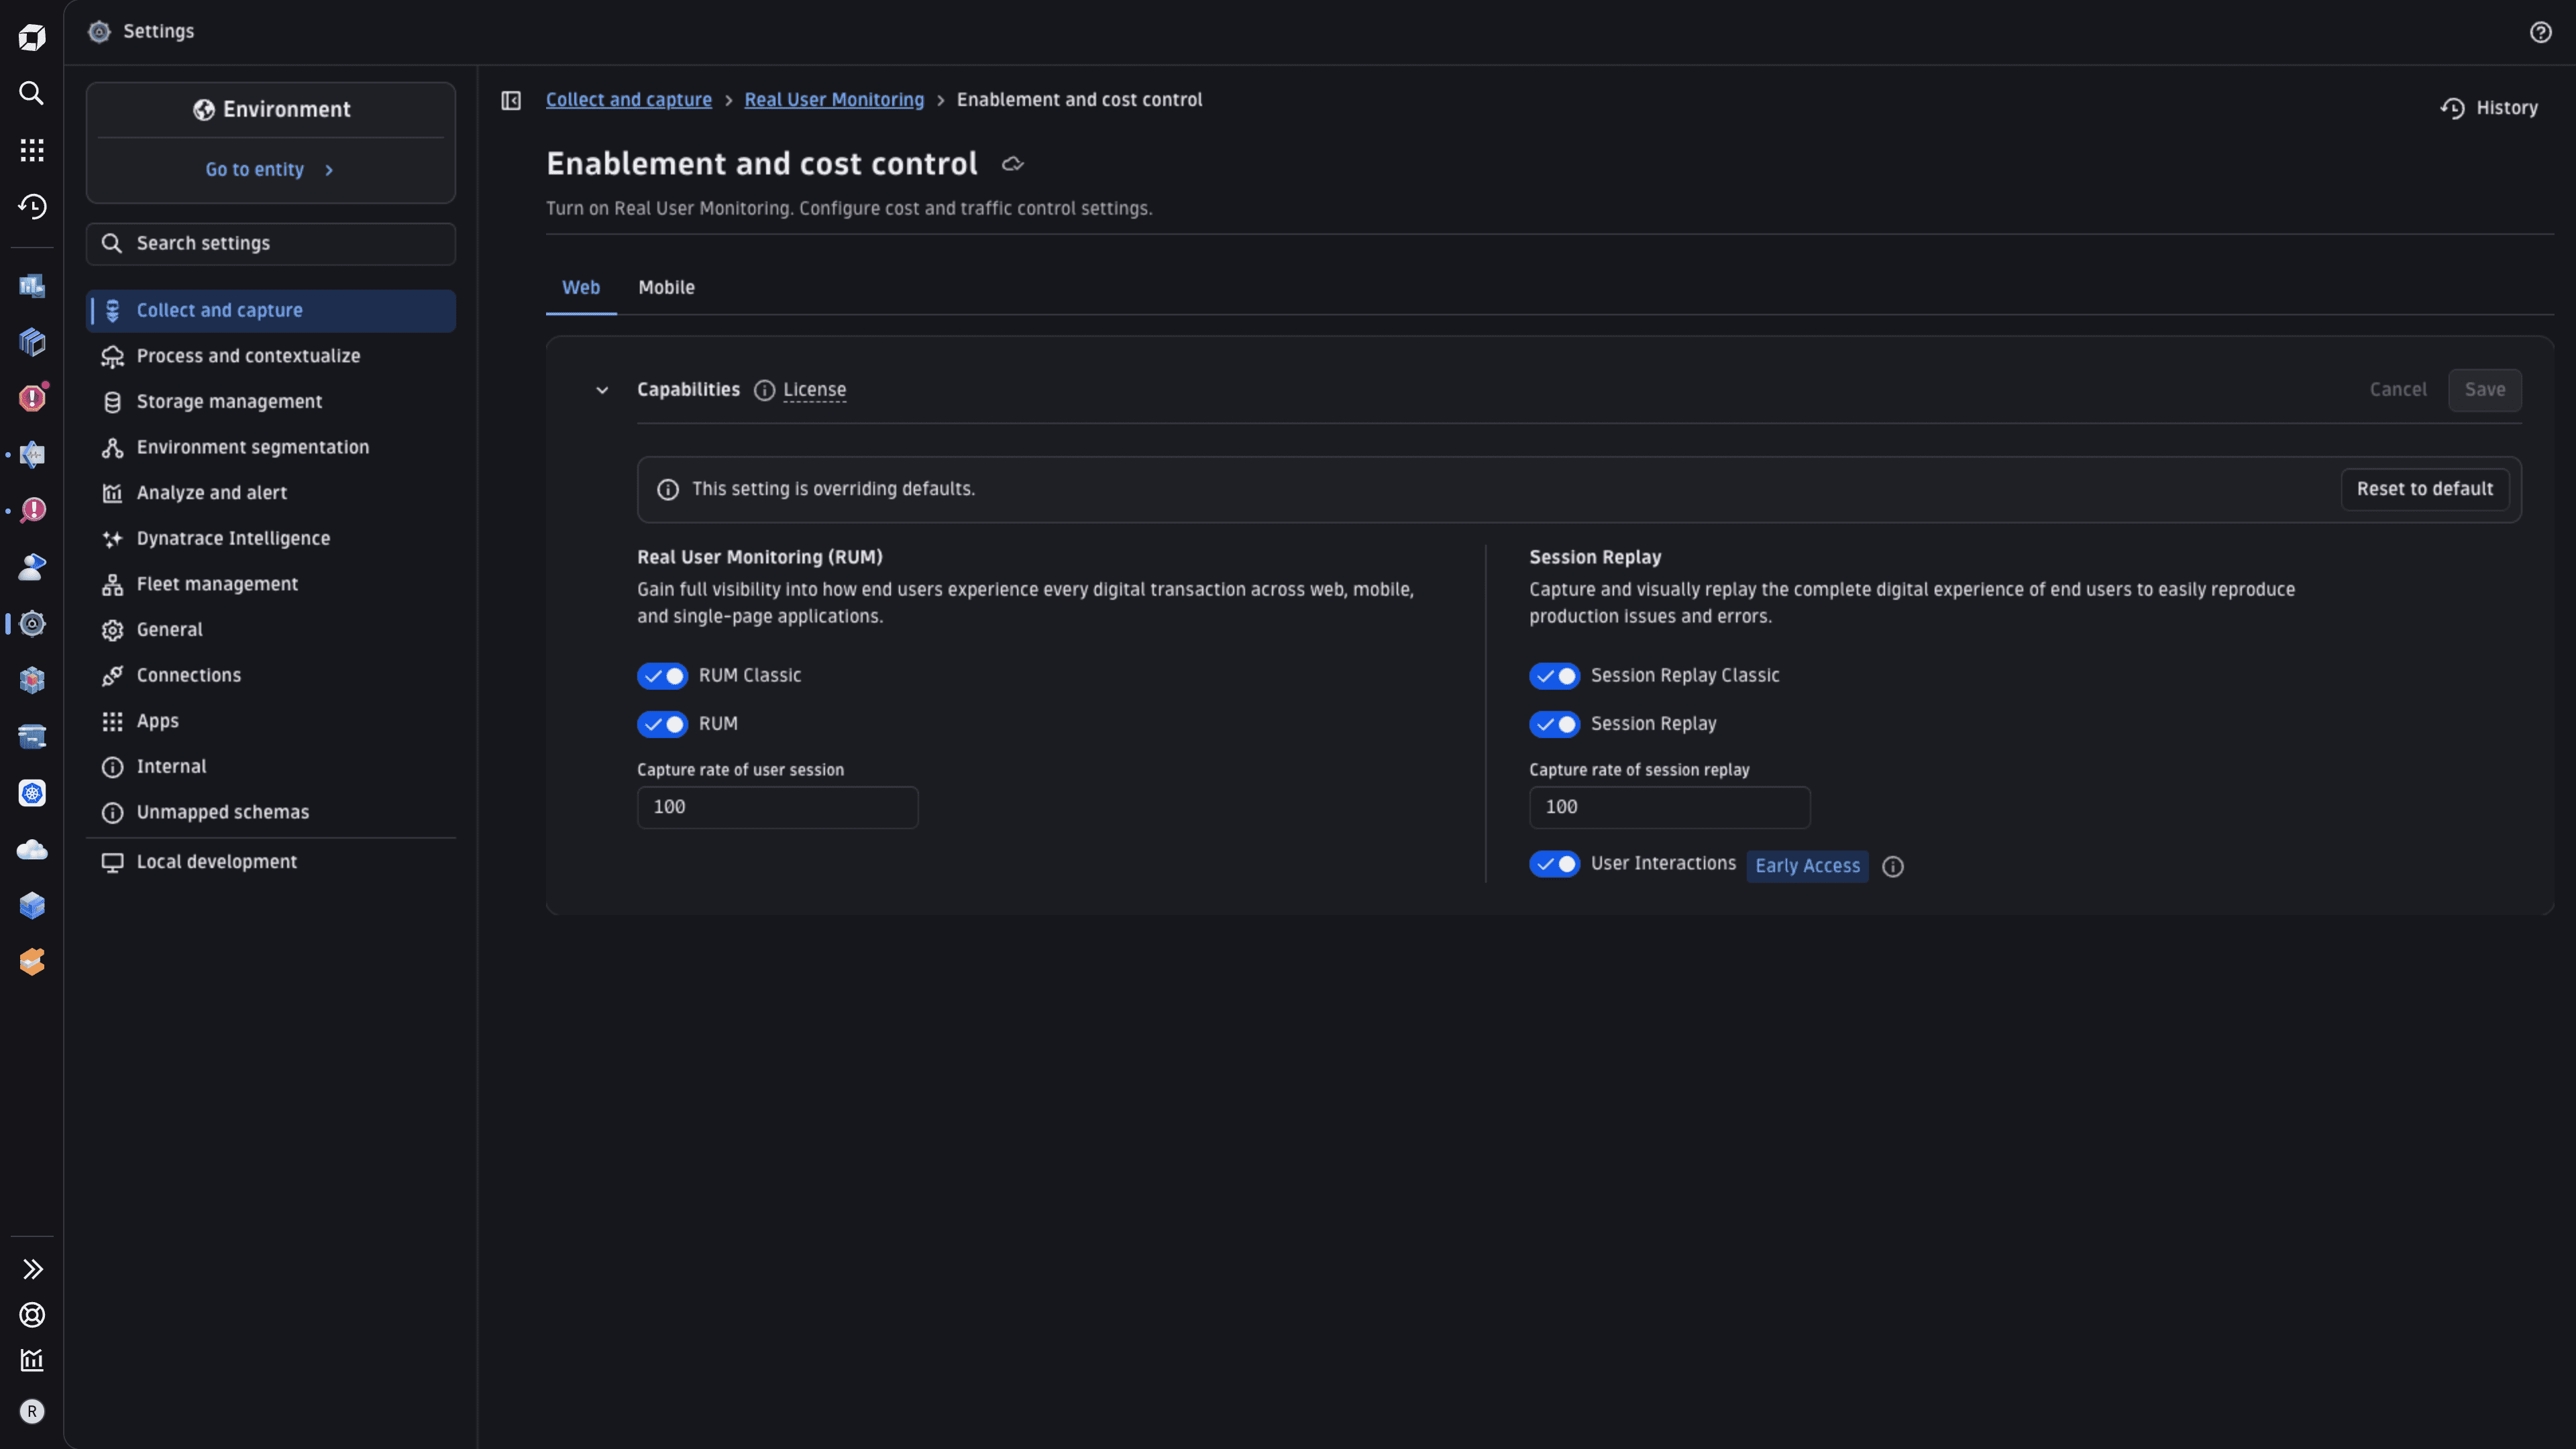
The RUM configuration for web and mobile frontends is now available in  Settings, designed so you can find and manage the settings based on your use case.
The configuration is managed at two levels:
- Environment: Defaults that apply across all web and mobile frontends in your environment.
- Frontend: Entity-specific settings that override environment defaults, applied directly to individual frontends.
The following settings are now available.
- Enablement and cost control: Enable or disable RUM, Session Replay, and user interactions, or adjust sampling rates.
- Detection: Manage frontend detection rules and host name determination at the environment level.
- General: See your frontend’s name and update its display name at the entity level.
- Instrumentation: Access the agentless or SDK setup wizard, and configure the JavaScript version, injection rules, beacon origins, or CORS settings.
- Data scope and enrichment: Manage event and session properties, browser exclusions, XHR exclusions, IP address exclusions, and resource capture settings.
- Data privacy: Configure end-user privacy, server-side masking, IP masking, and Session Replay privacy.
- Network and location: Map IP addresses to locations and configure IP determination at the environment level.
- Content resources: Define provider breakdowns and resource type classifications at the environment level.
All settings are also fully accessible via the Settings API for teams with configuration-as-code workflows.
Digital Experience
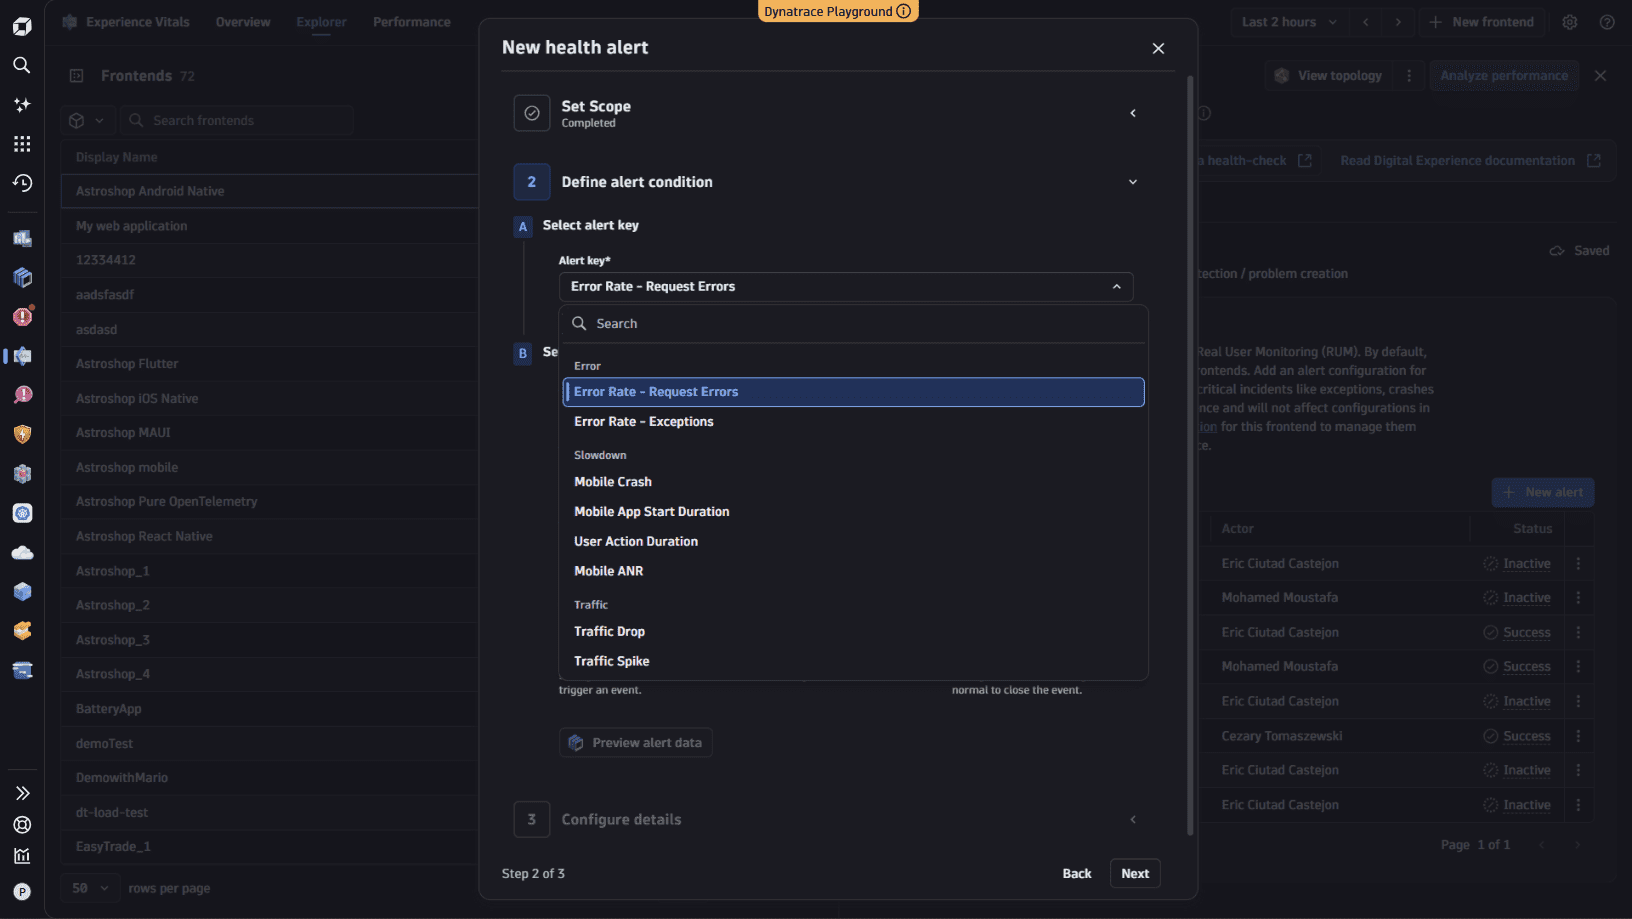
Enhanced health alerts for web and mobile
Health alerts for web and mobile provide you with:
- Better monitoring coverage. New alert types cover error-, performance-, and traffic-related anomalies, including:
- ANR-related issues on mobile.
- Slowdown of user action duration.
- Atypical traffic drops and spikes based on active session counts.
- Improved configuration experience.
- More intuitive alert creation with more context, such as timeseries preview.
- You can review and adjust health alert configurations per frontend, choosing between auto-adaptive, seasonal, or static-threshold algorithms.
- Highly scalable alerting. Teams can create up to 1,000 alert configurations per environment. Clear in-product and API feedback is provided once limits are reached, ensuring large environments with many frontends remain fully supported.
- Updated event semantics. The
frontend.name,dt.smartscape_source.id, anddt.smartscape_source.typeproperties are now automatically added to frontend health alert events.
To learn more, see the documentation.
Digital Experience
Frontends and services linked in Smartscape on Grail
We have introduced a calls edge type to link frontends and services in Smartscape on Grail. These relationships are shown in  Smartscape and can be queried with the
 smartscapeEdges command.
Digital Experience
New Symbolication and Source Map APIs
All new Symbolication and Source Map management APIs support platform tokens.
Digital Experience
New Dynatrace APIs for frontend configuration
All new Dynatrace APIs for frontend configuration support platform tokens for improved access management.
Digital Experience
New ways to capture event and session properties in RUM
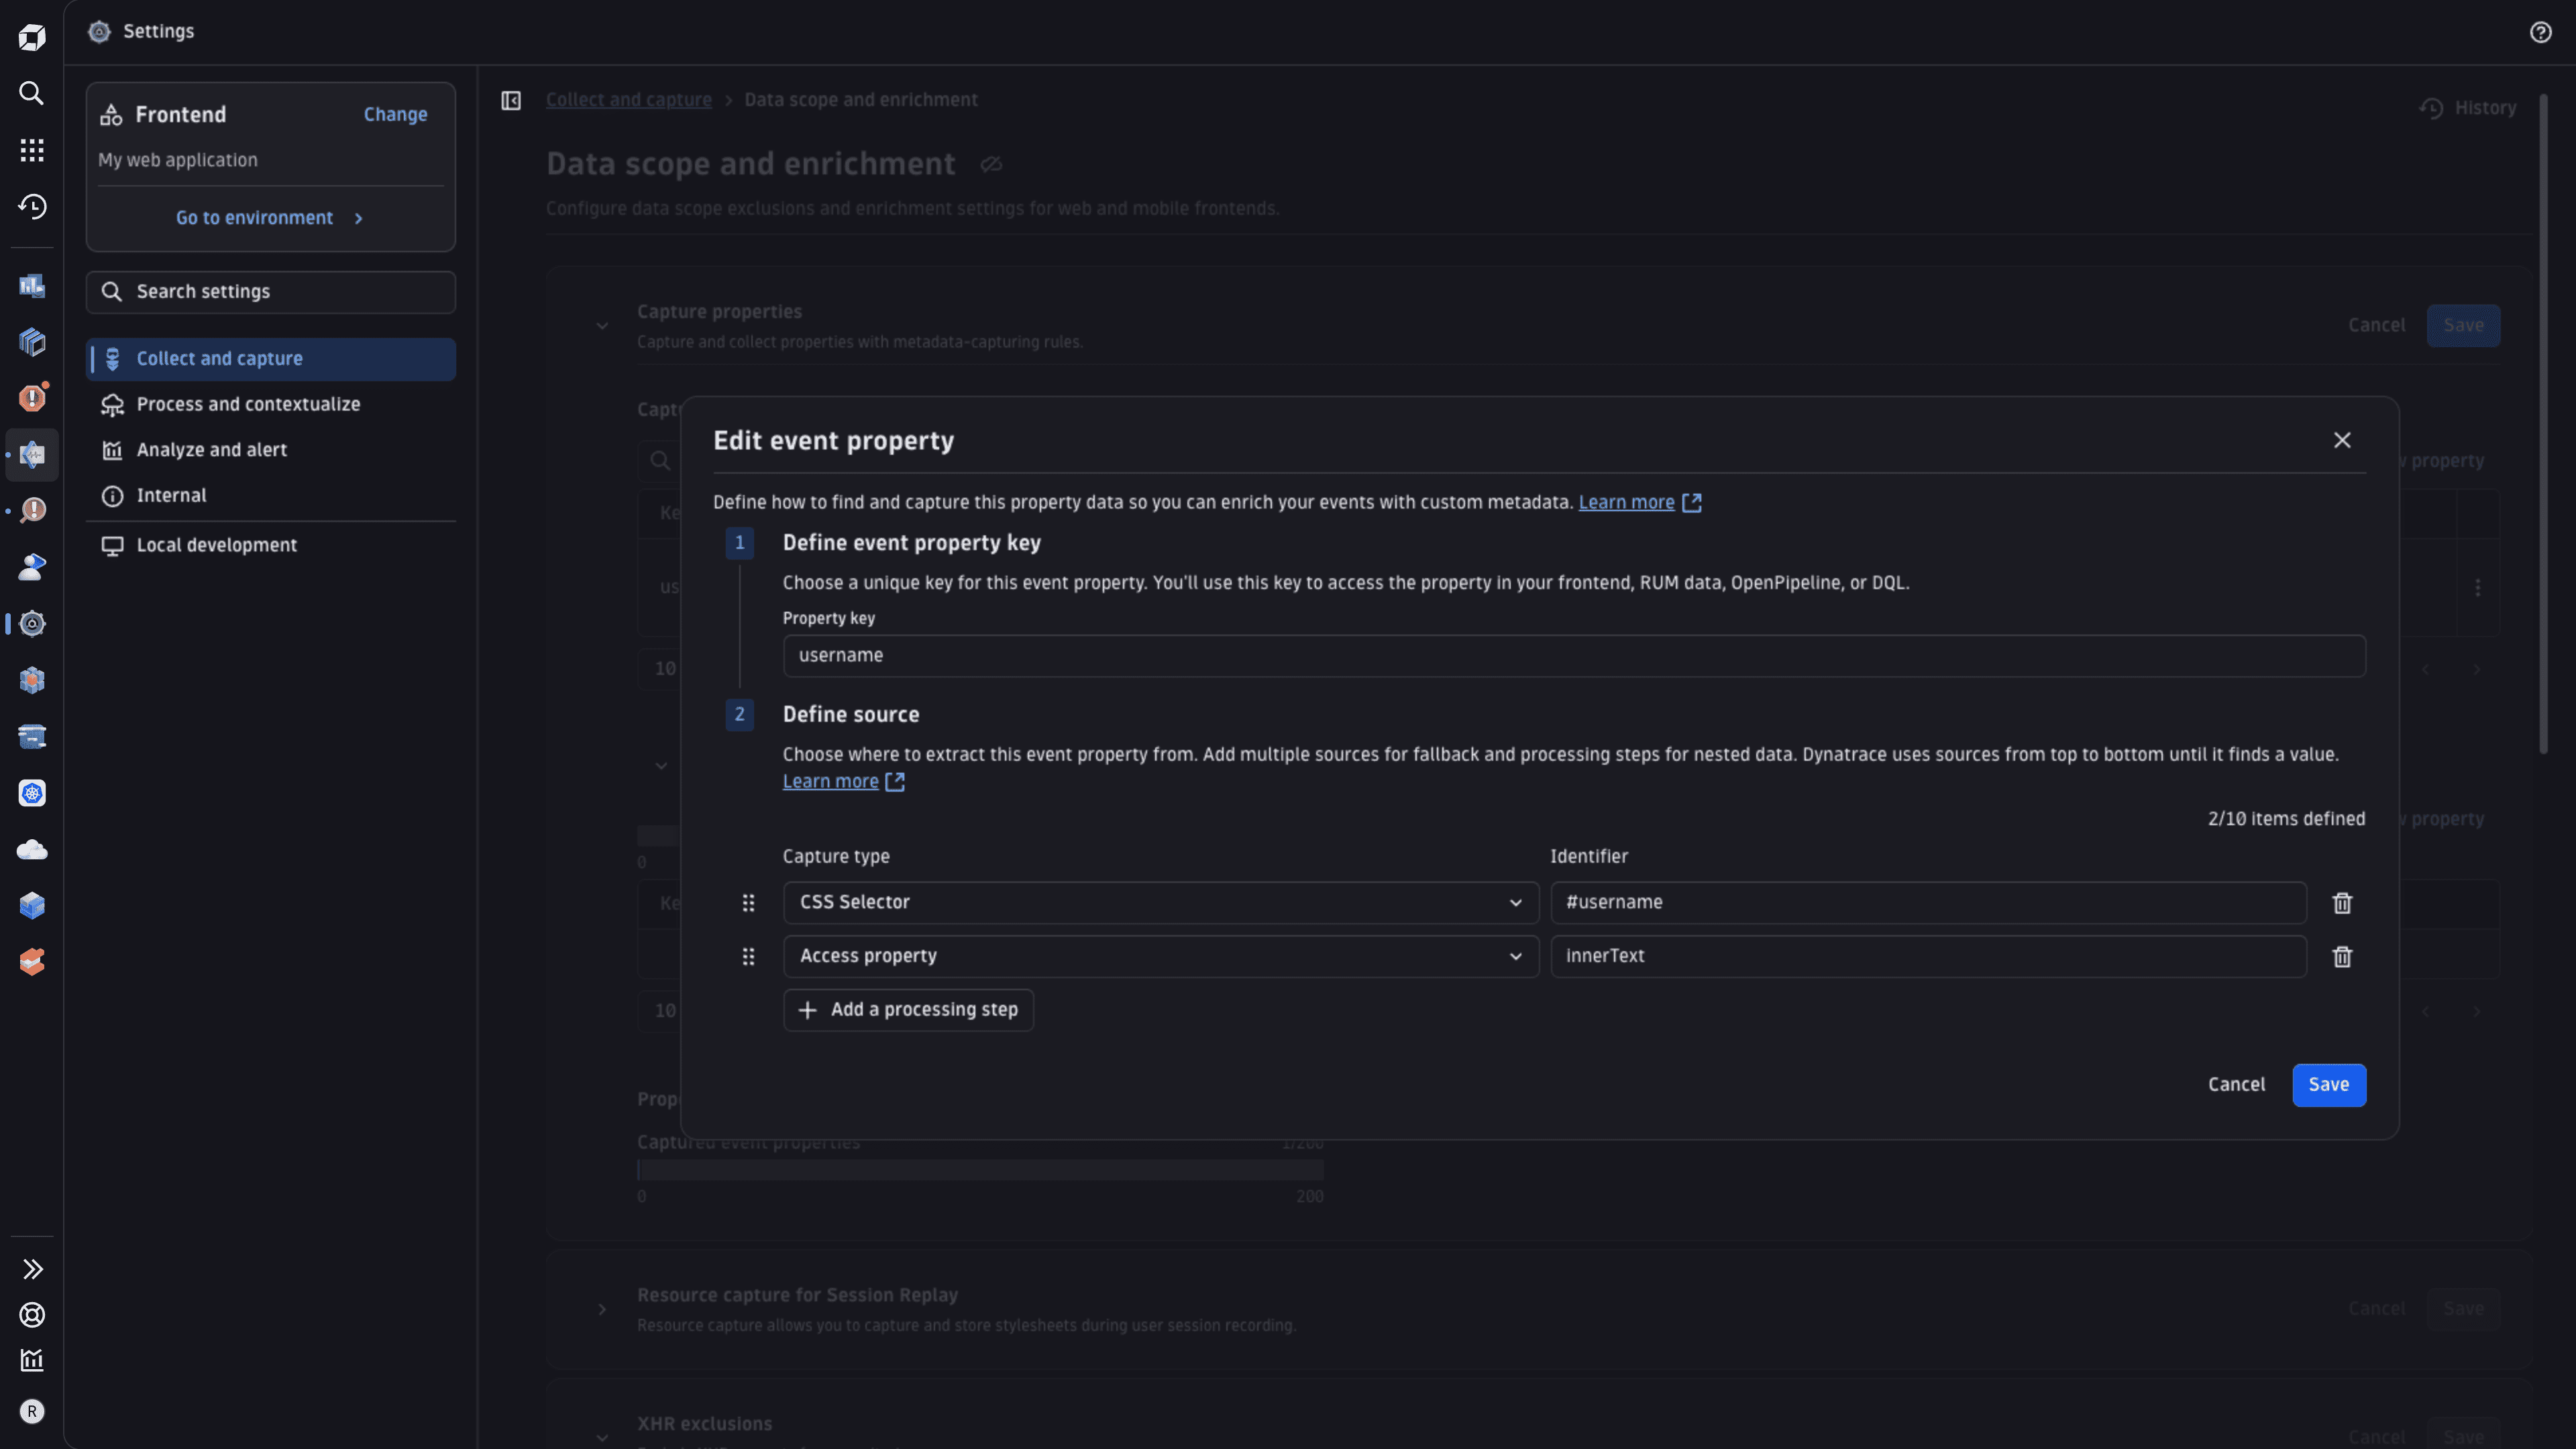
You can now capture additional context in RUM through new configuration options for event properties, session properties, and the session’s user identifier. Enriching your data with business or technical context enables analysis tailored to your needs (for example, by tagging premium users or flagging sessions with conversions).
- Event properties can be configured for web frontends through the Dynatrace UI to capture metadata from DOM elements, cookies, or JavaScript variables on the
windowobject. Capturing properties configured in the UI requires RUM JavaScript version 1.341+. - Session properties can be enriched based on the previously captured event properties in OpenPipeline. Different aggregation options control how values are rolled up to the session level: choose
FirstorLastfor all fields, and additionallyMin,Max,Sum, orAvgfor numeric fields. - The user identifier in a session can also be enriched in OpenPipeline based on captured event properties. The
Lastvalue is used for the aggregation into the session.
If you want to send this information to Dynatrace directly from your codebase instead, it can be reported through the RUM APIs for both web and mobile frontends. Configuration is backed by two new Settings API schemas: builtin:rum.web.capture-properties and builtin:rum.mobile.capture-properties.
The previous builtin:rum.web.capture-custom-properties schema is now deprecated.
Property limits have been increased to 100 captured per web frontend and 200 API-reported per web or mobile frontend. The session properties and the user identifier enriched from event properties can be used in session analysis through Users & Sessions or included in your dashboards and notebooks via DQL.
Digital Experience
Integrated end-to-end user action analysis on Grail
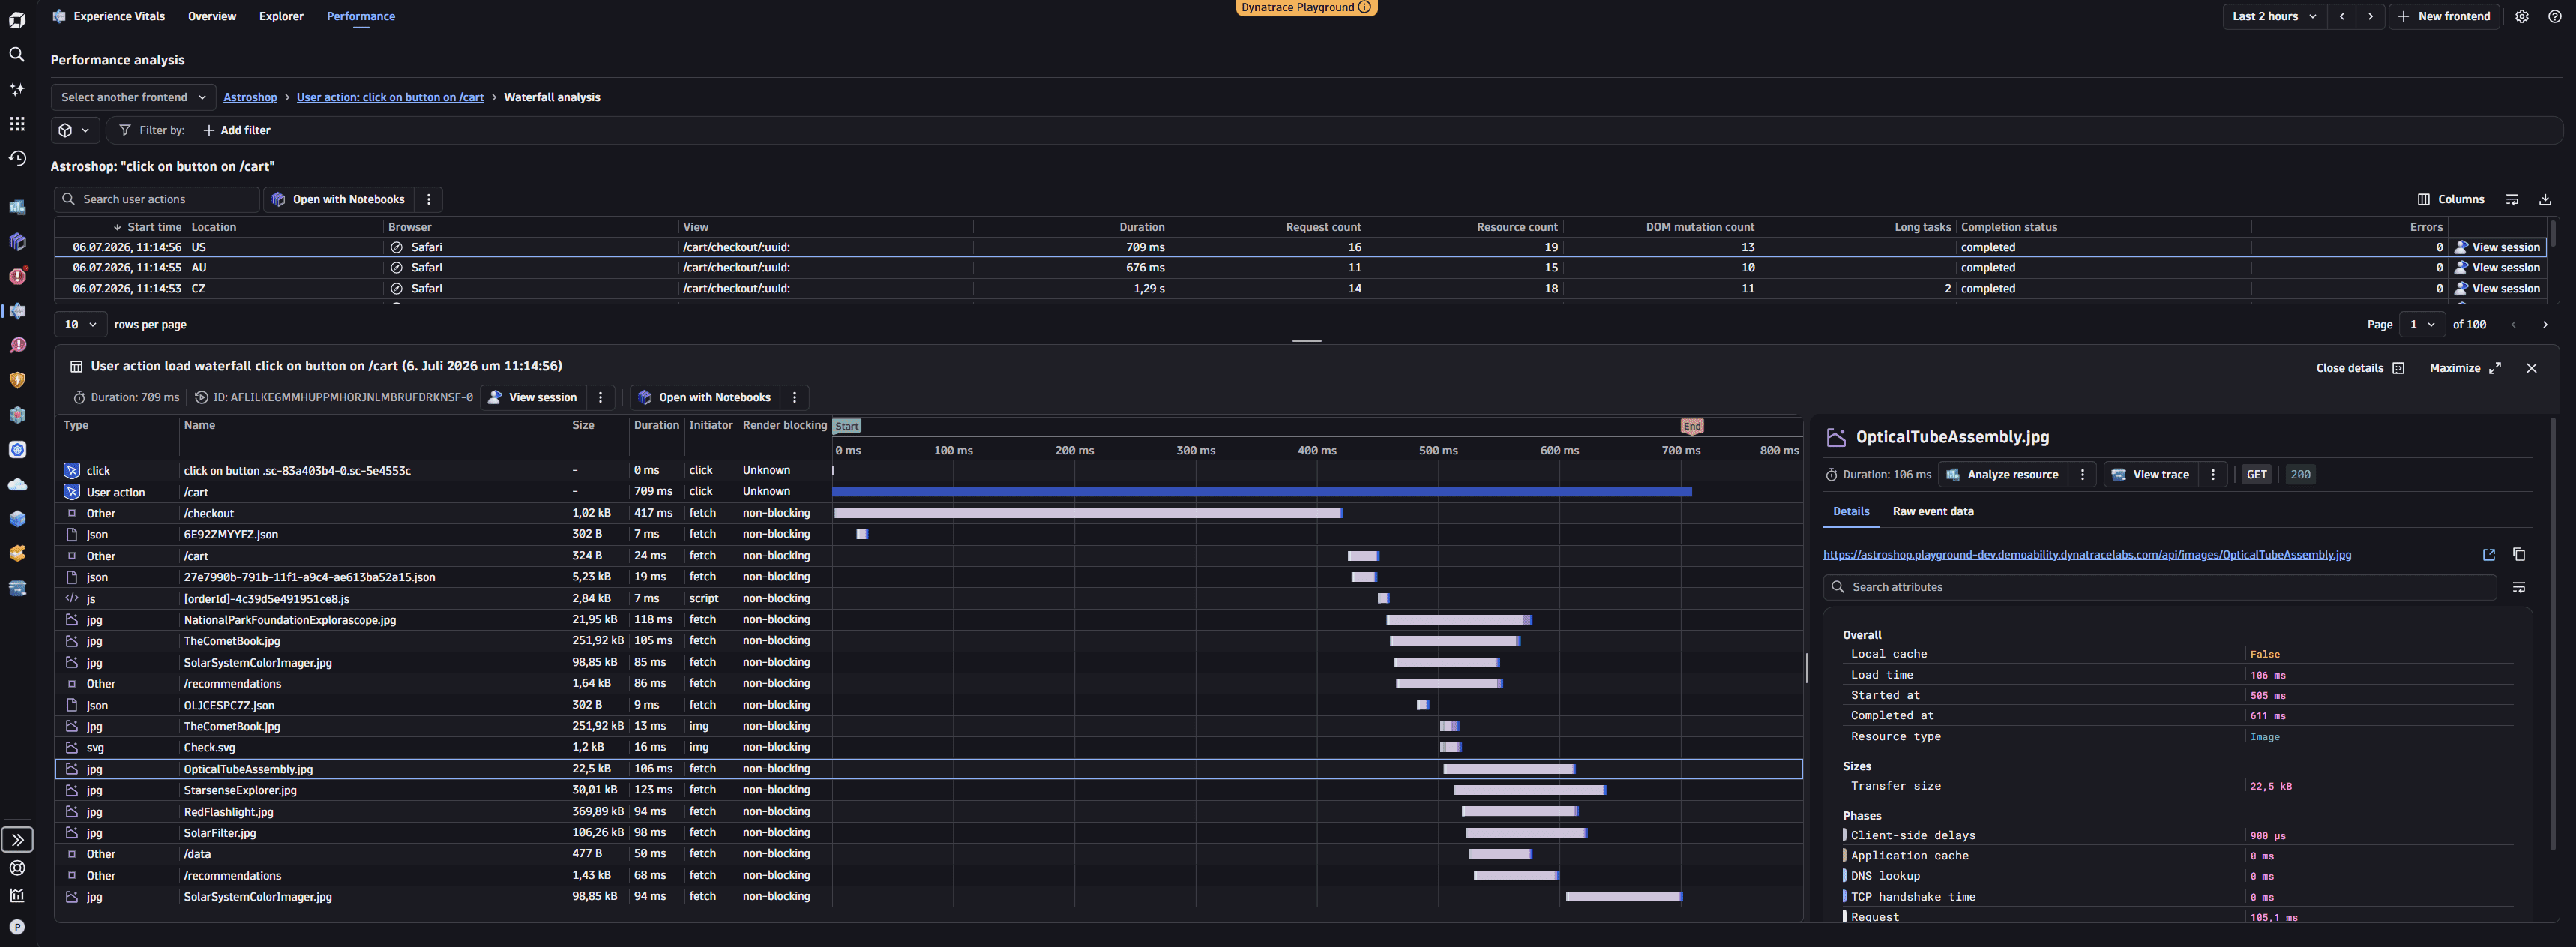
User actions are now integrated end-to-end in Dynatrace, making it easy to understand, monitor, and optimize how real users experience your frontends.
- Consistent user action model (web and mobile). User actions now have a clear, unified concept and data model across web and mobile, with human-readable, stable naming. Names reflect what happened, where it happened, and are aligned across channels (for example,
Click on Add to cart in product_details). Types and additional user action context help understand what happened. Review the User action data model for more details. - Deep Experience Vitals integration.
 Experience Vitals now includes user actions in Explorer and frontend views, including:
- Count and duration metrics.
- A dedicated view of user actions with browser activity and component breakdown.
- One-click drill-down into detailed user action analysis, sessions, errors, and waterfall.
- New user action waterfall. A modern waterfall for user actions on web and mobile shows:
- Requests and navigations.
- Triggers (user interactions) and long tasks as context.
- Key timings and annotations to understand where time is spent.
- Integration with our session viewer and trace analysis features.
- Health alert for user action slowdowns. A new alert type detects degradations in user action performance at the frontend level, integrated into recommended alert sets and workflows for quick triage.
Digital Experience | Error Inspector
Error Inspector: Investigation mode
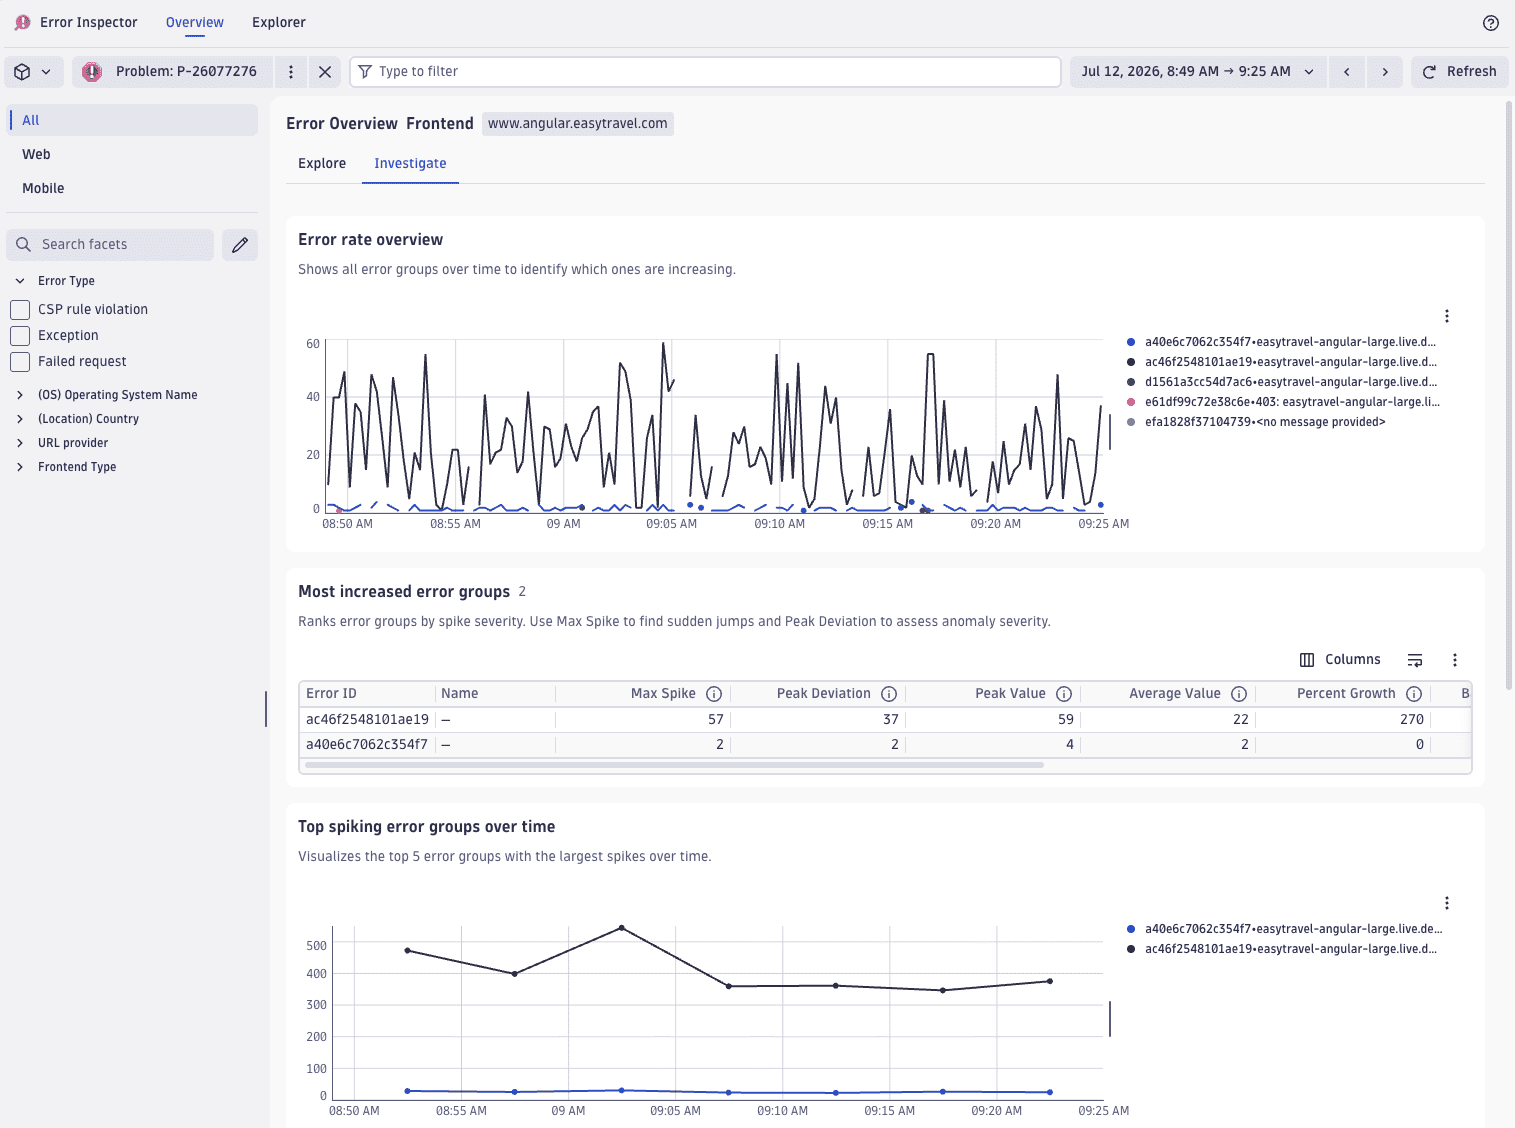
 Error Inspector now understands the context of an active problem. When you open Error Inspector from a problem link, the dashboard and error list are automatically scoped to the relevant frontend and error type without requiring any manual filter setup.
- Overview pre-filtered to the problem scope. You can see the active problem in the context bar. Filters derived from the problem intent, such as frontend name and error type, are applied automatically, and the Investigate tab is opened by default. The Analyze button is highlighted to guide you into the error list.
- Investigate mode goes beyond the problem context. Select a frontend name or error type to open the Investigate tab. You can view the error groups that increased or spiked the most within the selected timeframe, making it easy to spot what changed, even outside of an active alert.
Digital Experience | Error Inspector
Upload symbol files source map in Settings
You can now implement the upload symbol files source map in Settings.
Digital Experience | Synthetic
Synthetic Monitors Platform API (Early Adopter)
A dedicated Synthetic platform API is now available in the latest Dynatrace. It provides full programmatic access to synthetic monitor management from the latest Dynatrace platform, separate from the classic Environment API.
Base URL: https://<env-id>.apps.dynatrace.com/platform/synthetic/v1
The API covers the full lifecycle of synthetic monitors and locations:
- Create, read, update, and delete HTTP, browser, and network availability (NAM) monitors and private locations.
- Trigger and rerun on-demand monitor executions.
- Read synthetic node information.
- Read and update tenant-wide synthetic configuration.
To authenticate, use an OAuth 2.0 bearer token in the form of:
- A platform token (
dt0s16.*) for personal and user-context automation. - An OAuth client with the client credentials grant for service-to-service integrations.
For details, see Accessing Dynatrace Synthetic in Latest Dynatrace — Authentication.
All endpoints are currently in Early Adopter status. Non-breaking changes may be introduced without a version increment. Clients should handle unknown enum values gracefully.
Migrate to the platform API to access the full latest Dynatrace feature set. Users and integrations relying on the classic Environment API (/api/v1/synthetic, /api/v2/synthetic) are not affected—the endpoints remain available.
For the full endpoint reference, see API access.
Digital Experience | Synthetic
Synthetic monitors in Smartscape on Grail
Synthetic monitors, their steps, and locations are now available in Smartscape on Grail. Browser monitors, HTTP monitors, network availability monitors, synthetic locations, and credential vault entries are modeled as topology nodes in the same Smartscape graph as your hosts, services, and Kubernetes workloads. You can query them with DQL, explore their relationships to the rest of your topology, and filter by geography using the full geo attributes now carried on synthetic locations.
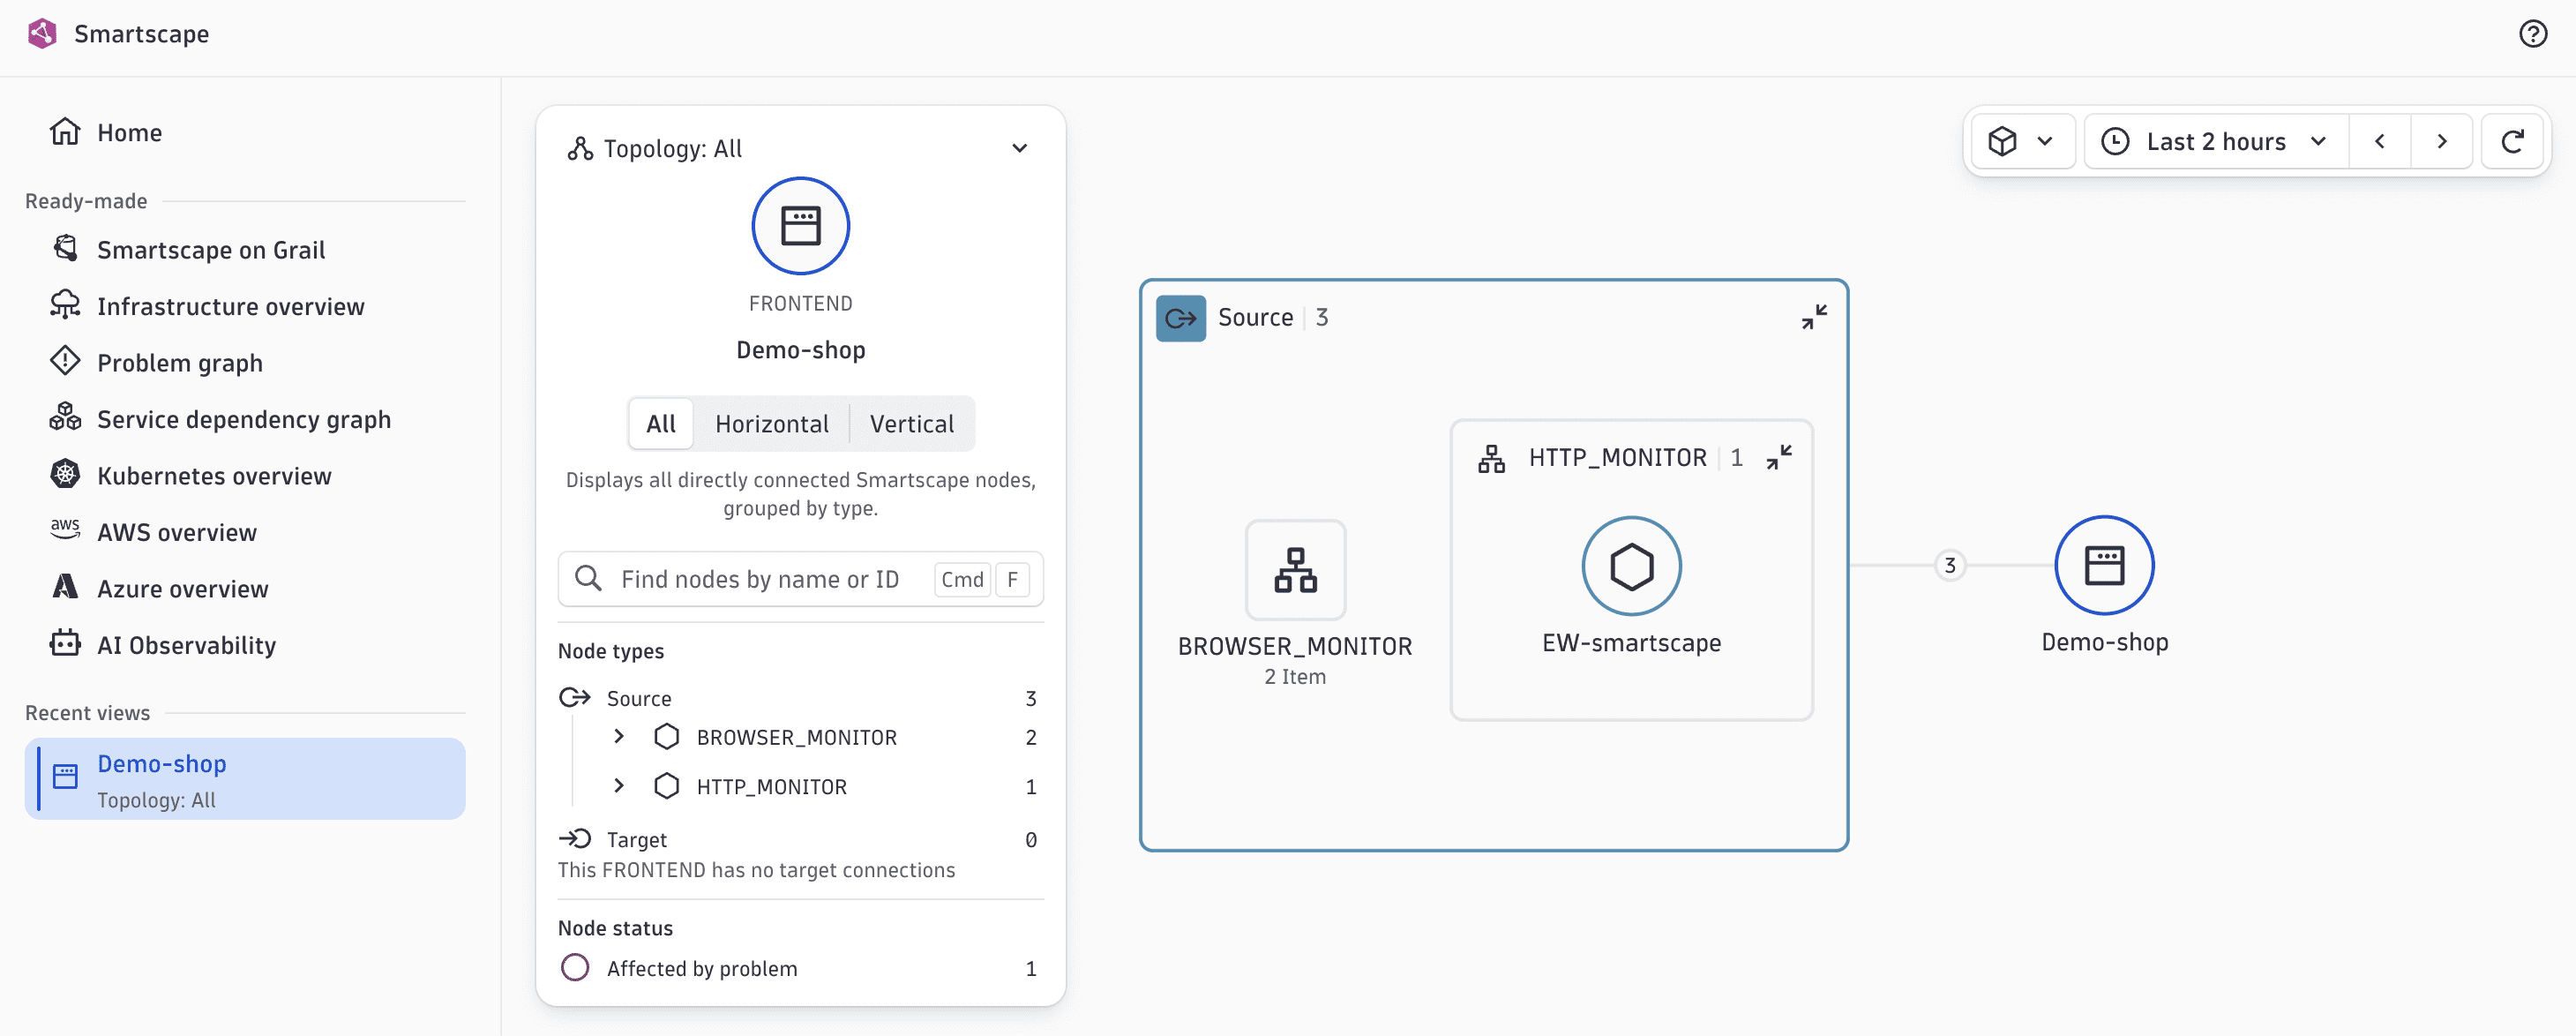
Existing dashboards, queries, and alerting continue to work. All synthetic node types, attributes, and relationships are defined in the Semantic Dictionary. Classic synthetic entity queries are deprecated but remain supported for as long as Dynatrace classic is supported.
Digital Experience | Synthetic
Access control for Synthetic Monitoring
Synthetic Monitoring in the latest Dynatrace introduces a new access control model built around dedicated IAM permission scopes and security contexts. It gives you an alternative to broad, tenant-wide classic roles: precise, role-specific permissions that can be delegated to the teams and individuals who actually own the monitors—without granting them broader platform access than their roles require.
Dedicated permission—manage Synthetic without full admin rights
Access to Synthetic is now controlled by IAM policies with permissions scoped specifically to Synthetic. A user who needs to create and manage monitors can be granted exactly that—synthetic:monitors:read/write/execute—without any access to integration settings or tenant-wide configuration. A team consuming availability data in Dashboards gets the storage permissions to read metrics and events, and nothing beyond that.
This makes it practical to hand Synthetic ownership directly to the teams who run the monitors. The classic Manage monitoring settings role required broad administrative access; the new model does not.
The Admin User and Pro User built-in default policies have been updated to include Synthetic-specific scopes.
The Admin User and Pro User built-in default policies have been updated to include Synthetic-specific scopes. For the full permissions reference, see Accessing Dynatrace Synthetic in Latest Dynatrace — Permissions.
The new permissions apply uniformly across every way you interact with Synthetic: the  Synthetic, Dashboards,
  Notebooks,
  Workflows, and the Synthetic Platform API.
Security contexts: scoped access to subsets of monitors
For multi-team environments, you can scope access to a specific subset of monitors via security context, so that each team sees and manages only their own monitors, on a shared tenant, with no configuration overlap.
A security context is a value assigned to a monitor that represents ownership or organizational scope (for example, team-payments or team-onboarding). IAM policies can use those values as conditions:
ALLOW synthetic:monitors:read, synthetic:monitors:writeWHERE synthetic:dt.security_context IN ("team-payments")
A user with this policy sees and manages only the monitors tagged team-payments. A different team operates within a different boundary—same platform, same app, entirely separate scope.
Enforcement is two-way: a user restricted to specific security contexts can create new monitors, but must assign at least one security context they have access to at the time of creation. This allows teams to self-serve without creating monitors outside their designated scope.
The same mechanism may also enable use cases like separating Synthetic from RUM data access for users who should only see synthetic results.
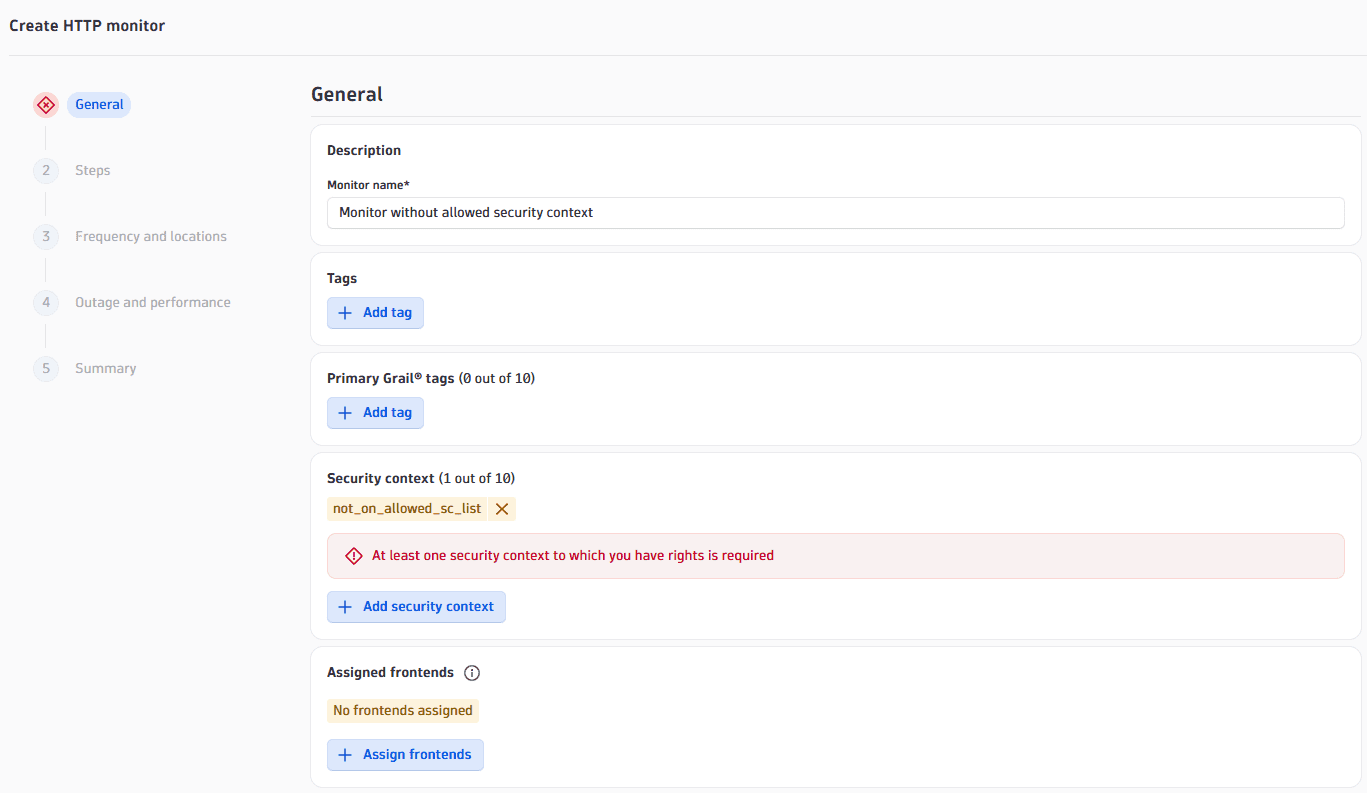
For full details and use case examples, see Accessing Dynatrace Synthetic in Latest Dynatrace — Security contexts.
Classic role-based permissions (View environment, Manage monitoring settings) continue to work and are not removed. However, classic permissions always apply tenant-wide—they cannot be scoped to a subset of monitors, and security contexts have no effect on users with classic-only permissions. Migrate to IAM policies to take advantage of the new access model.
See Permissions setup for the migration path.
Infrastructure Observability | Cloud Foundry
Simple migration to new Cloud Foundry monitoring
We've added support for migrating from legacy Cloud Foundry monitoring to a new, scalable, extension-based engine.
Infrastructure Observability | Clouds
New Cloud Platform Monitoring available for environments on Google
Cloud Platform Monitoring is now generally available for AWS and Azure environments, and in preview for Google Cloud (GCP) environments.
This gives teams production-ready multi-cloud monitoring across AWS and Azure, while enabling early access to GCP monitoring capabilities as they continue to evolve.
Infrastructure Observability | Databases
Detect unmonitored database instances
Databases now highlights unmonitored database instances (such as AWS RDS or Aurora, with GCP and Azure to follow) that are discovered by  Clouds but not yet monitored by Databases.
Infrastructure Observability | Databases
Introducing Smartscape entities for databases
Database and database instance entities are now supported in Smartscape for PostgreSQL, MySQL, Oracle, DB2, Microsoft SQL Server, SAP HANA, and MariaDB. We've also added new Smartscape entities for table and index, available only for PostgreSQL and MySQL.
Infrastructure Observability | Databases
Active connections analysis in Databases
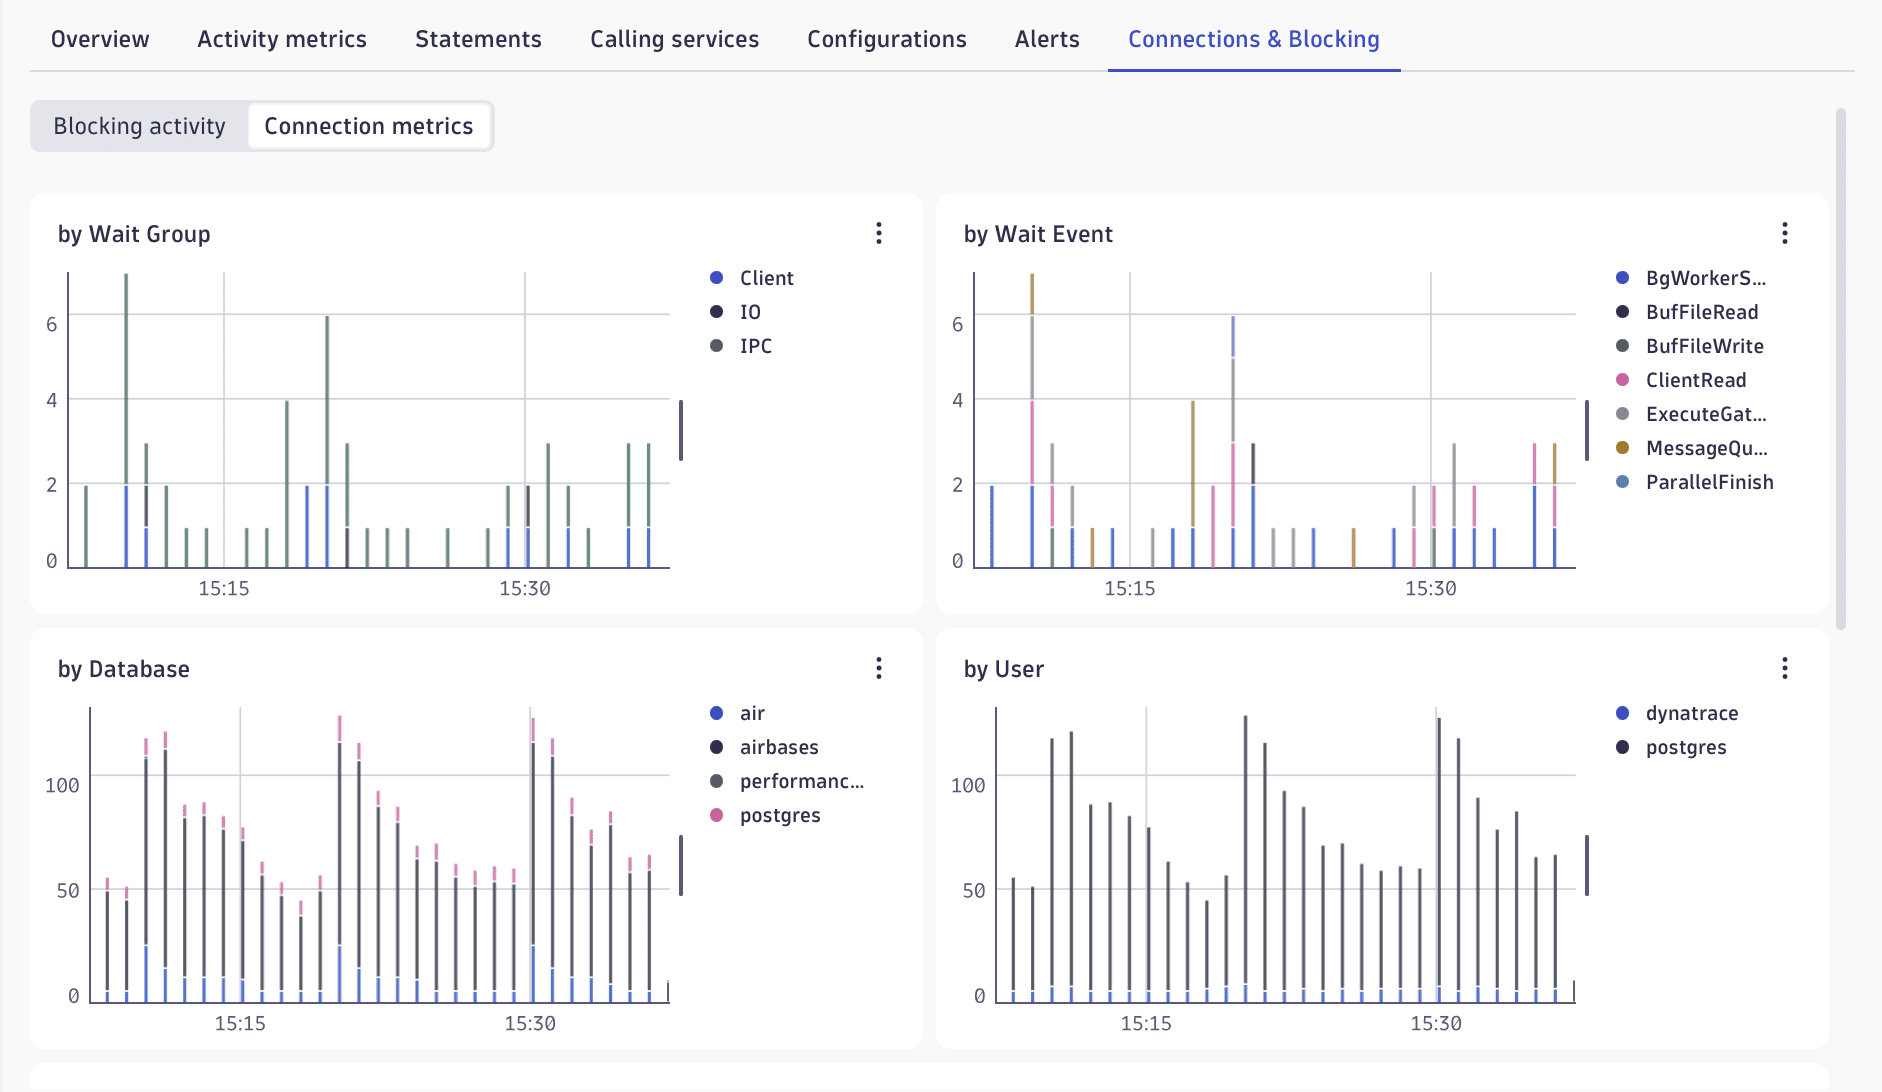
Active Connections Analysis adds a dedicated Connections & Blocking view to Databases. Teams get a visual breakdown of concurrent database connections and their key attributes, such as query, wait group, and application, making it easier to pinpoint what's driving database load, identify long-running or blocked queries, and optimize performance.
This functionality is available for PostgreSQL and MySQL databases only.
Infrastructure Observability | Databases
New rate card for PostgreSQL and MySQL database monitoring
You can now monitor your PostgreSQL and MySQL databases with a new instance-based pricing model. Instead of billing by metric and log volume, you're charged per database instance per hour—giving you predictable, transparent costs that scale with the number of databases you monitor. For details on how consumption is calculated, see Database Monitoring.
Enabling the new model unlocks the full Databases experience for PostgreSQL and MySQL:
- Interactive schema and execution-plan visualizations
- Configuration, execution plan, and schema warning signals
- Automatic database discovery
- Table and index metrics
- Active connections and wait-group analysis
- Access to the Database Analyzer service
Metric and log ingestion for these databases is included, and all in-app queries are free.
If your environment is entitled to the new model and you have administrator-level permissions, you can enable it in Settings. After enabling, update your database extension to the latest version to make use of the newly unlocked features.
This model currently applies only to PostgreSQL and MySQL. Monitoring for other database vendors continues under the existing pricing model.
Infrastructure Observability | Databases
Database tables and index metrics for PostgreSQL and MySQL
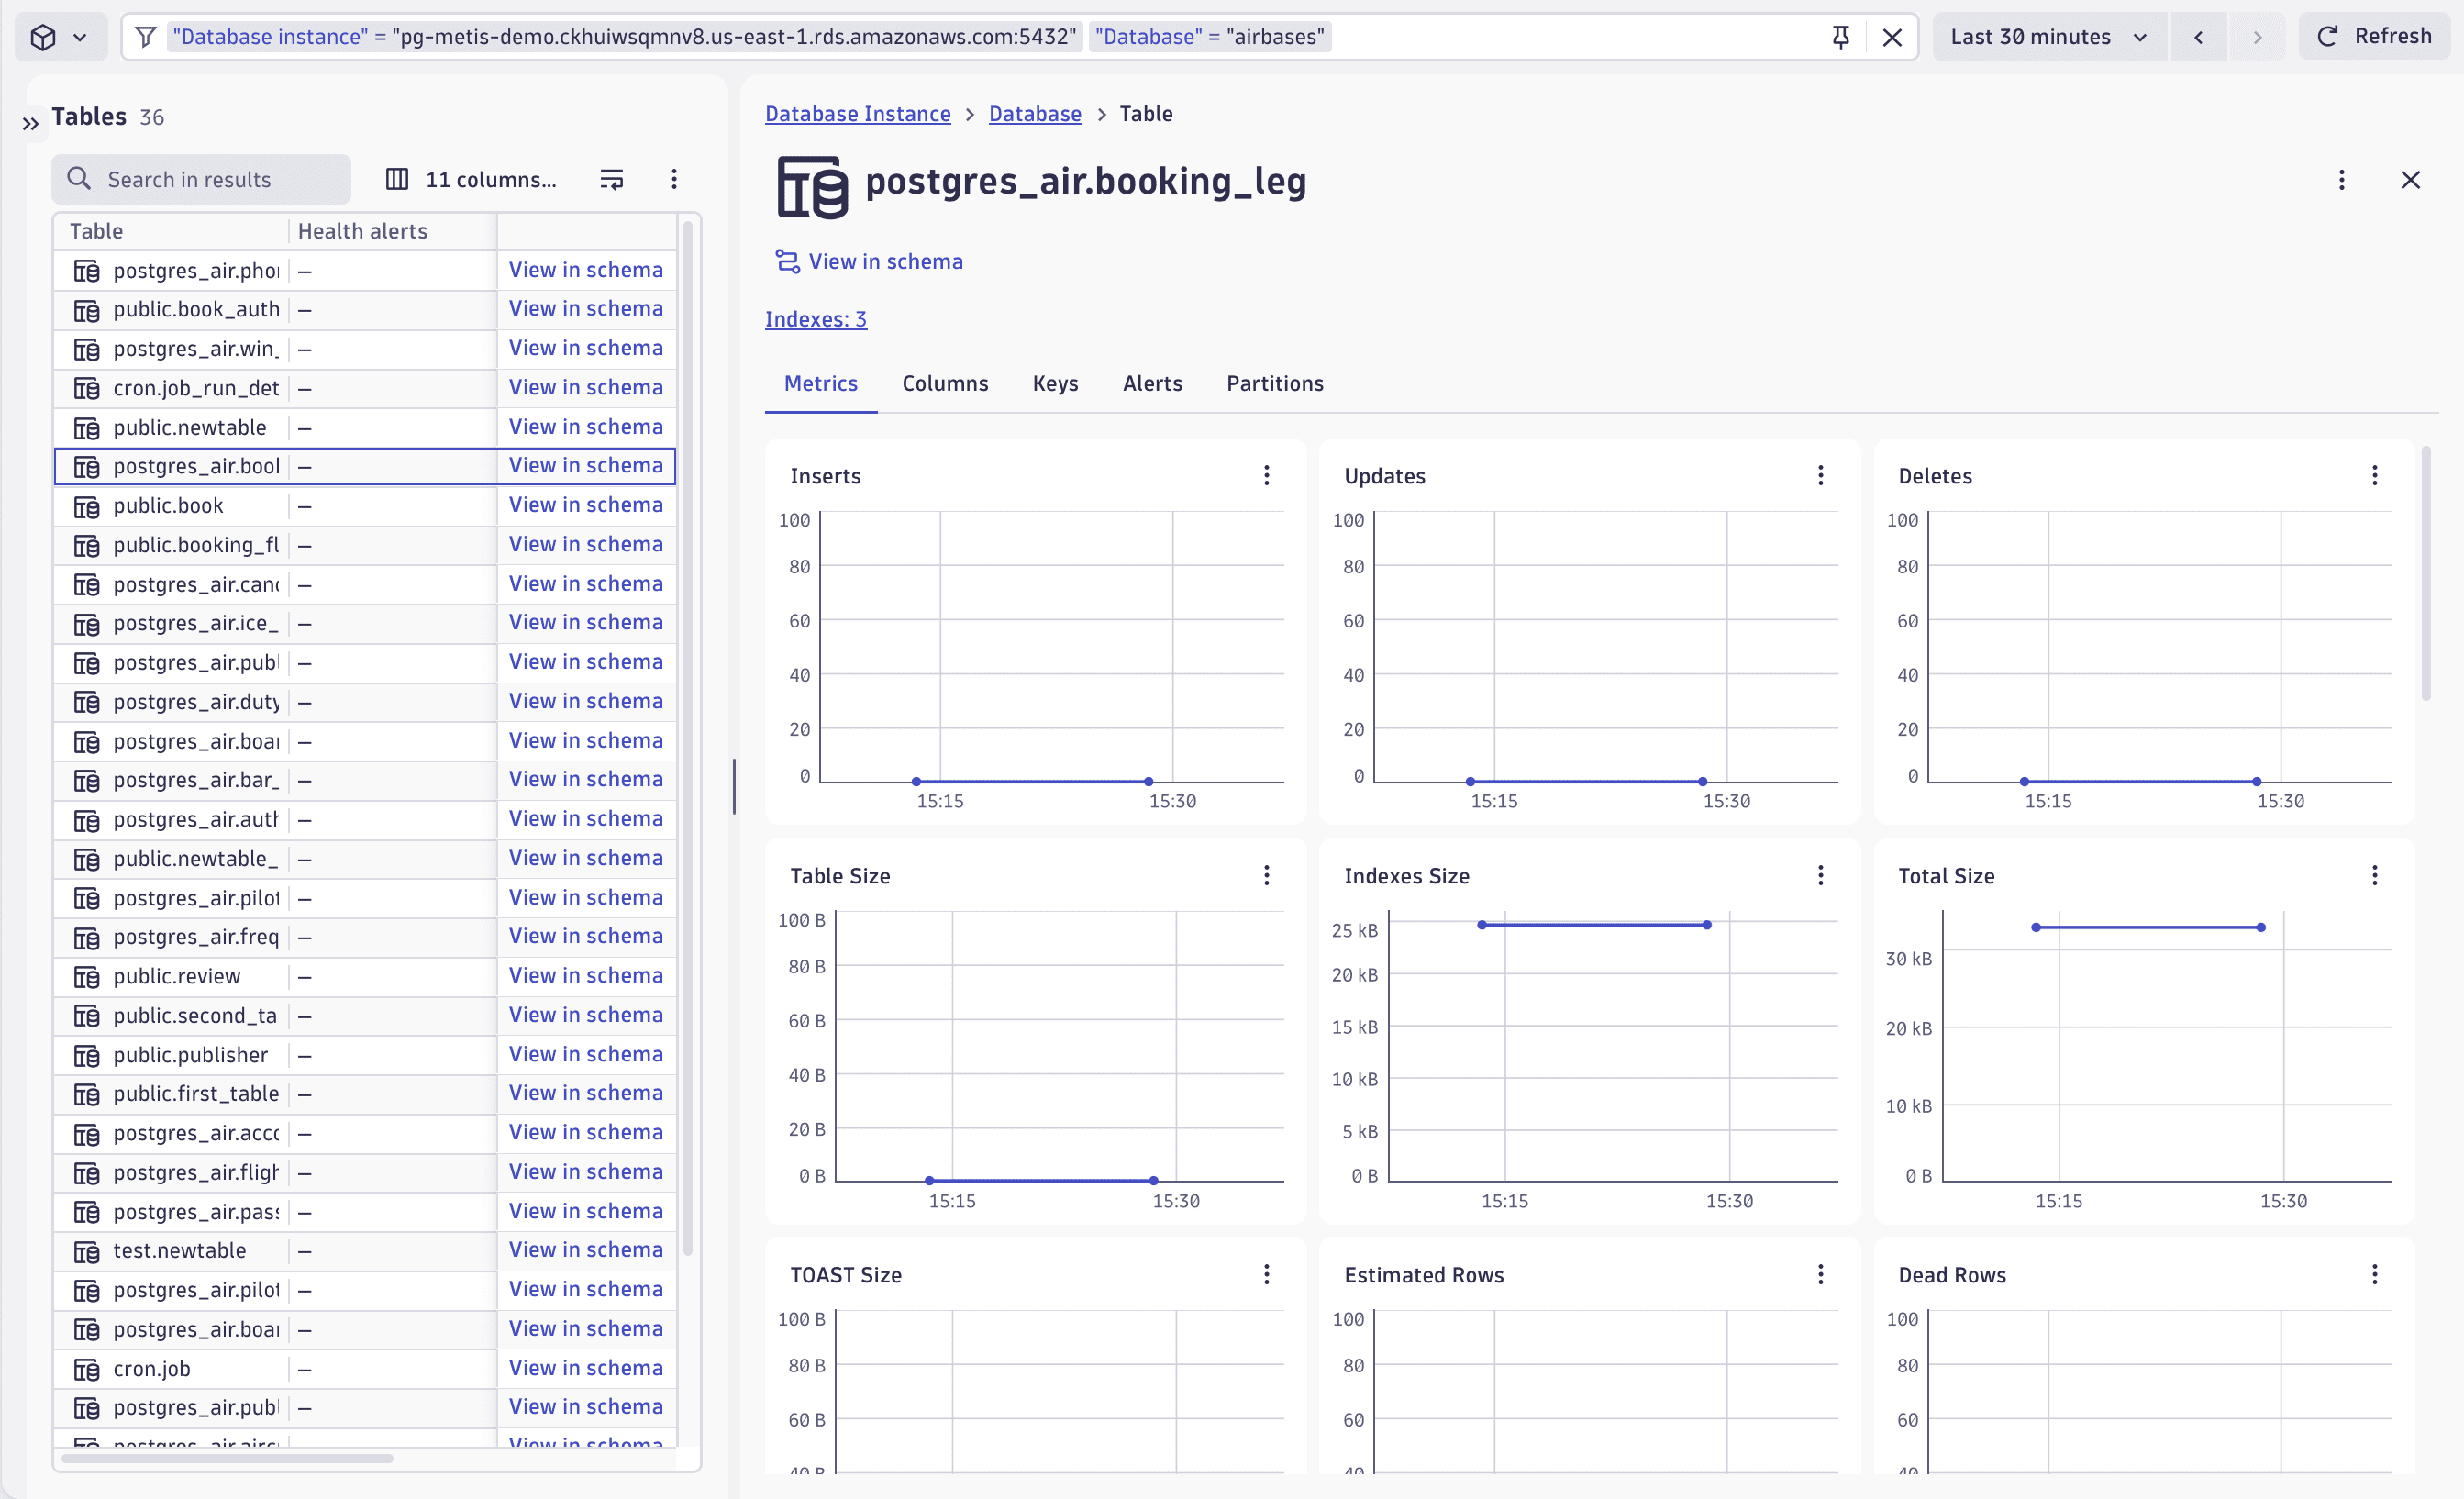
Databases now includes detailed table and index metrics, including size, row count, read and write activity, index usage, and growth trends. Use them to spot performance bottlenecks, identify inefficient or unused indexes, and catch storage anomalies before they become problems.
This functionality is available for PostgreSQL and MySQL databases only.
Infrastructure Observability | Databases
Analyze and visualize MySQL and PostgreSQL database schema in Databases
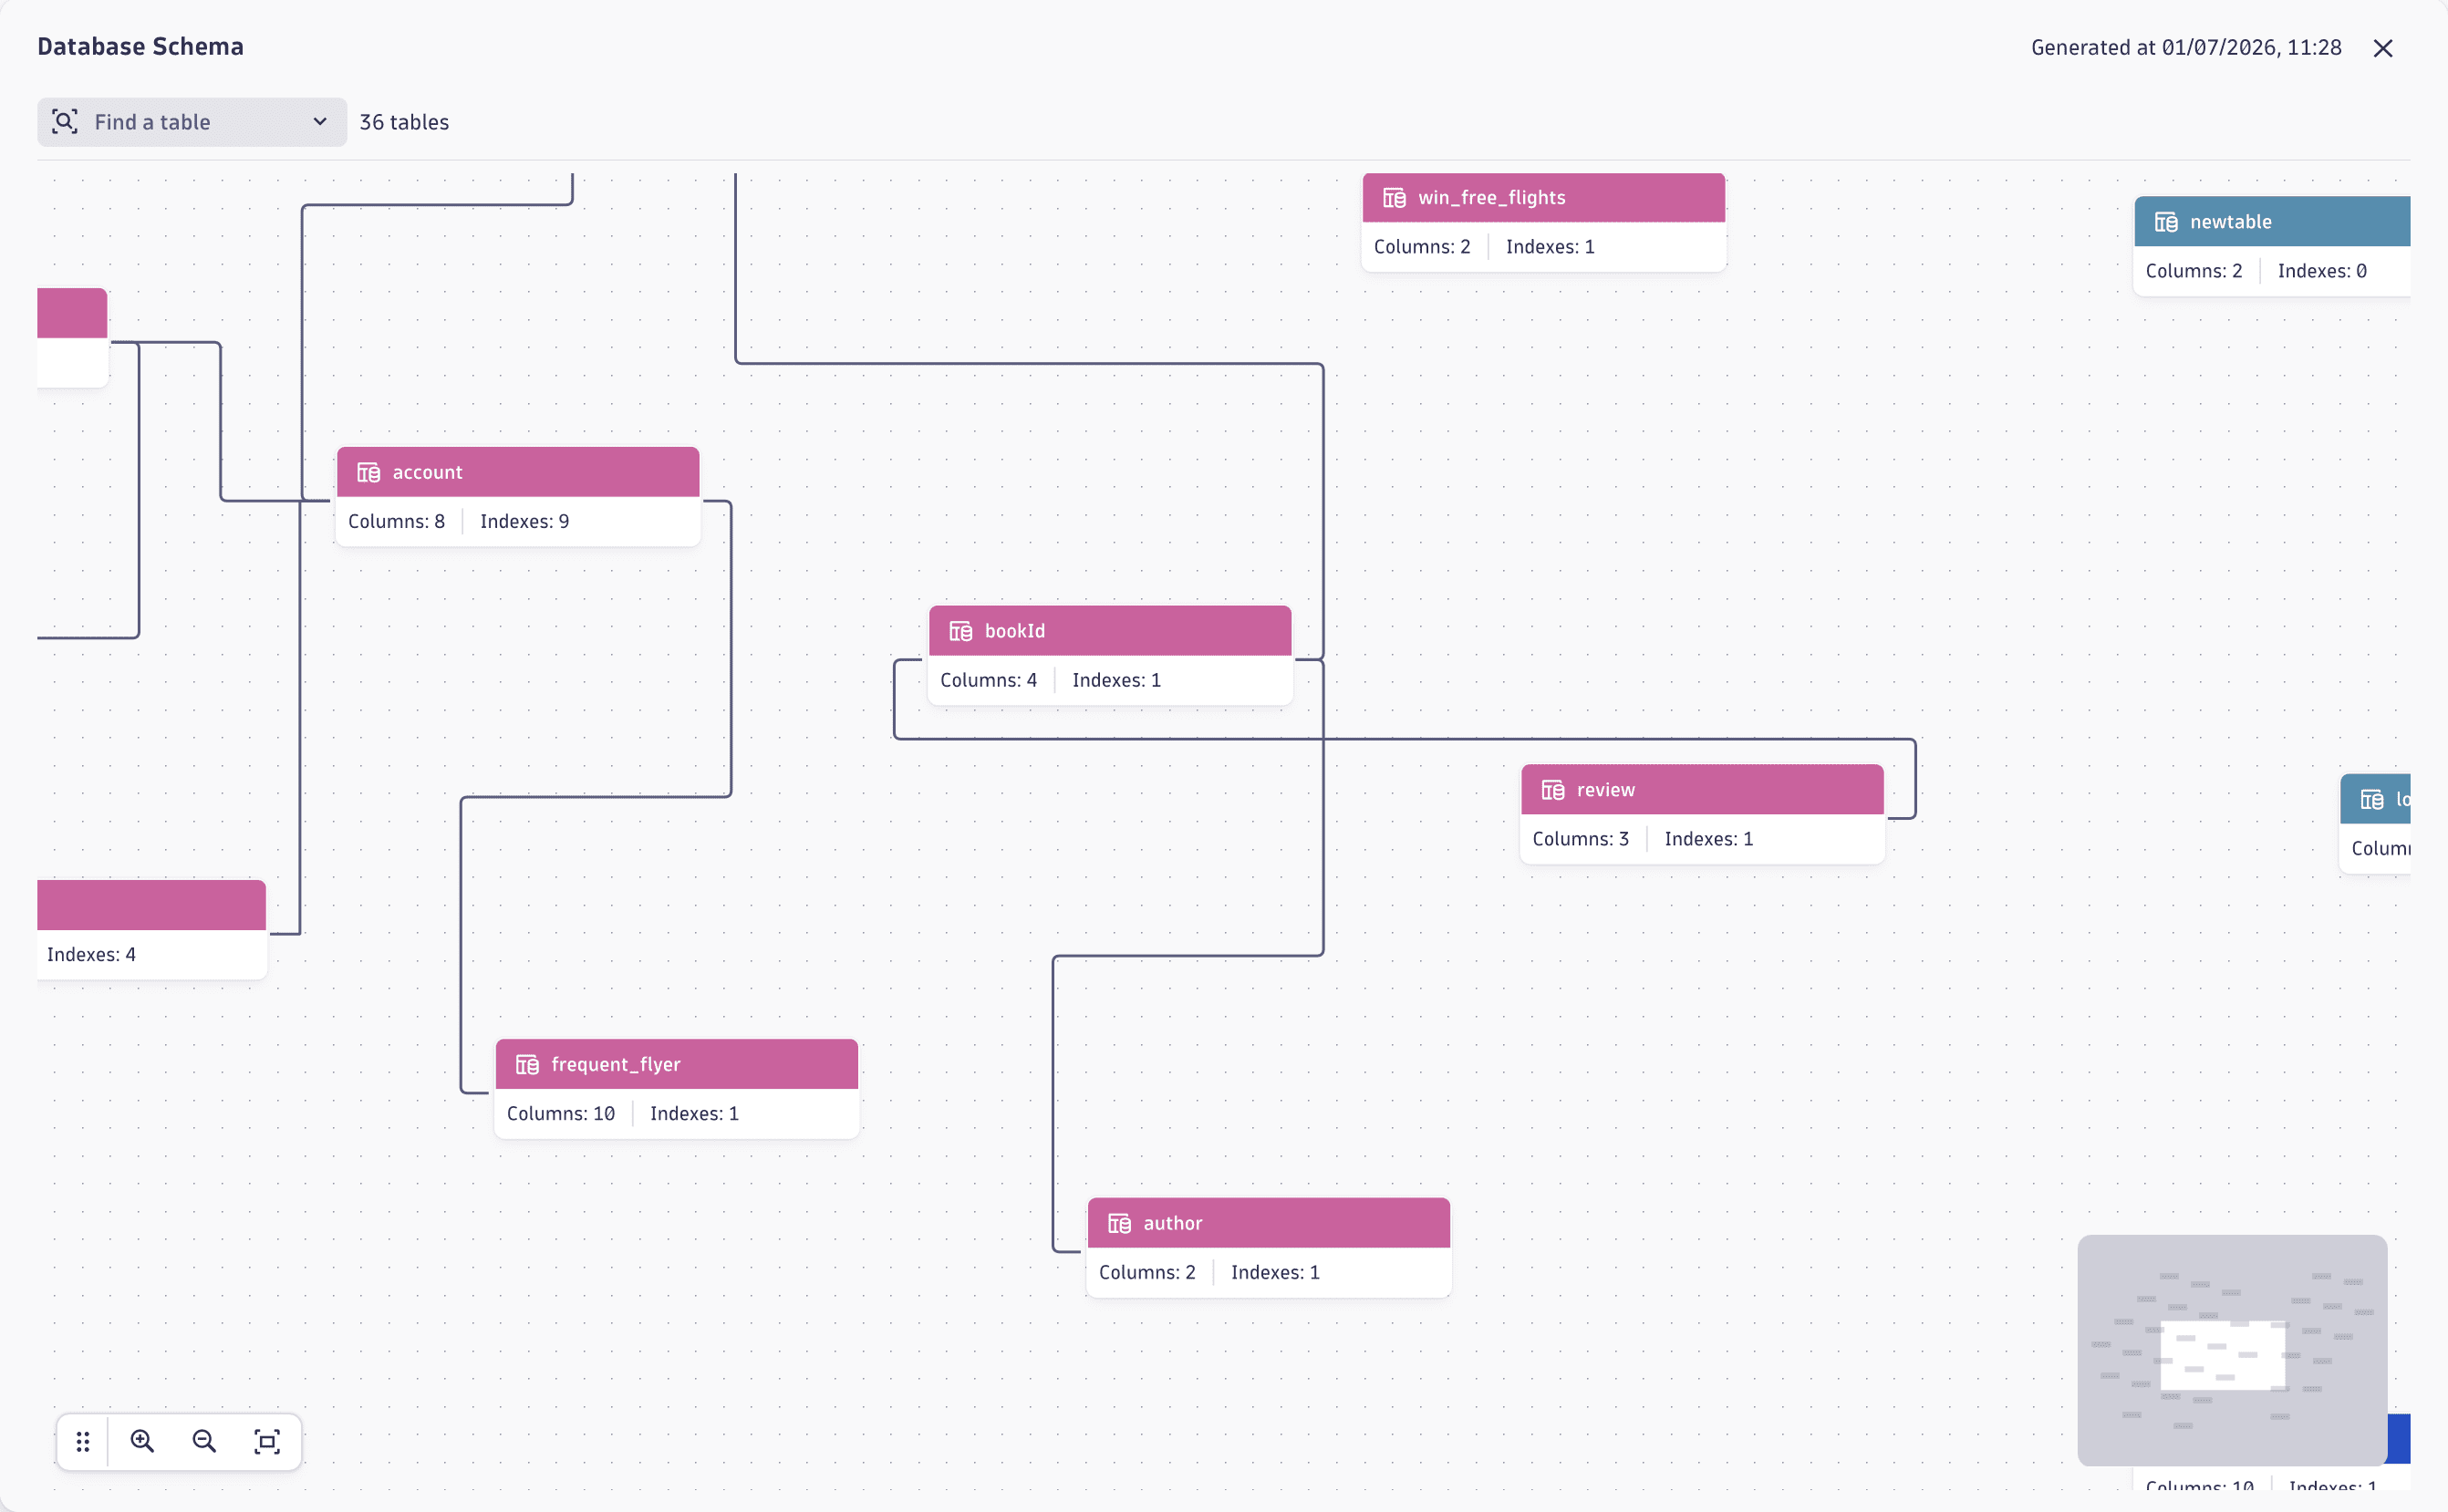
Explore database structures, relationships, and performance metrics visually, improving troubleshooting and optimization workflows with Database Schema for MySQL and PostgreSQL. Use the interactive, graphical schema visualization tool to proactively detect schema issues, such as missing indexes or data type mismatches, and gather actionable insights for performance optimization.
Infrastructure Observability | Databases
Visualize database query execution plans to speed up troubleshooting
Databases now lets you visualize query execution plans for PostgreSQL and MySQL in a clear, interactive, and easy-to-understand view. This makes it simple to see how a query is executed, and quickly spot common performance issues like full table scans, expensive joins, and large sorts. Teams can find the root cause of slow queries faster and get to the right optimization with less guesswork.
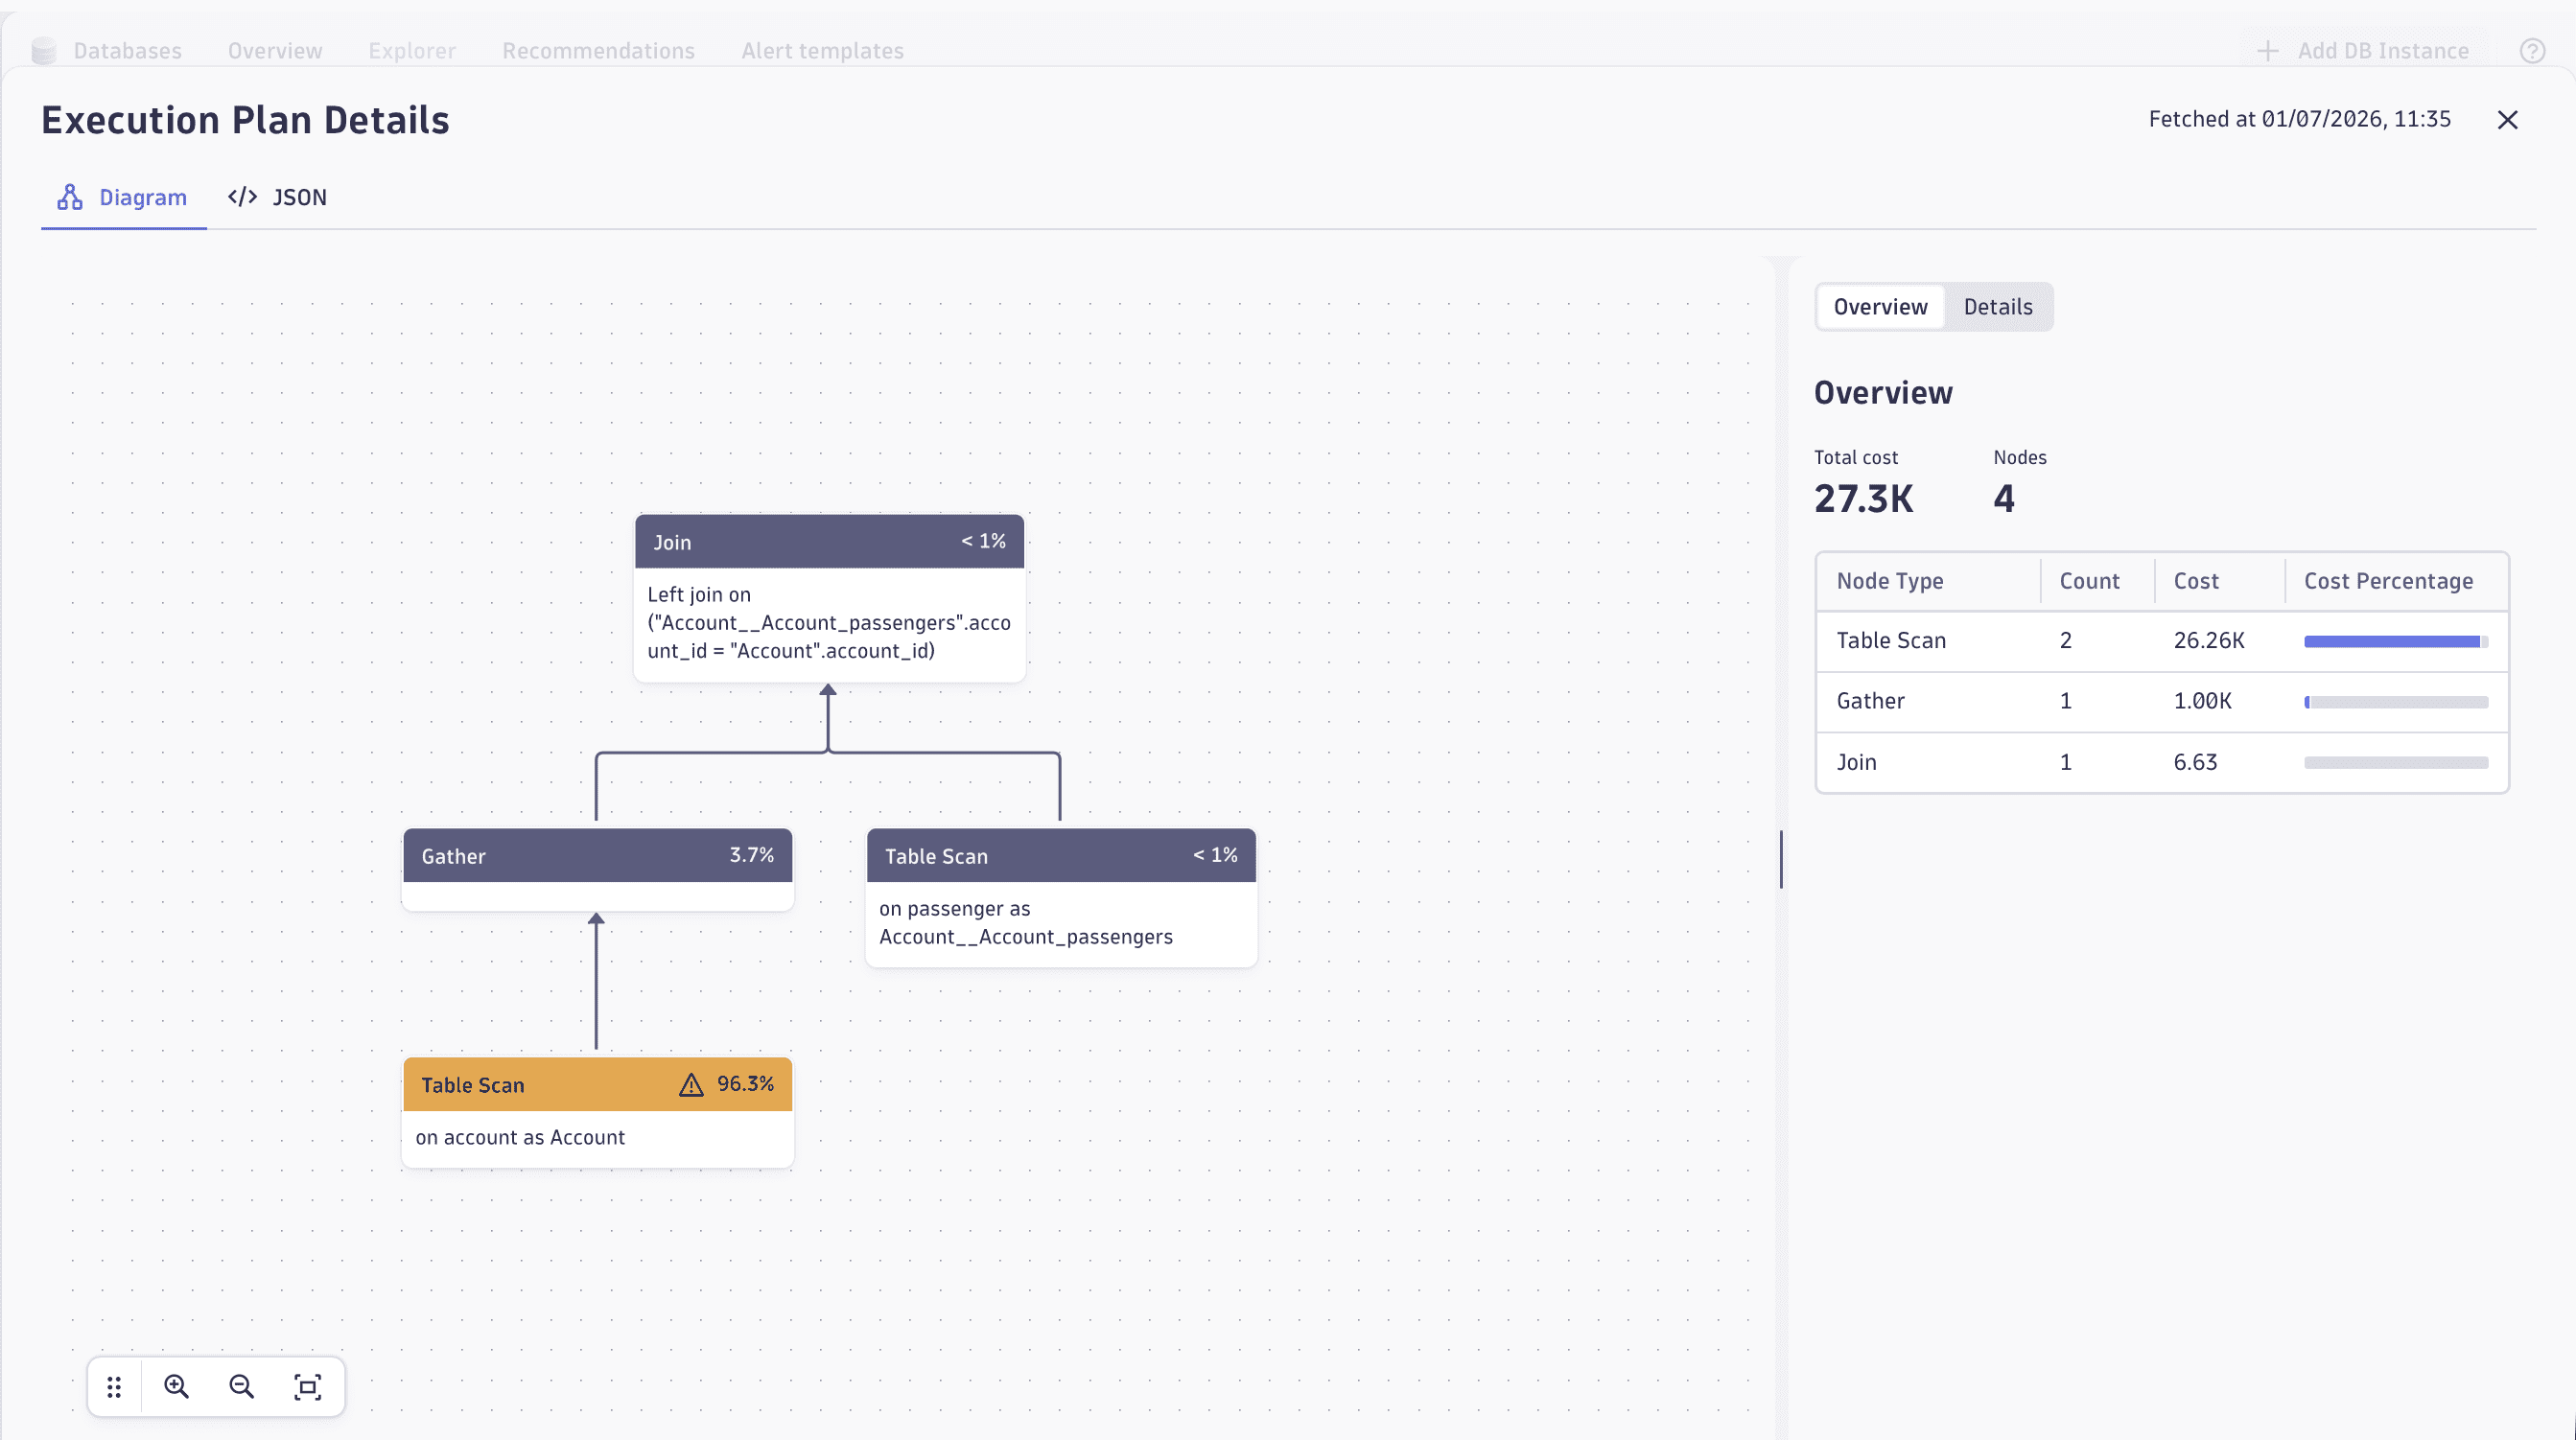
Infrastructure Observability | Databases
Database Activity Insights engine
Database Activity Insights is a centralized backend service integrated into the Dynatrace platform that continuously processes raw data collected from your database instances, including metrics (instance, database, table, index, and query level), schema structures, configurations, and execution plans. Predefined rules are applied to this data to proactively generate warning signals before issues escalate. Findings are pre-calculated and surfaced automatically in Databases, with no action required on your end.
Infrastructure Observability | Databases
Enhanced Postgres and MySQL extensions datasource
We've enhanced the Postgres and MySQL database extensions to:
- Minimize the volume of data sent.
- Improve data privacy measures.
- Allow database autodiscovery and granular database querying.
- Provide better insights with sub-minute monitoring.
- Allow vendor version-aware queries.
Infrastructure Observability | Hosts
Host and process availability reporting with maintenance window support
 Infrastructure & Operations now supports maintenance-window-aware availability reporting for hosts and process group instances (PGIs). Maintenance windows are also visualized as overlays on availability and health charts in Infrastructure & Operations, giving immediate context for any availability dip. You can now also create DQL queries that separate planned from unplanned downtime. This benefits IT operations teams and SREs who need to report on SLA compliance and want to exclude scheduled maintenance from their availability calculations.
Infrastructure Observability | Infrastructure & Operations
New health alerts and warning signals for more focused infrastructure monitoring
Infrastructure & Operations now provides health alerts and warning signals for Kubernetes and network devices.
Infrastructure Observability | Infrastructure & Operations
Deprecated Dynatrace classic ActiveGate deployment API
We've deprecated the ActiveGate deployment API, which includes endpoints such as /api/v1/deployment/installer/gateway and /api/v1/deployment/installer/gateway/connectionInfo. Use the Latest Dynatrace deployment API instead.
Infrastructure Observability | Infrastructure & Operations
New REST API serving public URIs for Dynatrace images
We've added a new REST API to provide URIs for the images used in Dynatrace components. The endpoint is GET /api/v2/fleetManagement/components/containerImages.
Infrastructure Observability | Infrastructure & Operations
REST API for public image URIs
We have added a new REST API to retrieve public image URIs for Dynatrace components.
Infrastructure Observability | VMware
Easier migration to new VMware monitoring
We provide a new guided migration to help you migrate legacy VMware monitoring to a new, scalable, extension-based engine.
Platform
Update your classic entity queries to use the new Smartscape topology
With the latest support for OneAgent, ActiveGate, and Extensions, the new Smartscape topology fully replaces the classic topology and serves as the foundation for future Dynatrace capabilities. Use the dt-migration skill, part of the Dynatrace for AI collection, to convert your existing classic entity queries in notebooks, dashboards, and workflows to new Smartscape queries.
Classic entity queries remain fully supported for the foreseeable future, so you can make the switch at your own pace.
To learn more, see:
Platform
Sizing guides for Environment ActiveGate Log ingestion API
If you're planning or scaling log collection infrastructure, we've updated the sizing guides for the Environment ActiveGate Log ingestion API (JSON and OTLP). These now cover containerized (operator-provisioned) and host-based deployments. The guides provide capacity recommendations to reduce the risk of latency and data loss in production.
- Sizing guides for containerized environment ActiveGate: OTLP endpoint, combined scenario (Kubernetes log modules + OTLP API traffic), and routing mode with log module traffic only.
- Sizing guides for Host-based Environment ActiveGate on Linux and Windows: JSON and OTLP endpoints, and combined scenario (JSON API + OneAgent log modules).
- Documented testing profiles so you can compare their workload against the baselines used for each sizing recommendation.
For details, see Linux ActiveGate sizing guide, Windows ActiveGate sizing guide, and Kubernetes ActiveGate sizing guide.
Platform
Encryption Keys on AWS (BYOK) general availability
For environments on AWS, you can now manage your own encryption keys for Dynatrace platform data at rest, taking full control over data access while meeting the strictest regulatory requirements.
Platform
Metric metadata available via DQL
You can now query metric metadata via DQL with load “/dt/platform/metrics.metadata”. This file contains the list of all metrics available in your environment, refreshed regularly. Each row indicates the metric key, name, description, kind, unit, the list of dimensions, and the last time the row was updated.
Platform
Histogram metric extraction using OpenPipeline
You can now extract histogram metrics from logs or spans using OpenPipeline. This is particularly useful if you're repeatedly using percentile aggregations for log or span queries, dashboards, SLOs, or anomaly detection. Extracting histogram metrics allows you to replace your existing logs or spans queries with efficient metric queries using the timeseries percentile() DQL command.
Histograms are billed with 10 metric data points. For more information, see Metrics powered by Grail - Ingest & Process.
Platform
Operator 1.10.0
Dynatrace Operator now supports platform token authentication. To enable it, provide a platform token in the apiToken field within a DynaKube token secret. The paasToken field is deprecated.
When you use a platform token:
- Dynatrace Operator uses the public registry feature by default for ActiveGate, OneAgent and code modules, standalone log monitoring, EEC and SQL extension executors.
- The deprecated attributes
dt.kubernetes.cluster.id,dt.kubernetes.workload.idanddt.kubernetes.workload.nameare no longer used for metadata enrichment. - The mark-for-termination event is no longer sent when a node is drained or deleted from the cluster.
Platform | API Gateway
Extending platform token support across APIs
You can now use platform tokens to authenticate against all classic and ingest API endpoints, including logs, metrics, and business events.
We recommend platform tokens over classic API tokens for new integrations: They're bound to user permissions for fine-grained access control, can be scoped to specific environments, and support rotation and temporary disabling without deletion.
Existing API token authentication remains fully supported, so no changes are required for current integrations. To learn more, see Platform Tokens.
Platform | API Gateway
ActiveGate deployment REST API is now generally available
The latest Dynatrace REST API for ActiveGate deployment is now enabled by default and available via the platform domain. The API is accessible with the default Dynatrace administrator policy.
fleet-management/v1/activegate endpoints:
GET fleet-management/v1/activegate/installer/{os-type}/{arch}:download—Download latest installer.GET fleet-management/v1/activegate/installer/{os-type}/{arch}/{version}:download—Download specific installer version.GET fleet-management/v1/activegate/installer/version/target—Get target installer version.GET fleet-management/v1/activegate/installer/versions—List available installer versions.GET fleet-management/v1/activegate/connection-info—Get ActiveGate connection info.
Platform | Dashboards
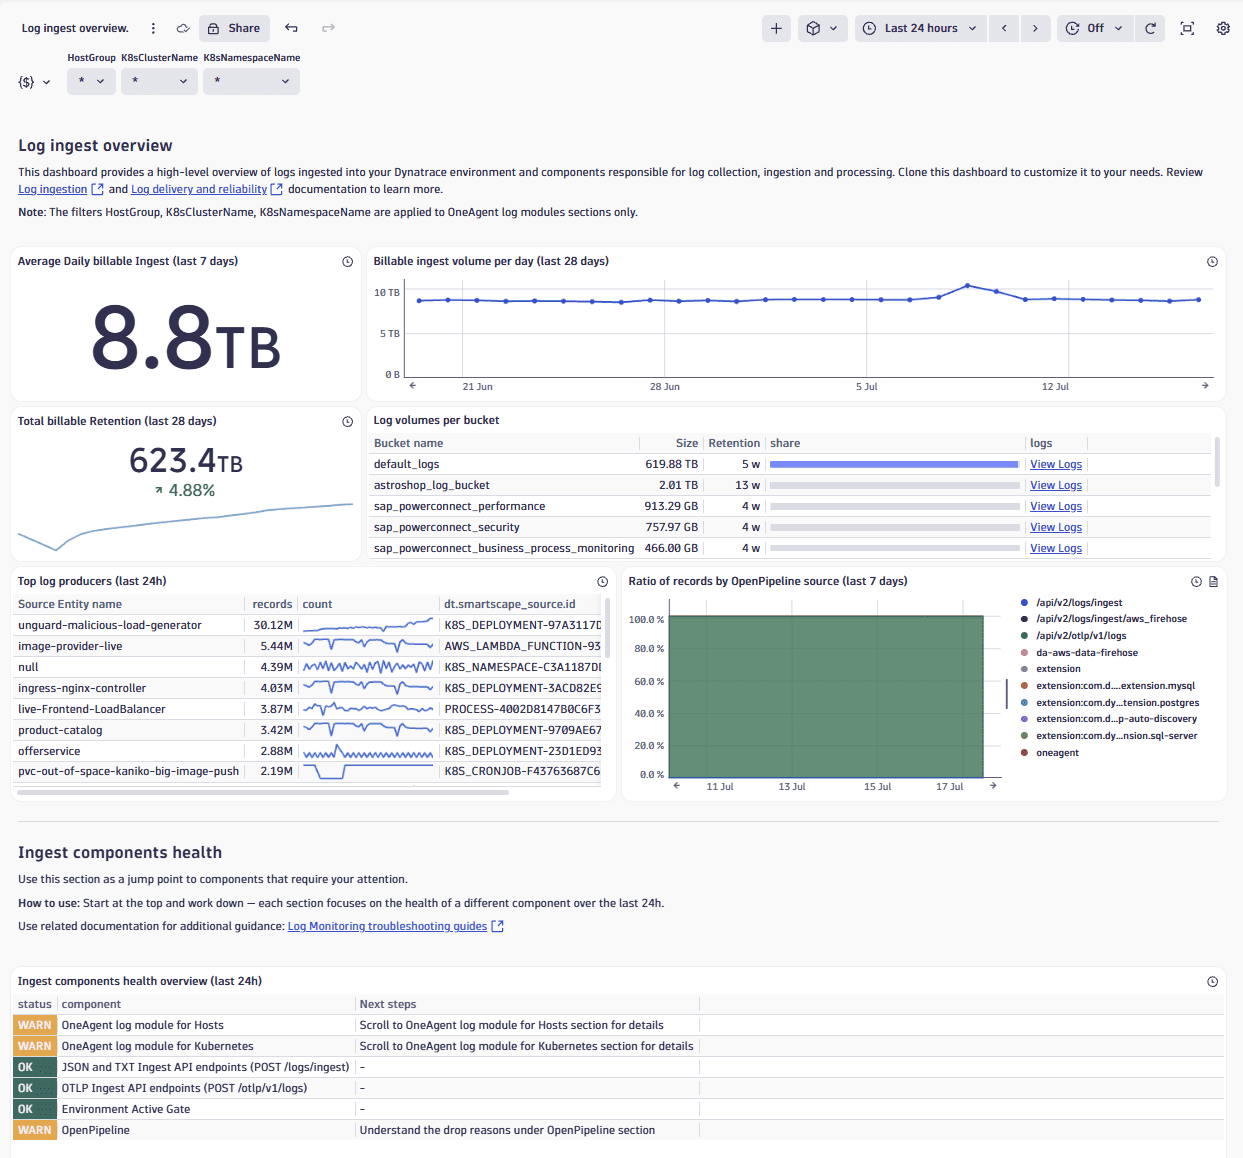
Log ingest monitoring for customer-managed collection infrastructure
If you're managing log collection infrastructure, you can use an upgraded dashboard and troubleshooting guides that cover both OneAgent log modules and Environment ActiveGate (Log ingest API, JSON, and OTLP). These improve visibility into ingest health and enable self-service resolution of data loss, latency, and configuration problems.
What's new:
- Upgraded ready-made Log ingest overview dashboard for OneAgent log modules and Environment ActiveGate health.
- Troubleshooting guides for OneAgent log ingest (data loss, dropped records, wrong timestamps, security-rule conflicts).
- Troubleshooting guides for Environment ActiveGate (log ingest API, JSON and OTLP).
- Documentation on log collection resiliency, operation, and architecture for large-scale infrastructure planning.
To get started, see Log delivery and reliability and OneAgent Log module.
Platform | Dashboards
Upload and manage images directly in dashboard tiles
You can upload and manage images directly within Dashboards based on a new tile type. This new type opens an integrated image library where you can upload new images, browse existing ones, or link external URLs. Images are stored in the document service, where they are automatically accessible to all collaborators in the same tenant and can be configured with display settings such as sizing, alignment, background color, dark theme variants, and alt text for accessibility.
Platform | Dynatrace Intelligence
New central alert management in Settings
You can now view and configure all your alerts in Settings > Analyze and alert > All alerts in addition to  Anomaly Detection.
Platform | Dynatrace Intelligence
Service events use Smartscape entities in the DQL
Service events with event.provider=ROOT_CAUSE_ANALYSIS now use Smartscape entities in the DQL query instead of classic entities. The metric chart in the Problems Event tab also shows the metric name when hovering over the metric line for those now.
Platform | OneAgent
Ingest enrichment configuration support from OneAgent
OneAgent now enriches telemetry data at the source based on a central enrichment configuration defined in the platform. You can define rules that conditionally apply primary tags, Cost Allocation (dt.cost.costcenter, dt.cost.product), and dt.security_context to all data from matching entities.
- Conditional enrichment: Define rules using the pattern
IF <condition on input fields> THEN enrich with <fields and values>. Conditions are expressed with DQL matcher functions (equality, phrase, and existence checks) and supportNOT,OR, andANDoperators. - Input fields: Conditions can evaluate primary fields (clouds and Kubernetes metadata,
dt.host_group.id) and OneAgent resource attributes such ashost.name,host.tags.<key>,process.custom_metadata.<key>, anddt.process_group.detected_name. - Static and derived enrichments: Rules can add fixed key-value pairs, or use DPL transformations to derive tag values from fields OneAgent reads.
- Enrichment scope: Host-scoped rules enrich the host and all entities running on it (processes, containers, disks, network interfaces), while process-scoped rules enrich only the matching process.
Enrichment is applied to all data generated by a matching entity: metrics, spans, logs, Davis events, and Smartscape entities (HOST, DISK, NETWORK_INTERFACE, CONTAINER, PROCESS). Configuration is fetched from the platform on startup and refreshed periodically, so changes apply without an agent restart.
Platform | OneAgent
New configuration option to detect logs in binary format
We've introduced a new configuration option, BinaryDetectionMode that lets you control how the Log Agent handles binary or non-supported encoding files within a log source (LGI).
To configure this setting, go to Settings > Collect and capture > Log monitoring > Advanced log settings and set the BinaryDetectionMode property.
By default, the entire log source is marked as binary and stops being processed. There is no change in behavior for existing deployments.
Platform | Platform Services
New Jira Service Management Connector
The Jira Service Management (JSM) Connector allows you to send Dynatrace information like problem events to Jira Service Management to create, update, or close alerts.
Platform | Platform Services
Respond to Workflows approval requests without leaving Slack
You can now respond to Workflows approval requests directly in Slack. When a workflow pauses and requires manual confirmation before proceeding, you receive an interactive message in Slack that lets you approve or decline without switching tools. This keeps high-impact automated actions under human control while reducing the friction of acting on them.
Platform | Platform Services
New REST API serves support archives
You can use a new REST API to retrieve support archives for OneAgent and ActiveGate components.
OneAgent endpoints:
GET /platform/fleet-management/v1/oneagent/support-archives/{smartscape-node-id}POST /platform/fleet-management/v1/oneagent/support-archives/{smartscape-node-id}DELETE /platform/fleet-management/v1/oneagent/support-archives/{smartscape-node-id}/{support-archive-id}GET/platform/fleet-management/v1/oneagent/support-archives/{smartscape-node-id}/{support-archive-id}GET/platform/fleet-management/v1/oneagent/support-archives/{smartscape-node-id}/{support-archive-id}:download
ActiveGate endpoints:
-
GET/platform/fleet-management/v1/activegate/support-archives/{smartscape-node-id} -
POST /platform/fleet-management/v1/activegate/support-archives/{smartscape-node-id} -
DELETE /platform/fleet-management/v1/activegate/support-archives/{smartscape-node-id}/{support-archive-id} -
GET/platform/fleet-management/v1/activegate/support-archives/{smartscape-node-id}/{support-archive-id} -
GET/platform/fleet-management/v1/activegate/support-archives/{smartscape-node-id}/{support-archive-id}:download
Platform | Search
Find your entities faster with type-specific search categories
Dynatrace search now returns a focused result set for every entity type in your environment. Hosts, services, frontends, Kubernetes clusters, processes, containers, and cloud resources each appear in their own category, so you can scan straight to the entity type you need. Select any of the results to open the recommended app for that entity. Dynatrace handles the navigation for you.
This experience activates automatically on latest-Dynatrace environments. The classic entity search continues to work in Dynatrace Classic, and it automatically activates when you upgrade to the latest Dynatrace.
Platform | Segments
Ready-made segments for primary Grail fields
 Segments now produces a curated set of ready-made segments based on primary Grail fields, enabling zero-configuration analysis from the moment you open any observability app.
Ready-made segments let you instantly scope your data by common dimensions, such as Kubernetes clusters, namespaces, host groups, and other primary Grail fields.
No action is required from your side to benefit from them. Ready-made segments appear automatically in your list of segments in settings and in the segment selector across all supported apps.
Platform | Settings
Review customized settings in Settings
You can now navigate configuration hierarchies in Settings and easily understand where customized settings that override global configurations are placed in your environment. New capabilities include:
- The ability to reset settings to parent defaults, including removing all custom settings.
- Top-down filtering to identify which child scopes have customized configurations.
Platform | Settings
Platform API for settings
The Settings API is fully aligned with our latest Platform API standards. It gives you a single, consistent endpoint to access and manage all your Settings 2.0 data, with a cleaner, more predictable developer experience.
- One API, every setting. Read and modify all settings objects through a single, standards-aligned interface instead of stitching together multiple endpoints.
- Modern, IAM-only permissions. Move away from legacy role-based permissions to the Platform's standard authorization model.
- Address settings by Smartscape identifiers. Scope and target settings using Smartscape node identifiers, aligning settings management with the Smartscape model.
- Migrate on your own schedule. The existing Environment API for settings remains unchanged for at least one year, so you can adopt the new API on your own schedule. New SDKs are available to help you get started.
Platform | Smartscape
See service-to-database calls in the service dependency graph
We've extended the Smartscape service dependency graph with database nodes. You can now follow calls from a service straight to the database it hits, giving you visibility into your data layer without leaving the topology view.
Platform | Smartscape
New node types in Smartscape
Smartscape now includes three new node types, ACTIVE_GATE, ZREMOTE, and SYNTHETIC_ENGINE. These give you full visibility into your monitoring infrastructure and its relationships. Self-monitoring metrics sent by ActiveGate now also carry a Smartscape node ID dimension with the keys dt.smartscape.activegate, dt.smartscape.synthetic_engine, and dt.smartscape.zremote, making it easier to correlate metrics directly with the corresponding node.
Platform | Workflows
New workflow actions for working with documents
You can now use workflow actions to create, update, read, or delete documents stored in the documents store, such as dashboards or notebooks.
Threat Observability | Security events
Security insights directly in agentic-workflow context
New security MCP tools for Dynatrace Assist bring vulnerability, risk, and threat context directly into your agentic workflows, so your team can understand and act on security exposure without leaving the tools and pipelines they rely on every day.
Breaking changes
Application Observability | Distributed Tracing
Distributed Tracing now uses Smartscape for all queries
Distributed Tracing and the failure and response time analysis in Services now use Smartscape on Grail. The classic entities utilizing legacy dt.entity.* attributes are automatically replaced by dt.smartscape.* attributes.
Make sure to update your external links and bookmarks to Distributed Tracing. For a detailed overview of how the fields changed in our documentation.
Rollout begins July 20th, when the Services will also switch to Smartscape-based services.
Digital Experience | Synthetic
One-time migration from management zones to security contexts
If your environment was created before January 2026, Dynatrace performs a one-time migration of the management zone each synthetic monitor belongs to, mapping them to security context values with the same name on that monitor. The existing grouping structure is preserved without requiring manual reassignment.
After the migration takes place,
-
You must assign the new platform permissions to use security contexts as the basis for scoped permissions. To learn more about assigning and managing security context, see Access control for Synthetic Monitoring.
-
Updating or creating management zones and monitors won’t be synchronized.
Classic permissions, such as View environment, Manage monitoring settings, are not affected. You can continue to access via Synthetic, Synthetic Classic, and Synthetic API v2. No action is required.
Infrastructure Observability | Infrastructure & Operations
ActiveGate token management API for Latest Dynatrace
A new REST API for managing ActiveGate tokens is now available.
- Start using the
/platform/fleet-management/v1/activegate/tokensendpoints instead of/api/v2/activeGateTokens. - Make sure to change authorization to platform tokens with
fleet-management:activegate.tokens:*scopes.
Infrastructure Observability | Infrastructure & Operations
New REST API for host-based ActiveGate deployment
A new REST API is now available for deploying the ActiveGate installer and retrieving connection information. Unlike the classic API, this API supports non–preconfigured installers, enabling deployment without environment-specific preconfiguration.
Platform | OneAgent
sku renamed to host.type
The field sku was renamed to host.type for HOST entities in Smartscape on Grail. Change any queries using sku to host.type.
To learn more, see Semantic Dictionary - Compute fields.
Platform | Problems
Closed problems no longer reopen
Resolved closed problems remain closed even after related events are detected. If new related events occur, Dynatrace Intelligence creates a new problem instead. This makes problem tracking more predictable and consistent.
Fixes and maintenance
Resolved issues in this release (SaaS)
- Removed Account UUID as a filter option on the OAuth2 clients management page, as it was not supported and did not filter results correctly. (PS-45780)
- The field
skuwas renamed tohost.typeforHOSTentities in Smartscape on Grail. (OA-68029) - Fixed an issue so that now the Deploy Dynatrace ActiveGate page also adapts the file name and installation commands according to the ActiveGate target version. (MGD-13588)
- Fixed data loading issue with the index table. (INFOBS-10800)
- Fixed menu for the last and first time seen on the inventory table in Clouds. (INFOBS-10788)
- Fixed Databases behavior that caused erratic scrolling in tables with a large number of statements. (INFOBS-10776)
- Rule names displayed in settings tables now respect spaces. (INFOBS-10714)
- Fixed inconsistent usage of hyphens for empty cells in Infrastructure & Operations tables. (INFOBS-10712)
- Fixed host metrics for EC2 that were not visible in the Inventory Explorer table in Databases. (INFOBS-10709)
- Fixed onboarding navigation behavior where database instances could be added without selecting an ActiveGate. (INFOBS-10707)
- The Databases extension table now shows the installed extension version as defined by the active monitoring configuration. (INFOBS-10135)
- Fixed an intermittent error preventing the editing of sensitive data masking rules in the log module configuration widget. (ICP-5834)
- Fixed an issue where anomaly detector settings could fail to sync when the record-based analyzer configuration contained placeholders. (DI-29633)
- Added missing scopes for segments. (DEM-29378)
- Implemented a fix to prevent crashes when a mobile native session is opened if it has Session Replay content. (DEM-28924)
- Fixed the view waterfall intent that was not working correctly. (DEM-28808)
- Updated
Booleanvariable handling for the Data Transfer Object. (DEM-28647) dt.probleminformation is no longer available by default in the Users & Sessions Intent Explorer. (DEM-28228)- Allowed sessions and events from custom buckets in Users & Sessions. (DEM-28198)
- Fixed user interaction events to report
interaction.nameasinteraction.type. (DEM-28082)