Calculate your consumption of Database Monitoring (DPS)
- Latest Dynatrace
- Explanation
- 5-min read
- Published May 08, 2026
- Preview
Database Monitoring is currently available via the preview program. To request access, see Preview program
Database Monitoring provides visibility into query plans, waits, indexes, and schema details for monitored database instances.
This page explains how Database Monitoring consumption is calculated and how you can manage your spend in Dynatrace.
How consumption is calculated
Database Monitoring consumption is measured in database-instance-hours, using the Database Monitoring rate card item.
Key terms
- Database instance
A database instance is any instance monitored with Database Monitoring that hosts one or more databases.
It is identified by host, port, and database name.
- Normalized database query
Queries that run on your database, and have the same structure but differ only in their parameters, are combined by Dynatrace into one pattern.
This pattern is called a normalized database query.
Dynatrace Query Language (DQL) queries are a separate concept and won't incur Database Monitoring consumption.
Counting rules and exceptions
Billing is based on the number of database instances that are monitored, and the number of normalized database queries that run on these databases. It does not matter how many databases run on each database instance. The more database instances you monitor, the more database-instance-hours you consume.
Database Monitoring applies only to databases monitored by the PostgreSQL extension or MySQL extension.
For other SQL extensions, billing is based on Metrics powered by Grail.
As an example, the following monitoring configuration shows two separate database instances in Dynatrace.
"sqlMySqlRemote": {"endpoints": [{"host": "mysql-host-1.company.com","port": 3306,"databaseName": "dynatrace"},{"host": "mysql-db.us-east-1.rds.amazonaws.com","port": 1521,"databaseName": "serviceName"}]}
A single physical or virtual machine can host multiple database instances. In such a case, each database instance is billed separately.
Billing granularity and bundled functionality
Dynatrace is built for elastic cloud-native environments where services, including database instances, are often short-lived. Therefore, billing granularity for Database Monitoring is based on 15-minute intervals. When a database instance is monitored for fewer than 15 minutes in an interval, consumption is rounded up to the next full 15-minute interval.
Each monitored database instance includes 1,000 normalized database queries per 15-minute interval at no additional cost. Every 1,000 normalized database queries above the included 1,000 are billed as 0.25 database-instance-hours within the 15-minute interval.
Included normalized database queries that are not consumed within the 15-minute interval do not roll over to subsequent intervals. The included quota is specific to each instance and cannot be used by other database instances.
By default, Database Monitoring captures only the top 1,000 normalized database queries, ranked by total execution time, per monitored database instance. As a result, normalized database queries will not be billed unless you manually increase the number of captured queries.
Calculation example
In the following example, two database instances are billed in 15-minute intervals. A total of 2.25 database-instance-hours are consumed in the four 15-minute intervals.
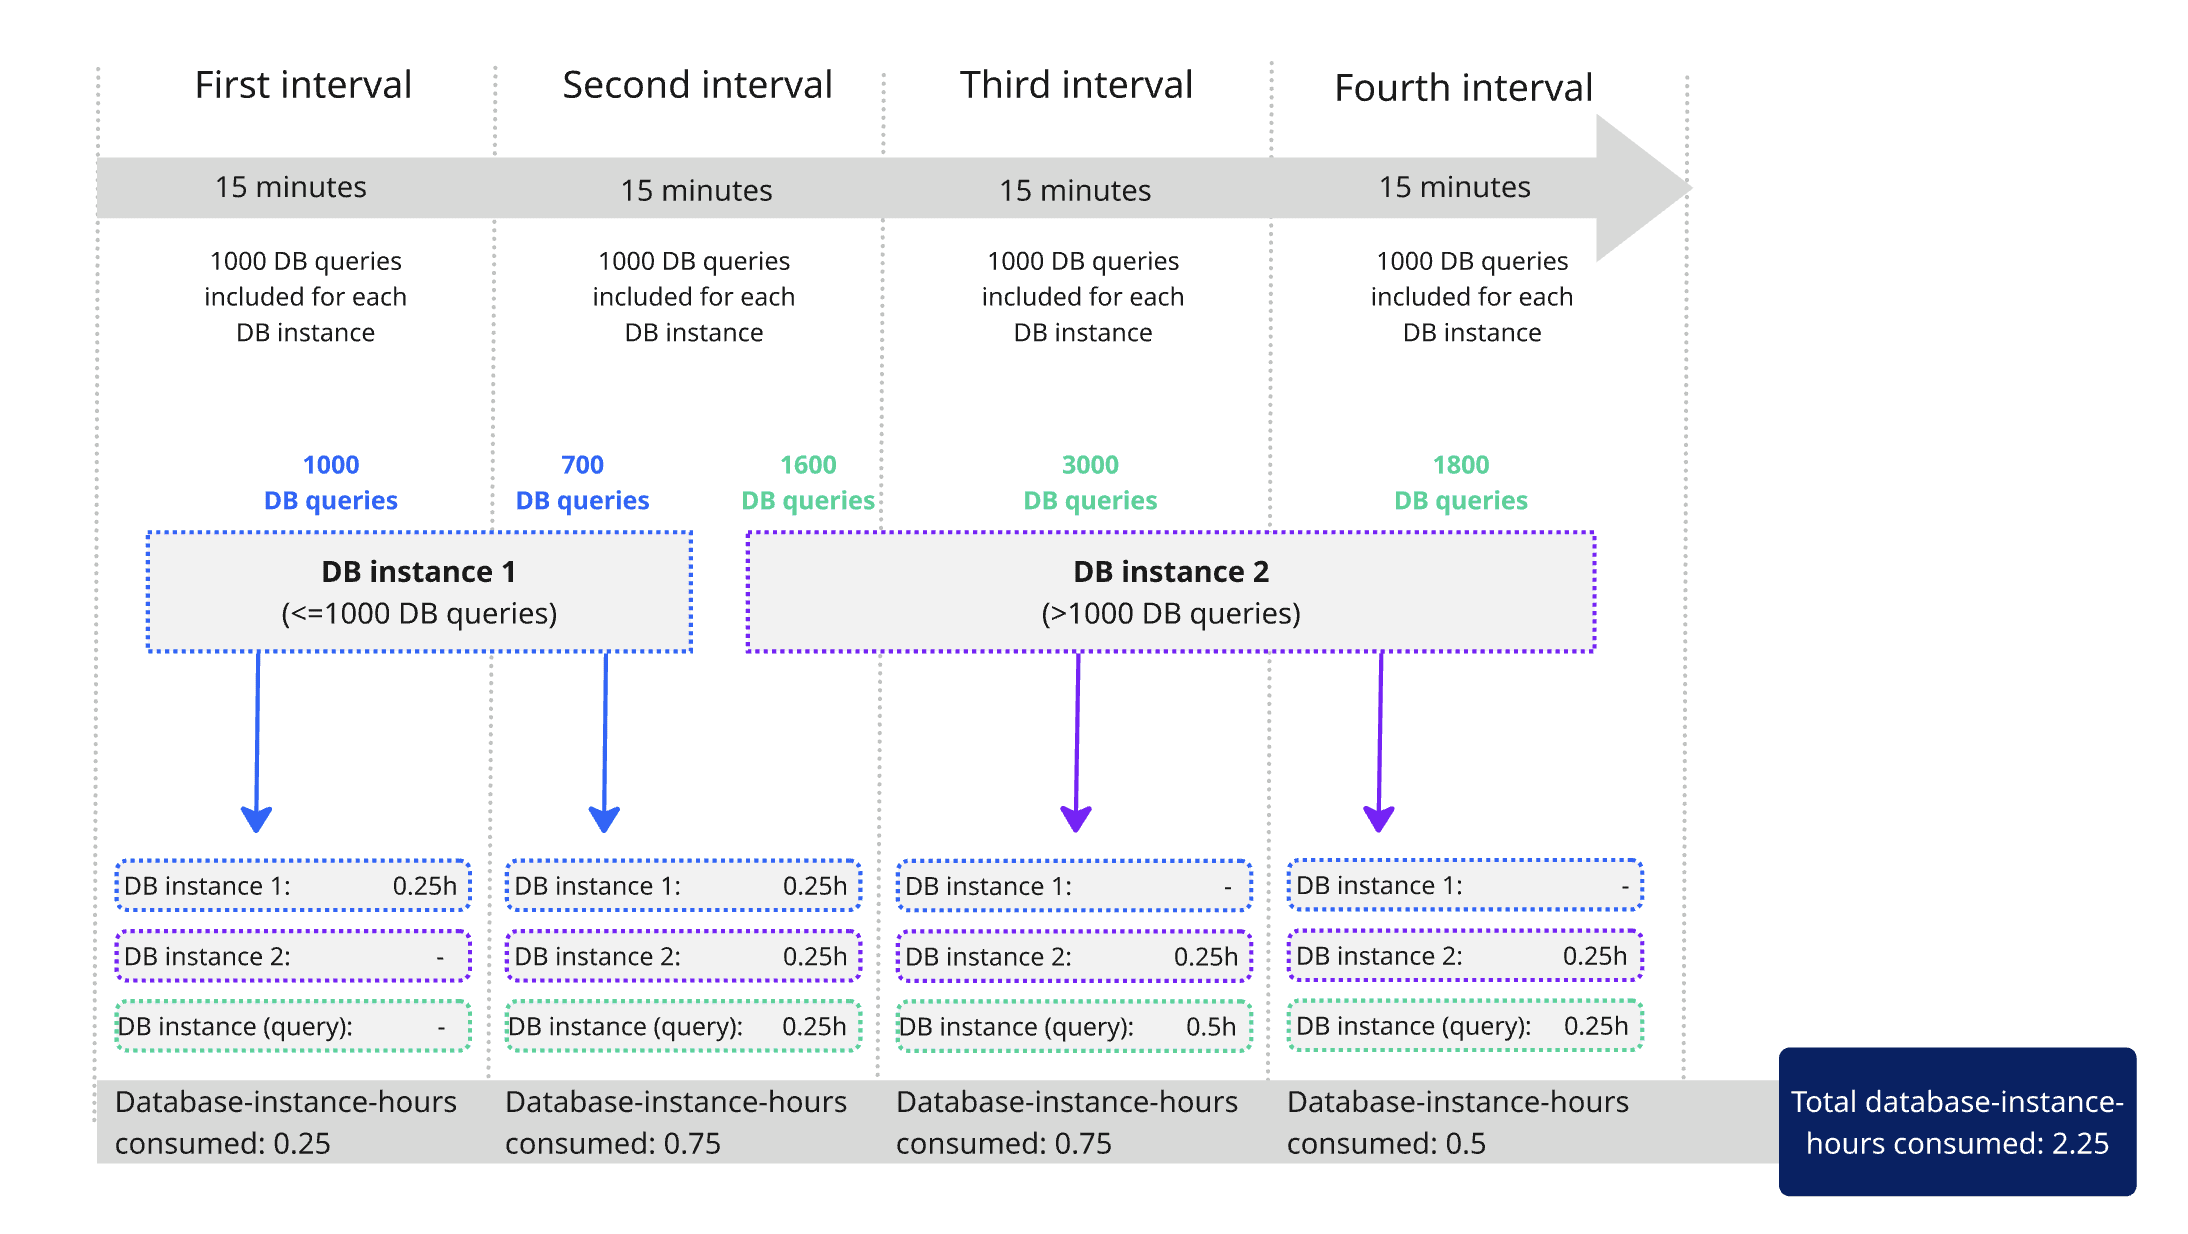
The database instances are billed as follows:
-
Database instance 1 (default configuration):
- Database monitoring is active for two 15-minute intervals. Each interval is billed the base rate of 0.25 database-instance-hours per interval.
- In each 15-minute interval, monitoring includes ≤1,000 normalized database queries. There are no charges for query overages.
- Calculation: Two 15-minute intervals × 0.25 database-instance-hours = 0.5 database-instance-hours billed.
-
Database instance 2:
-
Database monitoring is active for three 15-minute intervals. Each interval is billed the base rate of 0.25 database-instance-hours per interval.
-
In each 15-minute interval, monitoring includes >1,000 normalized database queries.
Each interval is charged for its respective query overages, at the rate of 0.25 database-instance-hours per 1,000 overage queries:
- Second interval: The overage is 600 queries, so this interval is billed an additional 0.25 database-instance-hours.
- Third interval: The overage is 2,000 queries, so this interval is billed an additional 0.50 database-instance-hours.
- Fourth interval: The overage is 800 queries, so this interval is billed an additional 0.25 database-instance-hours.
-
Calculation: (Three 15-minute intervals × 0.25 database-instance-hours) + 1.00 database-instance-hours = 1.75 database-instance-hours billed.
-
Estimate your cost
The following example shows how Dynatrace calculates Database Monitoring costs.
For simplicity, this example assumes that:
- Calculations are based on a list price of $0.11 per database-instance-hour, see Dynatrace pricing. This may differ from your rate card price.
- One month is equivalent to 30 days.
- The database is monitored 24 hours per day.
100 database instances × $0.11 × 24 hours × 30 days = $7,920 per month
Understand your consumption
Dynatrace provides various options to help you understand and analyze your organization's consumption of Database Monitoring.
Insights via Account Management
You can view your usage in Account Management. Go to Account Management > Subscription > Overview, and then scroll down to the Cost and usage details section to see your total usage. You can filter the data by DPS capability and environment.
From here, you can access a pre-made notebook to explore your usage of a specific capability and environment in detail.
- In the capability table, select View details next to the capability that you want to explore.
- In the Environment table, select > Open details with Notebooks.
Insights via billing usage events
Billing usage events (BUEs, billing_usage_event) are system events emitted by Dynatrace into the dt.system.events data space.
About billing usage events
Billing usage events contain:
- Which DPS capability was consumed.
- The usage amount that contributes to billing.
- The time window the usage belongs to.
- The entity context the usage is attributed to.
You can use billing usage events as the authoritative source when building cost allocation, usage analysis, or cost transparency views.
BUEs represent already-calculated, billable usage for DPS capabilities (not any configuration or potential usage). They align with what Account Management displays and what appears on invoices, so they are the recommended data source for understanding related consumption.
Query billing usage events with DQL
You can use DQL to query BUEs, and analyze usage and cost for Database Monitoring without re-applying billing rules or session-counting logic.
Here are some example DQL queries for various use cases. You can use these queries as-is, or modify them to meet your needs.
-
Get the number of instances monitored for the last 24 hours.
fetch dt.system.events, from: now() - 24h| filter event.kind == "BILLING_USAGE_EVENT" and event.type == "Database Monitoring"| summarize `Last 24h consuming Database-instances` = countDistinct(dt.smartscape_source.id) -
Show a trend of the number of database-instance-hours consumed daily.
fetch dt.system.events| filter event.kind == "BILLING_USAGE_EVENT" and event.type == "Database Monitoring"| makeTimeseries { `Total database-instance-hours` = sum(`database-instance-hours`, default:0) }, time:usage.start, interval:24h -
Get a list of database instances that consume the most database-instance-hours.
fetch dt.system.events| filter event.kind == "BILLING_USAGE_EVENT" and event.type == "Database Monitoring"| summarize `Total database-instance-hours` = sum(`database-instance-hours`), by: {smartscape.id = dt.smartscape_source.id,smartscape.type = dt.smartscape_source.type,dt.cost.costcenter,dt.cost.product}| fields smartscape.id, smartscape.type, `Total database-instance-hours`, dt.cost.costcenter, dt.cost.product| sort `Total database-instance-hours` desc -
Get a line chart that shows the five database instances that have consumed the most within the last 15 days.
You can query a maximum time period of 15 days. Otherwise, the database query limits cannot be displayed in 15-minute intervals.
fetch dt.system.events, from: now() - 15d| filter event.kind == "BILLING_USAGE_EVENT" and event.type == "Database Monitoring"| makeTimeseries database_queries = sum(database_queries), by:{dt.smartscape_source.id}, time:usage.start, interval:15m| sort database_queries desc| limit 5| filterOut interval > 15m
Use Cost Allocation
You can use Cost Allocation to allocate your Database Monitoring consumption to specific products or cost centers. Add Cost Allocation tags either as part of creating a new database instance, or add them to an existing database instance.
As part of creating a new database instance:
- Go to
 Databases > Overview > Add DB Instance > Define metadata and context.
 - For Product or Cost center, enter the appropriate Cost Allocation tag.
Add to an existing database instance:
- Go to Databases > Recommendations > Manage extensions.
- Select the appropriate extension for your database instance.
- In the monitoring configurations table, find the instance that you want to edit and then select > Edit.
- Select Next until you get to the Attributes section.
- For Product or Cost center, enter the appropriate Cost Allocation tag as appropriate.
- Select Save and then Close.
Optimize your consumption
Two main factors influence Database Monitoring consumption:
- The number of database instances monitored.
- The number of normalized database queries that exceed the included quota.
The default limit of 1,000 normalized database queries per database instance is included in your quota at no extra cost. Unless you have a specific need to capture more, keeping this default is the easiest way to control your Database Monitoring costs.
Frequently asked questions
What unit is used to measure Database Monitoring consumption?
Consumption is tracked in database-instance-hours. The longer an instance is monitored, the more you consume.
How does Dynatrace identify a database instance?
By a combination of host, port, and database name. Even if two instances live on the same machine, they're counted and billed separately.
What is the smallest time unit that I will be billed for?
15 minutes. If your instance is monitored for even one minute within a 15-minute window, consumption rounds up to the full interval.
Will I be charged extra for normalized database queries?
Not unless you've manually raised the capture limit. Each instance includes 1,000 normalized database queries per 15-minute interval at no extra cost. Beyond that, every additional 1,000 queries adds 0.25 database-instance-hours.
Will I be changed extra for usage of Databases, especially DQL queries related to monitored databases?
Databases, especially DQL queries related to monitored databases?No.
Databases usage is included with Database Monitoring, and doesn't generate any DQL query consumption.
However, running DQL queries outside of Databases can result in consumption of Log Analytics - Query.
What is the simplest way to keep costs down?
Use the default query capture limit of 1,000 per instance, which is included in your quota. If you need to go beyond this, review which instances are actively monitored and remove any that are not required.