Monitor Azure services with Azure Monitor metrics
- How-to guide
- 13-min read
Follow this guide to start ingesting data remotely from Azure Monitor.
This guide focuses on infrastructure monitoring of Azure services, specifically the monitoring of Azure cloud services via Azure Monitor. See What's next for Full-Stack and Log Monitoring of your Azure services.
Alternatively, you can configure your Dynatrace SaaS environment using Azure Marketplace.
After you established the initial monitoring, you can add, remove, or modify service monitoring the Dynatrace web UI or, at scale, with the Dynatrace API.
To learn the measurements collected for each of the Azure services, see:
The infrastructure monitoring of Azure services provides metrics from Azure Monitor and infrastructure data available via public Azure API. The data is collected in five-minute intervals.
Cost of monitoring
Factors that contribute to the cost of monitoring Azure with Dynatrace via Azure Monitor:
- Each service monitored by Dynatrace through Azure Monitor, as well as log processing and analysis, causes the consumption of Davis data units.
- Microsoft may charge you extra for Azure Monitor metric queries if you exceed 1 million API calls monthly. For the details on these additional costs, please consult Microsoft online documentation.
- For details regarding the metric ingest costs, see Metrics powered by Grail overview (DPS).
Monitoring prerequisites
There are three prerequisites for Azure monitoring setup:
To manage Azure monitoring configuration, you need the Change monitoring settings permission in Dynatrace. You can Change monitoring settings permission at the environment or management-zone level.
To monitor Azure services, Dynatrace needs to connect to the Azure Monitor API and query it every 5 minutes. At least one ActiveGate needs to be able to connect to Azure Monitor to perform the monitoring tasks.
To check for the existence of a suitable ActiveGate
-
Go to Deployment Status > ActiveGates.
-
Set a filter for
With modules: Azure.- If the resulting list is empty, you need to add at least one ActiveGate with the cloud monitoring module enabled
- If the list is not empty, you are ready to activate Azure monitoring
To add an ActiveGate that is capable of cloud monitoring, follow the ActiveGate installation guide and resume this guide when done.
Allow ActiveGate to access Azure URLs
The integration accesses the following Azure API endpoints, so they must be accessible from your ActiveGate:
https://management.azure.com/
https://login.microsoftonline.com/
https://management.core.windows.net/
The most frequent cause of certificate issues with TLS interception proxy is a missing proxy's CA certificate in ActiveGate truststore. If you're still having proxy issues, see:
Make sure that the URLs are whitelisted. Otherwise, you might get communication or timeout errors.
To perform these steps, you need to have Azure admin privileges.
Azure monitoring is performed remotely via Azure Monitor APIs that are created and exposed by Microsoft. Dynatrace needs to be able to access these APIs, so you need to configure Azure to allow for such access. You need the following:
- Sufficient permissions to register an application with your Azure AD tenant and assign the application to a role in your Azure subscription
- An Azure service principal to access Azure APIs
For Dynatrace to monitor your services, you need at least reader permissions. The steps below describe adding the service principal reader permissions and refer to a common, single-tenant access approach. Before that, we recommend getting familiar with our recommendations regarding how to configure Azure service principal to avoid Azure throttling limits.
Dynatrace integration for Azure supports Azure Lighthouse, which allows Dynatrace to have multi-tenant access to Azure.
-
Go to your Azure CLI 2.0 terminal.
-
Run the following command to list all the subscriptions so that you can select the one you want to add permissions for.
az account list --output table -
Copy the following command and edit it to replace the placeholders with actual values as described below.
az ad sp create-for-rbac --name <YourServicePrincipalName> --role reader --scopes /subscriptions/<YourSubscriptionID1> /subscriptions/<YourSubscriptionID2> --query "{ClientID:appId,TenantID:tenant,SecretKey:password}"Be sure to replace the placeholders (
<...>) with your values:<YourServicePrincipalName>- a name of the service principal that will be created for Dynatrace to access Azure<YourSubscriptionID1>,<YourSubscriptionID2>- names of subscriptions listed in the previous step to which you want Dynatrace to have access.
-
Run the edited command.
-
Copy the credentials that are output from the command and save them for later.
Other options for required permissions
Another way to get reader permission is to create a custom role for Dynatrace with a predefined set of permissions for fine-grained control.
-
Create a custom role by following the Microsoft guide. You can use the following JSON template as a base for the permissions:
{"properties": {"roleName": "dynatrace-monitoring-role","description": "","assignableScopes": [],"permissions": [{"actions": ["Microsoft.Aadiam/*/read","Microsoft.AnalysisServices/*/read","Microsoft.ApiManagement/*/read","Microsoft.Automation/*/read","Microsoft.Batch/*/read","Microsoft.BotService/*/read","Microsoft.Cache/*/read","Microsoft.Cdn/*/read","Microsoft.ClassicCompute/*/read","Microsoft.ClassicStorage/*/read","Microsoft.CognitiveServices/*/read","Microsoft.Compute/*/read","Microsoft.ContainerInstance/*/read","Microsoft.ContainerRegistry/*/read","Microsoft.ContainerService/*/read","Microsoft.DataFactory/*/read","Microsoft.DataLakeAnalytics/*/read","Microsoft.DataLakeStore/*/read","Microsoft.DBforMySQL/*/read","Microsoft.DBforPostgreSQL/*/read","Microsoft.Devices/*/read","Microsoft.DocumentDB/*/read","Microsoft.EventGrid/*/read","Microsoft.EventHub/*/read","Microsoft.HDInsight/*/read","Microsoft.Insights/*/read","Microsoft.KeyVault/*/read","Microsoft.Kusto/*/read","Microsoft.Logic/*/read","Microsoft.MachineLearningServices/*/read","Microsoft.Maps/*/read","Microsoft.Media/*/read","Microsoft.NetApp/*/read","Microsoft.Network/*/read","Microsoft.NotificationHubs/*/read","Microsoft.OperationalInsights/*/read","Microsoft.PowerBIDedicated/*/read","Microsoft.RecoveryServices/*/read","Microsoft.Relay/*/read","Microsoft.Search/*/read","Microsoft.ServiceBus/*/read","Microsoft.SignalRService/*/read","Microsoft.Sql/*/read","Microsoft.StreamAnalytics/*/read","microsoft.storagesync/*/read","Microsoft.TimeSeriesInsights/*/read","microsoft.web/*/read","Microsoft.DBforMariaDB/*/read","Microsoft.DataBoxEdge/*/read","Microsoft.IoTCentral/*/read","Microsoft.Blockchain/*/read","Microsoft.MixedReality/*/read","Microsoft.EnterpriseKnowledgeGraph/*/read","Microsoft.AppConfiguration/*/read","Microsoft.DataShare/*/read","Microsoft.ServiceFabricMesh/*/read","Microsoft.VMwareCloudSimple/*/read","Microsoft.Peering/*/read","Microsoft.HealthcareApis/*/read","Microsoft.CustomProviders/*/read","Microsoft.StorageCache/*/read","Microsoft.AppPlatform/*/read","Microsoft.ProjectBabylon/*/read","Microsoft.Synapse/*/read","Microsoft.DigitalTwins/*/read","Microsoft.AVS/*/read","Microsoft.DataCollaboration/*/read","Microsoft.SecurityDetonation/*/read","Microsoft.Purview/*/read","Microsoft.Management/*/read/","Microsoft.ResourceGraph/*/read/"],"notActions": [],"dataActions": [],"notDataActions": []}]}} -
Go to your Azure CLI 2.0 terminal.
-
Run the following command to list all the subscriptions so you can select the one for which you want to add permissions.
az account list --output table -
Copy the following command and edit it to replace the placeholders with actual values as described below.
az ad sp create-for-rbac --name <YourServicePrincipalName> --role <YourCustomRole> --scopes /subscriptions/<YourSubscriptionID1> /subscriptions/<YourSubscriptionID2> --query "{ClientID:appId,TenantID:tenant,SecretKey:password}"Replace the placeholders (
<...>) with your values:<YourServicePrincipalName>- the name of the service principal that will be created for Dynatrace to access Azure<YourCustomRole>- the name of the role you have created for Dynatrace<YourSubscriptionID1>,<YourSubscriptionID2>- names of subscriptions listed in the previous step (subscriptions that you want Dynatrace to have access to)
-
Run the edited command.
-
Copy the credentials that are output from the command and save them for later.
To create a service principal in Azure Portal, you must register your application in the Microsoft Entra ID and grant access permissions for your service principal.
To register your application
-
Go to the Azure Management Portal and select Microsoft Entra ID.
-
Copy the value of Tenant ID and save it as
Tenant IDfor future retrieval. This is required to configure Dynatrace to connect to your Azure account. -
Select App registrations in the navigation pane of the selected Active Directory.
-
Select New registration at the top of the App registrations blade and type the name of your application.
-
Leave all other settings with their default values and select Register.
-
Copy the value of Application (client) ID and save it as
Client IDfor future retrieval. -
Select Certificates & secrets > New client secret to create a new security key.
-
Enter a key description, choose the desired key duration, and then select Add to save the new key.
-
Copy the value of Value and save it as
Secret Keyfor future retrieval.You can't retrieve the key value after you leave the Key blade.
To grant access permissions for your service principal
- In Azure Portal, select All services > General > Subscriptions.
- On the Subscriptions page, select your subscription and then select Access control (IAM).
- Select Add role assignment and select Reader.
- Select Next.
- In Members, enter the following data:
- For Assign access to, select
User,group, orservice principal. - For Members, select Select members and then select your service principal from the list on the left.
- For Assign access to, select
- Select Next, and then select Review + assign.
To create a new service principal and grant it access permissions in PowerShell, see Create an Azure service principal with Azure PowerShell.
If you choose to create a custom role, see Create custom role via Azure CLI 2.0.
Create monitoring configuration
You can create, activate, and manage multiple monitoring connections. Each connection is defined by the credentials and/or access tokens required for Dynatrace to be able to pull in the data, as well as the actual scope of monitoring.
Allowing for multiple connections and configurations makes it possible to monitor even extremely complex environments. With such an approach, you don't need to configure everything at once. Instead, you can gradually add monitoring configurations to your existing setup. Such an architecture also makes it easy to react to the dynamic changes of the monitored environment, without the need to reconfigure the unaffected elements.
If you have followed all of the previous steps, you are ready to configure Azure monitoring.
To add a new Azure connection
-
Go to Settings > Cloud and virtualization > Azure. The page lists Azure connections already configured.
If you haven't provided an ActiveGate required for Azure monitoring (check Prerequisites for details), the respective information will be provided on the screen and you will not be able to continue with the configuration process.
You can go back and change the already configured connections at a later time.
- Go to Settings > Cloud and virtualization > Azure. The page lists existing connections.
- Edit connections as needed.
- To edit an existing connection or the monitored services within, select Edit
 in that row.
 - To delete an existing connection, select Delete
 in that row.
- To edit an existing connection or the monitored services within, select Edit
-
Select Connect new instance and complete the configuration fields.
-
Connection ID—type a descriptive name for the connection.
-
Client ID and Tenant ID—enter the values obtained when creating the Azure service principal.
If you created the Azure service principal in PowerShell, set Client ID to the
ApplicationIdvalue. -
Secret Key—obtained when creating the Azure service principal.
You can limit the data captured from the Azure Monitor by defining a tag-based filter of specific resources.
You can choose to monitor resources based on existing Azure tags, as Dynatrace automatically imports them from service instances.
To monitor resources based on tags-
Go to Settings > Cloud and virtualization > Azure.
-
On the Azure overview page, select the Edit
icon for the Azure instance. -
Set Resources to be monitored to Monitor resources selected by tags.
-
Enter key/value pairs to identify resources to exclude from monitoring or include in monitoring. You can enter multiple key/value pairs: each time you enter a pair, another empty row is displayed for you to edit as needed.
-
Select Save to save your configuration.
To import the Azure tags automatically into Dynatrace, turn on Capture Azure tags automatically.
Optionally, you can turn off automatic tag import. If turned on, resource tags will be imported, but resource group tags will not be imported.
-
-
-
Select Connect to add the connection information to the list of Azure connections.
There is a limit of 20 entries for either Include or Exclude tags.
You can choose to monitor resources based on existing Azure tags, as Dynatrace automatically imports them from service instances.
To monitor resources based on tags
-
Go to Settings > Cloud and virtualization > Azure.
-
On the Azure overview page, select the Edit
icon for the Azure instance. -
Set Resources to be monitored to Monitor resources selected by tags.
-
Enter key/value pairs to identify resources to exclude from monitoring or include in monitoring. You can enter multiple key/value pairs: each time you enter a pair, another empty row is displayed for you to edit as needed.
-
Select Save to save your configuration.
To import the Azure tags automatically into Dynatrace, turn on Capture Azure tags automatically.
After Dynatrace connects to your Azure environment, it immediately starts monitoring Azure's built-in services for the service principal you have defined. Classic (formerly 'built-in') Azure metrics lists the metrics of Azure cloud services monitored by default.
In addition to Azure cloud services that are monitored by default, it is also possible to monitor all other Azure cloud services. Azure cloud services are enabled for monitoring per Azure connection.
To add a service to monitoring
- Go to Settings > Cloud and virtualization > Azure.
- On the Azure overview page, find the connection that you want to change and select Edit in that row.
- Under Services, select Manage services.
- Select Add service.
- Select the service from the list and then select Add service.
- Select Save changes to save your configuration.
You can add multiple cloud services by repeating the steps above.
After you add a service, Dynatrace automatically starts collecting a set of metrics for this particular service.
Recommended metrics:
- Enabled by default
- Can not be disabled
- Can come with recommended dimensions (enabled by default, can't be disabled)
- Can come with optional dimensions (disabled by default, can be enabled)
Apart from the recommended metrics, most services have the possibility of enabling optional metrics that can be added and configured manually.
To see the complete list of Azure cloud services and learn about the metrics collected for each of them, see All Azure cloud services.
You can check the list of supported Azure services in Dynatrace Hub. You can also access Dynatrace Hub from your monitoring environment and search for "Azure."
- Go to Settings > Cloud and virtualization > Azure.
- On the Azure overview page, find the connection that you want to change and select Edit in that row.
- Under Services, select Manage services.
- Select the service for which you want to add metrics. The service details page lists metrics you are monitoring for that service.
- Select Add metric.
- From the Add new metric list, select the metric and then select Add metric.
- Select
 to expand the metric details and configure the metric.
 - Select Apply to save your configuration.
After you select the cloud services and save your changes, monitoring of the newly added services starts automatically.
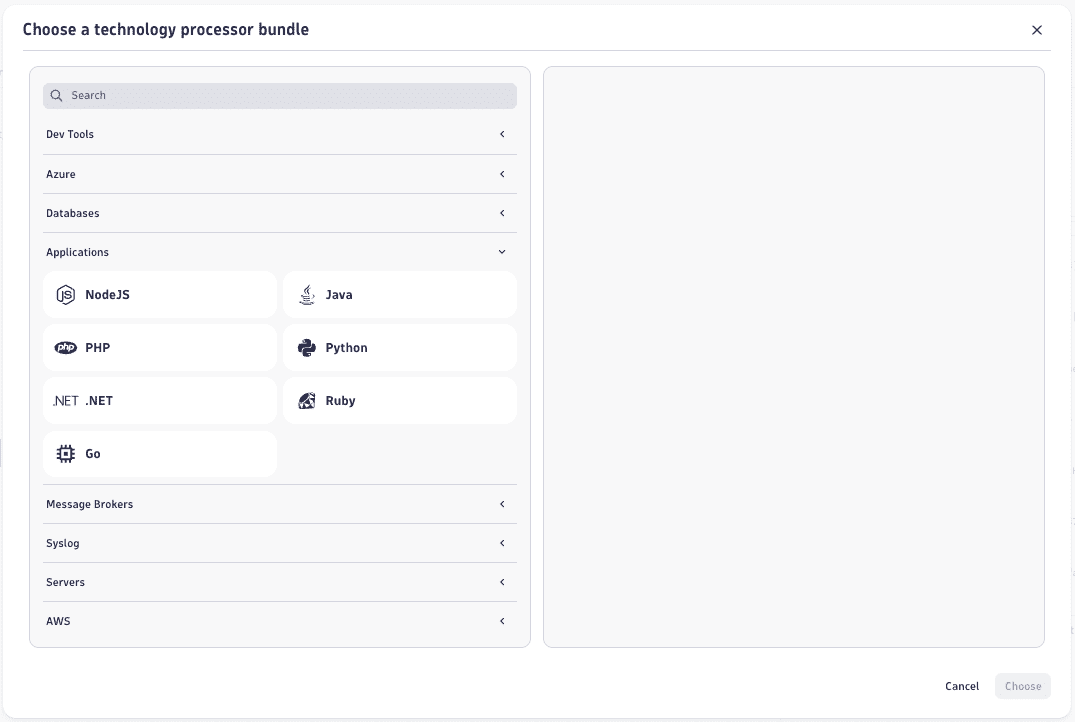
Process logs with technology bundle parsers
Through OpenPipeline, you can use and configure technology bundles. A technology bundle is a library of parsers (processing rules), that process logs from various technologies such as Java, .NET, Microsoft IIS, etc.
Parsers help you to improve filtering, troubleshooting, metrics, alerts, and dashboards by efficiently extracting log levels and relevant attributes. You can also use technology bundles to structure logs from technologies that are not supported by Dynatrace out of the box.
For more information, see Process logs with technology bundle parsers.
What's next?
Within minutes, you'll see the data on your dashboards.
To see the core measurements for each of your Azure connections
- Go to Azure Classic.
- Select the connection for which you want to see an overview of the Azure infrastructure.
You can also build your own dashboard from the metrics collected for your Azure instances. For details on building dashboards, see Dashboards Classic.
Dynatrace OneAgent offers unparalleled depth of insight into hosts, containers, and code. To learn more, see Microsoft Azure Integrations.
After you set up Azure monitoring, you can:
- Set up monitoring notifications with Azure Alerts. This enables you to apply alerts and automatically transform them into events that are leveraged by the Davis® AI causation engine for deeper insights.
- Set up metric events for alerting. This enables you to create, enable/disable, and configure recommended alerting rules.
You can also monitor Azure logs. For more information, see Azure Logs.