Dashboards Classic
- Reference
- 7-min read
- Published Sep 25, 2018
The dashboards discussed here are classic dashboards created using the dashboarding functionality integrated with previous Dynatrace. To instead learn about dashboards created with the Dashboards app in the latest Dynatrace, see Dashboards.
Each dashboard consists of tiles and visualizations that can be selected, configured, and positioned to best meet your needs. Dynatrace provides many preconfigured tiles in addition to a number of configurable tiles that you can customize to visualize the metrics that are most relevant to the people using the dashboard. Select any dashboard tile that reports on monitored entities in your environment (hosts, processes, or services) to view the list of monitored entities.
Example dashboard
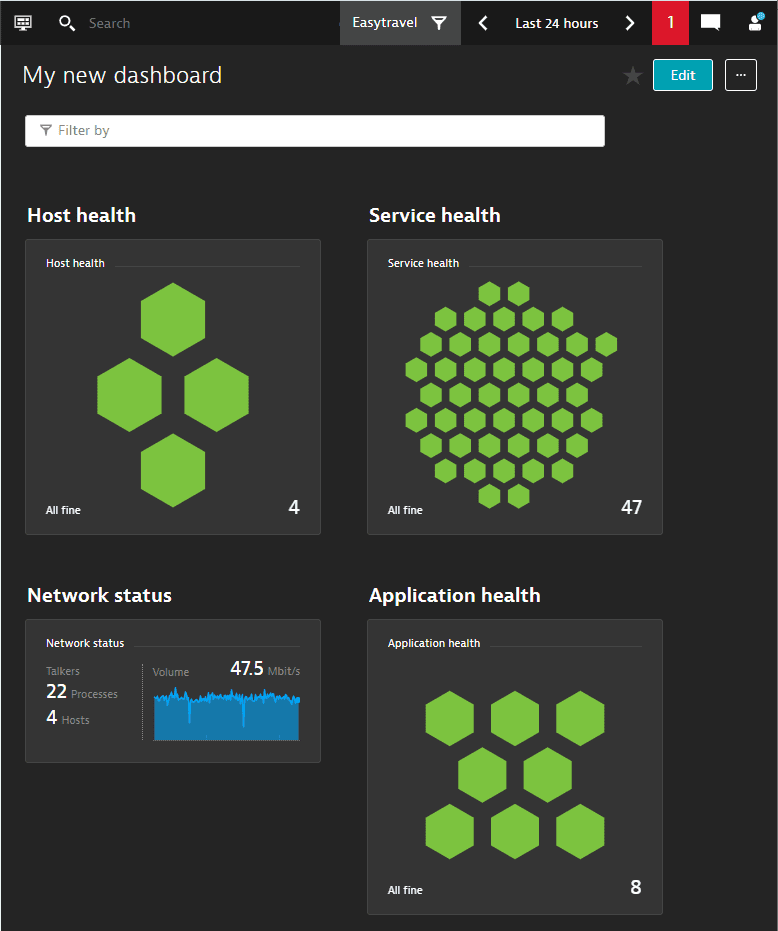
This simple example has four standard tiles.
- Everything's looking good: all green, no red, no problems.
- If you did have problems, you would see an indicator to warn you, and you could, for example, drill down from a problematic (red) host to investigate.
For more elaborate examples
- Go to
 Dashboards Classic.
 - Filter the table by
Owner: Dynatrace. - Open some of our out-of-the-box preset dashboards.
You can make different dashboards for specific people, roles, and teams, so everyone can focus on what's important to them.
- Go to
 Dashboards Classic.
 - Select any dashboard on the list to open that dashboard.
- When you open a dashboard, it becomes your current dashboard.
-
From a health tile (such as Host health, Service health, and Application health), where you see green and red elements (such as hosts, services, or applications), hover over any problematic (red) element to see the identity of the element.
-
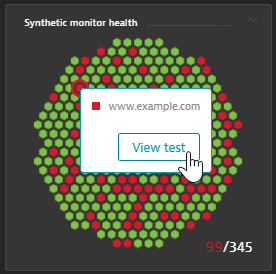
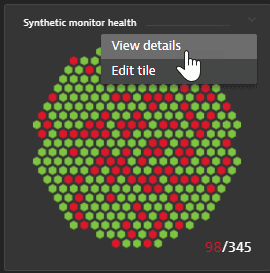
To drill down to a problematic (red) element, select the red hexagon and then select the View… button. On this example Synthetic monitor health tile, we have selected a red element, which enabled the View test drilldown button for that element.
-
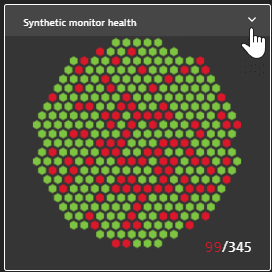
You can't drill down from a healthy (green) element. From any tile, however, you can select the menu in the upper-right corner of the tile and then select View details to display the relevant Dynatrace page for the tile. For example, View details from a Synthetic monitor health tile displays the Synthetic monitors table.
-
If you drill down from a tile, you can always select the dashboard button

in the upper-left corner of the Dynatrace web UI to return to your current dashboard. If you select the dashboard button while you're already on a dashboard, you instead go to the Dashboards page.
-
You can open several dashboards at the same time in multiple browser tabs, one dashboard per browser tab.
Dashboard tile refresh rates
Every dashboard tile is refreshed automatically to update visualized data. Depending on the content shown in a tile and especially the applied timeframe, the refresh interval can vary.
| Dashboard timeframe | Refresh interval |
|---|---|
| Last 2 hours and less | 1 minute |
| Last 2 hours to last 6 hours | 5 minutes |
| Last 6 hours to last 24 hours | 15 minutes |
| Last 24 hours to last 72 hours | 30 minutes |
| Last 72 hours and more | 1 hour |
- For heavily used environments, Dynatrace may reduce the refresh rate to prevent Dynatrace server overload.
- Unlike other tile types, an image tile is not automatically refreshed. You need to refresh a dashboard manually to update the image tiles on that dashboard.
Procedures
Use the following procedures to create and manage dashboards.
Dashboards
Dashboards consist of tiles that can have their own settings for timeframe, management zone, and sharing.
Browse and display dashboards
- Go to
 Dashboards Classic.
This lists all dashboards you are permitted to view or edit. - To list only your dashboards, set the filter to
Ownership: Mine. - To display a dashboard, select its name in the list of dashboards.
- To open multiple copies of the same dashboard, right-click the dashboard title on the Dashboards page and open the link in a new tab or window. (Alternatively, you can copy and paste the address line from a dashboard page and paste it on the address line of a different browser tab or window.)
For details on using the Dashboards table, see Organize dashboards.
List dashboards by popularity
- Go to
 Dashboards Classic.
This lists all dashboards you are permitted to view or edit. - Sort the table by the Popularity column.
List my dashboards
To list just your own dashboards
- Go to
 Dashboards Classic.
 - Set a filter using one of these methods:
- Under Ownership in the left column, select
Mine - On the Filter by line, select
Ownership: Mine
- Under Ownership in the left column, select
Return to the current dashboard

The current dashboard is your most recently visited dashboard.
- When you drill down from a dashboard, select the dashboard button in the upper-left corner of Dynatrace to go back to the current dashboard.
- If you are already on a dashboard, the dashboard button takes you to the Dashboards explorer.
Create a new (empty) dashboard
- Go to
 Dashboards Classic.
 - Select Create Dashboard.
- Enter a name for your dashboard and select Create. The new dashboard opens in edit mode.
- Optional To add a tile, drag it from the Tiles pane to the dashboard, or pin a tile to the dashboard.
- Optional To configure dashboard-specific settings, select the Settings tile.
- Select Done.
The new dashboard is displayed as it will appear to you and people with whom you share it, though other people will not see the Edit button if you don't give them edit permission.
For details on creating dashboards, see Create and edit Dynatrace dashboards
Clone an existing dashboard
- Go to
 Dashboards Classic.
 - In the table of dashboards, select More (…) > Clone for the dashboard you want to copy.
- The copy opens in edit mode.
- The original dashboard is unaffected.
For details on creating dashboards, see Create and edit Dynatrace dashboards
Edit an existing dashboard
- Go to
 Dashboards Classic.
 - Select the name of a dashboard to display that dashboard.
- Select Edit in the upper-right corner of the dashboard. The dashboard opens in edit mode.
- If you don't see an Edit option, you don't have permission to edit that dashboard.
Hide and unhide dashboards
To hide a dashboard
- Go to
 Dashboards Classic.
 - In the table of dashboards, select More (…) > Hide for the dashboard you want to hide.
To unhide a dashboard
- Go to
 Dashboards Classic.
 - Filter the table by
Hidden: Yesto display all of your hidden dashboards. - In the table of dashboards, select More (…) > Unhide for the dashboard you want to unhide.
Delete a dashboard
- Go to
 Dashboards Classic.
 - In the table of dashboards, select More (…) > Delete for the dashboard you want to delete.
- If you don't see a Delete option, you don't have permission to delete that dashboard.
- Confirm the deletion to remove the dashboard.
Favorite a dashboard
To favorite the dashboard you are viewing, select the star in the upper-right corner of the dashboard. The star toggles favoriting on and off.

To favorite multiple dashboards
- Go to
 Dashboards Classic.
By default, the table is sorted by the Favorite column, so your favorites should be listed at the top of the table. - In the Favorite column, select the star for each dashboard you want to favorite.
For more on organizing dashboards, see Organize dashboards.
Unfavorite a dashboard
To unfavorite the dashboard you are viewing, select the star in the upper-right corner of the dashboard. The star toggles favoriting on and off.

To unfavorite multiple dashboards
- Go to
 Dashboards Classic.
By default, the table is sorted by the Favorite column, so your favorites should be listed at the top of the table. - Optional To list only your favorites, filter the table by
Favorite: Yes. - In the Favorite column, select the star for each dashboard you want to unfavorite.
For more on organizing dashboards, see Organize dashboards.
List my favorite dashboards
- Go to
 Dashboards Classic.
By default, the table is sorted by the Favorite column, so your favorites should be listed at the top of the table, followed by the other dashboards you have permission to display. - Optional To list only your favorites, set a filter using one of these methods:
- Under Favorite in the left column, select
Yes - On the Filter by line, select
Favorite: Yes
- Under Favorite in the left column, select
For more on organizing dashboards, see Organize dashboards.
Tag a dashboard
- Display the dashboard.
- Select Edit.
If you don't see an Edit option, you don't have permission to edit that dashboard. - Select Add tag under the name of the dashboard, type the tag, and select Add.
Repeat this step as needed to add additional tags to this dashboard. - Select Done.
For more on tagging dashboards, see Organize dashboards.
- Display the dashboard you want to share.
- To display a dashboard, go to
 Dashboards Classic and select the name of the dashboard.
- To display a dashboard, go to
- Select More (…) > Share in the upper-right corner of the dashboard.
- Select Advanced settings to open Dashboard settings to the Manage access tab.
For details on your dashboard sharing options, see Share dashboards.
Subscribe to dashboard reports
- Display the dashboard.
- Select More (…) > Subscribe in the upper-right corner of the dashboard.
- If you don't see a Subscribe option, the dashboard owners have not enabled reports for that dashboard.
- If you see an Enable reports button, you have edit rights to that dashboard and you must enable reports if you want to receive reports from that dashboard.
- Select how often you want to receive a dashboard report in email (turn on Weekly or Monthly or both).
For details on subscribing to dashboard reports, see Subscribe to dashboard reports.
Set a dashboard-specific timeframe
- Switch to the Settings tab.
- Turn on Default timeframe.
- Select the timeframe you want to be the default for this dashboard.
For an overview of timeframes and management zones on dashboards, see Dynatrace dashboard timeframe and management zone settings.
Set a dashboard-specific management zone
- Switch to the Settings tab.
- Turn on Default management zone.
- Select the management zone you want to be the default for this dashboard.
- For an overview of timeframes and management zones on dashboards, see Dynatrace dashboard timeframe and management zone settings
- For more on using management zones to organize your dashboards, see Organize Dynatrace dashboards
Configure advanced settings
- Display Dashboard settings.
- If you're starting from the Dashboards page, find the dashboard and select More (…) > Configure
- If you're starting from the dashboard, select Edit, switch to the Settings tab, and then select Configure more.
Print a dashboard to a PDF file
Printing a dashboard to a PDF file is supported for Chromium-based browsers (Chrome, Edge, Opera) and Safari. Printing a dashboard to PDF from Firefox is not yet supported.
-
Display the dashboard that you want to print to a PDF file.
- To display a dashboard, go to
 Dashboards Classic and select the name of the dashboard.
- To display a dashboard, go to
-
Select > Print PDF in the upper-right corner of the dashboard.
-
Adjust the settings as needed.
- Destination: Select Save as PDF.
- Options: Select Background graphics.
- Pages: If an empty page is generated, set Pages to
Customand then enter1for the page range that you want to print to PDF.
-
Select Save.
-
Select a name and destination for the PDF file.
Export and import dashboards
To export a dashboard
- Go to
 Dashboards Classic.
 - In the table of dashboards, select More (…) > Export for the dashboard you want to export.
The dashboard definition is exported as a JSON file to your computer.
To import a dashboard
- Go to
 Dashboards Classic.
 - Select Import dashboard.
- Select the JSON file for the dashboard you want to import.
The imported dashboard opens in edit mode.
For details, see Edit Dynatrace dashboard JSON.
Tiles
Tiles are the components of dashboards.
List available tiles
- Go to
 Dashboards Classic.
 - Select the name of a dashboard to display that dashboard.
- Select Edit in the upper-right corner of the dashboard. The dashboard opens in edit mode.
- If you don't see an Edit option, you don't have permission to edit that dashboard.
Now you can scroll down the Tiles pane to see all tile types available for your dashboard.
For details on available tiles, see Available tiles.
Create a metric visualization tile
- Go to Data Explorer.
- Select metrics.
- Select Run query to verify your query and see further display options.
- Select chart settings.
- Select Pin to dashboard.
- Select a dashboard for which you have edit permission.
- Select Pin.
For details, see Data Explorer.
Add a tile
- Go to
 Dashboards Classic.
 - Select the name of a dashboard to display that dashboard.
- Select Edit in the upper-right corner of the dashboard. The dashboard opens in edit mode.
- If you don't see an Edit option, you don't have permission to edit that dashboard.
- Drag a tile type from the Tiles pane to your dashboard.
To see a description of a tile, drag it to your dashboard and then refer to the description on the tile configuration panel.
Add an uploaded image
To add an uploaded graphic to your dashboard
- Go to
 Dashboards Classic.
 - Select the name of a dashboard to display that dashboard.
- Select Edit in the upper-right corner of the dashboard. The dashboard opens in edit mode.
- If you don't see an Edit option, you don't have permission to edit that dashboard.
- Drag an Image tile into position.
- On the Image panel, select the Upload an image tab.
- Select Upload image.
- Browse for and select the image file you want to display in the tile.
- Size and position the tile as needed.
Add image URL to allowlist
To add an image to your dashboard via URL, you first need to add the image URL to the allowlist.
- Go to Settings and select Dashboards > Allowed URL pattern rules.
- Select Add item.
- Set Rule, which specifies how to process this allowlist entry.
- Starts with—allow any image whose URL starts with the contents of Pattern.
- Exact—allow the specific image whose URL matches the contents of Pattern exactly.
- Set Pattern:
- To specify a URL start, enter enough of the URL to make sure any matching image URLs will be suitable for your dashboards.
Example: enterhttps://example.com/images/to allow any image whose URL starts withhttps://example.com/images/, such as
https://example.com/images/image-x.jpgandhttps://example.com/images/my-picture.svg - To specify an exact URL, enter the entire URL of the image you want to allow.
Example: enterhttps://example.com/images/my-image-file-name.jpgto allow only that image
- To specify a URL start, enter enough of the URL to make sure any matching image URLs will be suitable for your dashboards.
- Select Save changes to add the specified rule to the allowlist.
Add image via URL
You first need to add the image URL to the allowlist.
To add an image to your dashboard via URL
- Go to
 Dashboards Classic.
 - Select the name of a dashboard to display that dashboard.
- Select Edit in the upper-right corner of the dashboard. The dashboard opens in edit mode.
- If you don't see an Edit option, you don't have permission to edit that dashboard.
- Drag an Image tile into position.
- On the Image panel, select the Add image URL tab.
- Enter the URL of the image file you want to display in the tile. It needs to match one of the rules on the allowlist.
- Size and position the tile as needed.
Pin as a tile
Some Dynatrace pages can be pinned as a tile to a dashboard. Those pages have a Pin to dashboard button.
Example
- Go to
 Hosts Classic.
 - Set some filters to display only the hosts of interest.
- Select Pin to dashboard.
- Select a dashboard for which you have edit permission.
- Select Pin.
In this example, the new tile on your dashboard shows a graphic representation of your host selection. If there are ten hosts listed on the Hosts page, there are ten hosts (and their health) indicated on the tile. Select View details from that tile's menu to return to the Hosts table with the same filters set.
For details, see Pin tiles to your dashboard.
Clone a tile to the current dashboard
- Go to
 Dashboards Classic.
 - Select the name of a dashboard to display that dashboard.
- Select Edit in the upper-right corner of the dashboard. The dashboard opens in edit mode.
- If you don't see an Edit option, you don't have permission to edit that dashboard.
- Select the tile that you want to clone (add a copy of the tile to the current dashboard) and then select Clone.
- To clone multiple tiles to the current dashboard, drag a selection rectangle around the x tiles you want to clone and then select Clone x tiles.
- Edit the cloned tiles as needed.
Clone a tile to another dashboard
- Go to
 Dashboards Classic.
 - Select the name of a dashboard to display that dashboard.
- Select Edit in the upper-right corner of the dashboard. The dashboard opens in edit mode.
- If you don't see an Edit option, you don't have permission to edit that dashboard.
- Select the tile you want to clone to another dashboard and then select Clone to.
- To clone multiple tiles to another dashboard, drag a selection rectangle around the x tiles you want to clone and then select Clone x to.
- In the Where do you want to pin to? pop-up window, select an existing dashboard or Create new dashboard.
- Select Pin to add the selected tiles to the dashboard.
- Edit the cloned tiles as needed.
Edit a tile
- Display the dashboard.
- Hover over the tile, select the tile menu in the upper-right corner, and select Edit tile.
The tile configuration settings are displayed. - Change the configuration as needed.
To be sure you're making the changes you want, keep an eye on the tile while you change the configuration settings. Tile configuration changes (such as a custom timeframe) are reflected in real time as you make them. - When you're finished, select Done.
Set a tile-specific timeframe
To set a tile timeframe that overrides the dashboard timeframe
- Go to
 Dashboards Classic.
 - Select the name of a dashboard to display that dashboard.
- Select Edit in the upper-right corner of the dashboard. The dashboard opens in edit mode.
- If you don't see an Edit option, you don't have permission to edit that dashboard.
- Select the tile you want to configure.
- Turn on Custom timeframe.
- Select the timeframe you want to be the default for this tile.
- Done.
When you set a tile-specific timeframe, a filter is displayed in the upper-right of the tile. Hover over the filter to see the setting.
For an overview of timeframes and management zones on dashboards, see Dashboard timeframe and management zone.
Set a tile-specific management zone
To set a tile management zone that overrides the dashboard management zone
- Go to
 Dashboards Classic.
 - Select the name of a dashboard to display that dashboard.
- Select Edit in the upper-right corner of the dashboard. The dashboard opens in edit mode.
- If you don't see an Edit option, you don't have permission to edit that dashboard.
- Select the tile you want to configure.
- Turn on Custom management zone.
- Select the management zone you want to be the default for this tile.
- Done.
When you set a tile-specific management zone, a filter is displayed in the upper-right of the tile. Hover over the filter to see the setting.
For an overview of timeframes and management zones on dashboards, see Dashboard timeframe and management zone.
Set a tile-specific environment
To set a tile environment that overrides the dashboard environment
- Go to
 Dashboards Classic.
 - Select the name of a dashboard to display that dashboard.
- Select Edit in the upper-right corner of the dashboard. The dashboard opens in edit mode.
- If you don't see an Edit option, you don't have permission to edit that dashboard.
- Select the tile you want to configure.
- Under Environment, select the environment for this tile.
- Done.
When you set a tile-specific environment, a filter is displayed in the upper-right of the tile. Hover over the filter to see the setting.
For details on remote environments, see Create remote/multi-environment Dynatrace dashboards.
Delete a tile
- Go to
 Dashboards Classic.
 - Select the name of a dashboard to display that dashboard.
- Select Edit in the upper-right corner of the dashboard. The dashboard opens in edit mode.
- If you don't see an Edit option, you don't have permission to edit that dashboard.
- Select the unwanted tile.
- Select Delete and then confirm your action.
- To delete multiple tiles, drag a selection rectangle around the unwanted tiles, select Delete x tiles, and then confirm your action.
Move a tile
- Go to
 Dashboards Classic.
 - Select the name of a dashboard to display that dashboard.
- Select Edit in the upper-right corner of the dashboard. The dashboard opens in edit mode.
- If you don't see an Edit option, you don't have permission to edit that dashboard.
- Select and drag the tile to a new location.
- To move multiple tiles, drag a selection rectangle around the tiles, and then select and drag the selected tiles together to a new location.
Change a tile title
- Go to
 Dashboards Classic.
 - Select the name of a dashboard to display that dashboard.
- Select Edit in the upper-right corner of the dashboard. The dashboard opens in edit mode.
- If you don't see an Edit option, you don't have permission to edit that dashboard.
- Select the tile you want to configure.
- Under Title, edit the tile title.
- Done.
Create a header
- Go to
 Dashboards Classic.
 - Select the name of a dashboard to display that dashboard.
- Select Edit in the upper-right corner of the dashboard. The dashboard opens in edit mode.
- If you don't see an Edit option, you don't have permission to edit that dashboard.
- Drag a Header tile into position. For example, create a header above three related tiles.
- Select the edit control on the header tile.
- Edit the header text.
- Size the header tile.
- Select the check mark on the header tile. The header tile remains independent. You can move and resize it to label more than one tile with a single header.
API
You can also manage dashboards through the Dashboards API:
- GET all dashboards: List all dashboards of your Dynatrace environment.
- GET a dashboard: Get parameters of a specified dashboard.
- POST a dashboard: Create a new dashboard.
- PUT a dashboard: Update a specified dashboard.
- DELETE a dashboard: Delete a specified dashboard.
- GET sharing configuration: Get the sharing configuration of the specified dashboard.
- PUT sharing configuration: Update the sharing configuration of the specified dashboard.
- Tile JSON models: JSON models of dashboard tiles vary greatly, depending on the type of a tile. Check this page to see JSON models for each tile type.