Extending Dynatrace (Davis data units)
- Dynatrace Classic
- 8-min read
- Published Mar 30, 2020
Davis data units (DDU) provide a simple means of licensing certain capabilities (custom metrics, log monitoring, and custom events) on the Dynatrace platform. Think of DDUs as a kind of Dynatrace currency. In the same way that license consumption for Dynatrace RUM and Synthetic Monitoring relies on Digital Experience Monitoring (DEM) units, DDUs provide a seamless, shared consumption model across custom metrics, Log Monitoring, and custom events.
Because DDUs are consumption-based, you buy a certain volume and your available quota is consumed over time based on the amount of monitoring your environment consumes. This licensing approach makes it much easier for you to control and monitor your metric consumption (for example, in the case of misconfigured metrics) and to identify top consumers in your environment. To learn more about how metrics are licensed with DDUs, see Metric cost calculation.
For complete details about how your Dynatrace monitoring consumption is calculated, see Calculate Dynatrace monitoring consumption.
Davis data unit volumes
DDUs are purchased in volumes of 1 million units based on 1-3 year contract terms, with the full amount of licensed units renewing at the beginning of each year. For example, if you buy 100 million DDUs for a 3-year term, you can consume 100 million DDUs annually for 3 years.
You can purchase additional DDUs at any time if you run low. Reach out to your Dynatrace sales representative for details. To assist you in adjusting your monitoring consumption and avoiding cost overages, in-product notifications are displayed to alert your Dynatrace environment users when 90% and 100% of your licensed DDUs have been consumed.
Davis data units - Free tier
Every new Dynatrace SaaS environment and each Dynatrace Managed license receives 200,000 DDUs free of charge. This translates into 381 metrics, captured at a 1-minute frequency. This free tier enables you to test out features and experience Dynatrace monitoring value before you pay. The free tier of 200,000 DDUs automatically renews annually at the beginning of each new license term for each account. This benefit is not available to Offline or consumption-based (pay-as-you-go) accounts.
View DDU consumption details per environment
You need the Manage monitoring settings permission or an admin account to access this page. See Account management permissions for details.
To see how many DDUs your environment has consumed, go to Account Management > License / Subscription > Overview. There you can view your DDU consumption and identify the top contributors to DDU consumption.
This page offers an overview of DDU consumption per pool, as well as a detailed view per monitored entity (host, service, process group, application, or other). The second level navigation allows to further drill into detailed consumption per DDU pool (such as Metrics, Log Monitoring, Events).
Get DDU consumption details via API
You can also pull DDU consumption details via our API. The following metrics are available for retrieving DDU consumption details per pool via the API:
builtin:billing.ddu.metrics.totalbuiltin:billing.ddu.metrics.byEntitybuiltin:billing.ddu.metrics.byMetricbuiltin:billing.ddu.log.totalbuiltin:billing.ddu.log.byEntitybuiltin:billing.ddu.log.byDescriptionbuiltin:billing.ddu.serverless.totalbuiltin:billing.ddu.serverless.byEntitybuiltin:billing.ddu.serverless.byDescriptionbuiltin:billing.ddu.events.totalbuiltin:billing.ddu.events.byEntitybuiltin:billing.ddu.events.byDescriptionbuiltin:billing.ddu.traces.totalbuiltin:billing.ddu.traces.byEntitybuiltin:billing.ddu.traces.byDescription
Get DDU consumption by management zone
The above mentioned metrics do not directly support filtering by management zone, however the API can be used to achieve this and thereby address cross-departmental charging requirements and create a consumption report of your monitored entities split by management zones.
See a sample management zone reporting script in the Dynatrace snippets repository on GitHub
The script accesses the builtin:billing.ddu.metrics.byEntity metric and allows you to query consumption of the Metrics DDU pool for all or one specific management zone in a defined timeframe.
DDU pools
With DDU pools you can define monthly or yearly limits for DDU consumption on a per-environment basis. By default, pool limits are not enforced. To define limits for DDU consumption, go to Settings > Consumption > Davis data unit pools
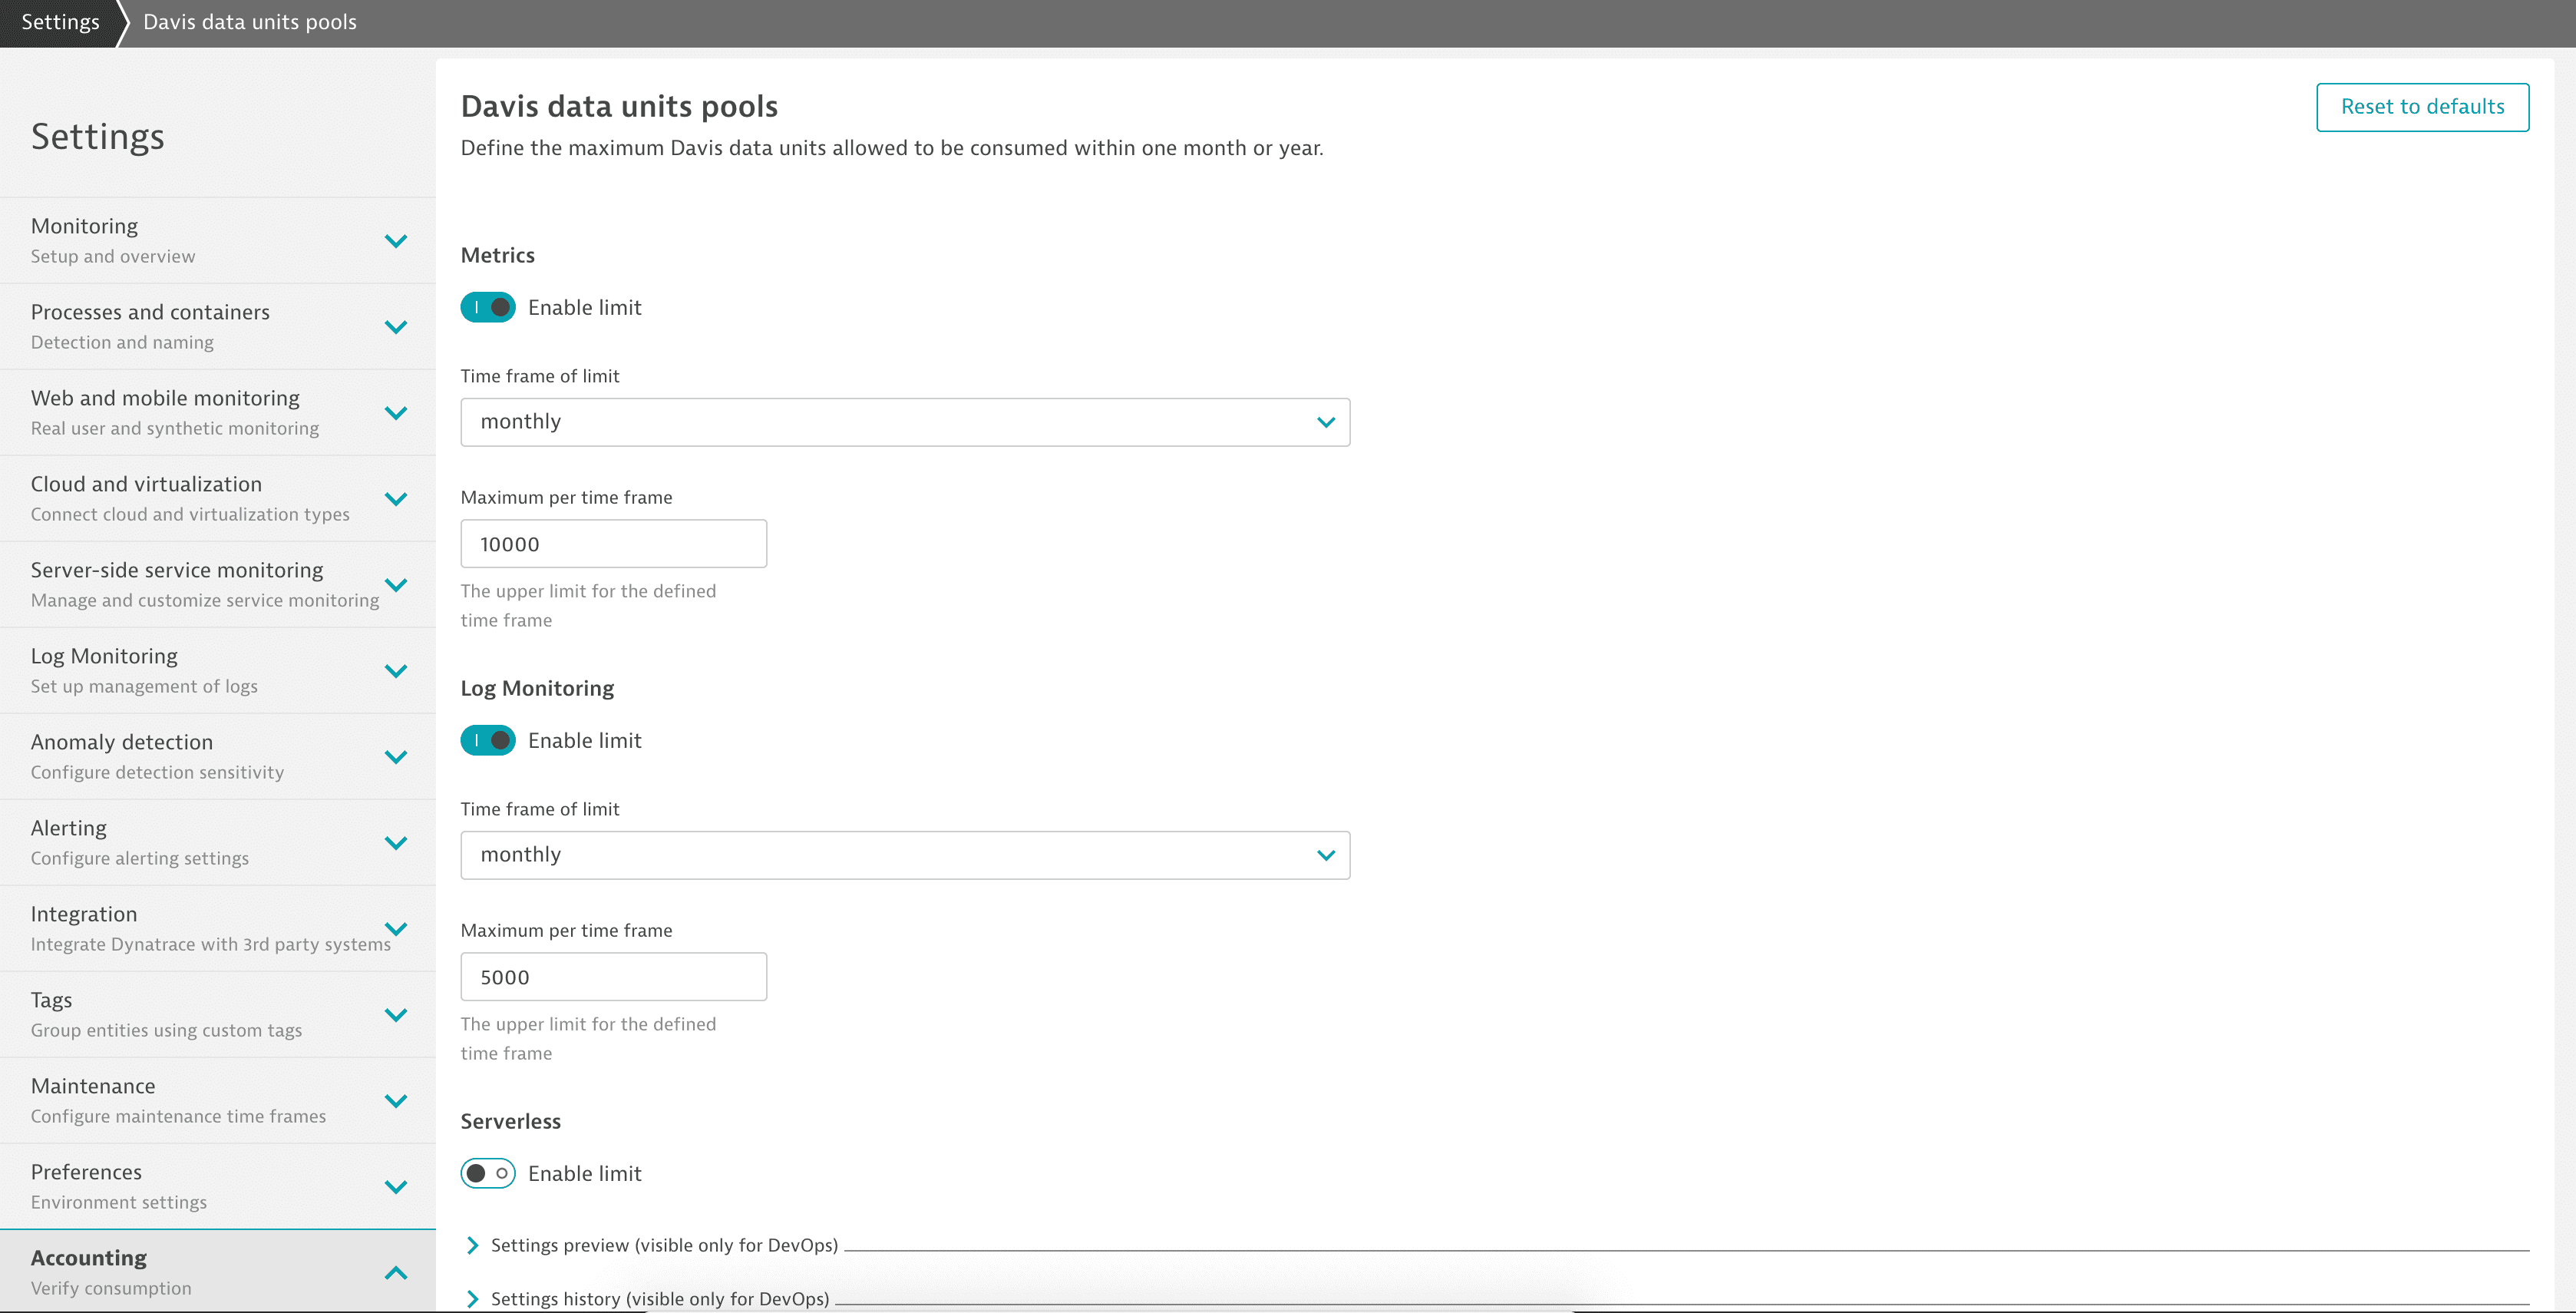
The following pools are available for limiting DDU consumption:
- Metrics
- Log Monitoring
- Serverless
- Events
- Traces
You need the Manage monitoring settings permission or an admin account to access the Davis data unit pools page.
Each pool can have a monthly or yearly defined limit for total DDU consumption. Similar to DDU volume notifications, all users of an environment will see banner notifications once 90% and 100% of the pool limit have been consumed.
Pool limits are evaluated per calendar month/year and are not associated with license renewal dates.
FAQ
Dynatrace will automatically trigger the migration of your existing license quota for you. You'll receive a notification once the migration is complete and you can begin using the DDU approach.
No, DDU consumption isn't tied to host unit consumption. DDUs are used to measure an environment's consumption of custom metrics, log lines, custom events, and third-party traces), not host monitoring.
Yes, 200,000 DDUs are available for each environment (SaaS) or license (Managed/Offline). Same is true for our free trial customers. The free tier resets annually (this is not true for Offline customers).
There is no difference between Dynatrace SaaS and Dynatrace Managed deployments. Offline deployments do not receive an annual reset of DDUs.
Go to Account Management > License / Subscription > Overview.
You need the Manage monitoring settings permission or use an admin account to access the DDU consumption overview page. For more information on permissions, see Manager user groups and permissions.
You need the Manage monitoring settings permission or use an admin account to receive the DDU consumption notifications. For more information on permissions, see Manager user groups and permissions.
Yes, DDU consumption details can be pulled via the Environment API v2.
builtin:billing.ddubuiltin:billing.ddu.metrics.byEntitybuiltin:billing.ddu.metrics.byMetric
No, because DDUs are designed for calculating your monitoring consumption of custom metrics, log lines, custom events, etc. You gain more precise consumption insights with immediate conversion to DDUs.
No. Your DDU quota is reset on each anniversary of the contract term, same as is done for DEM units.
No, you'll gain more flexibility, transparency, and other benefits with DDUs.
- One volume contains 1 million DDUs and translates to 1,903 metrics (at a 1-minute frequency)
- If a metric has multiple dimensions (for example, pool utilization per database pool name) then each dimension produces 1 metric data point per minute and subsequently deducts multiple DDUs per minute.
The minimum number of DDU volumes you can purchase is 1 (that is, 1 million DDUs). This equates to 1,903 metrics (at 1-minute frequency).
Yes, overages are available for DDUs.
All remaining custom metrics in your license will be converted to DDUs. Term duration is taken into consideration. For example, if you are six months into a one-year term (in other words, 50% of your term and custom metrics have been consumed), the remaining 50% of your custom metrics will be converted into an equivalent number of DDUs.
Eventually, yes. However this is currently not available.
Yes, your Dynatrace environment users will see an in-product notification once you've used up 90% and 100% of your licensed DDUs.
No, we can't support these older licenses. If you're still using one of these licenses, then the Dynatrace team should have already reached out to you. If they haven't, please contact us so that we can assist you with the conversion.
A monitored entity is anything in your environment that Dynatrace detects and monitors. This includes hosts, services, process groups, applications, and more.
The Davis data units overview sometimes displays the Not related to a monitored entity entry in the Name column of the Monitored entities table.
Depending on the pool, these are the potential sources of consumption booked on a Not related to a monitored entity entry:
| Pool | Entity-less sources |
|---|---|
Metrics | See Metrics section |
Log | |
Serverless | None |
Events | |
Traces | Traces where |
For consumption that is related to a monitored entity and where an entitySelector relation exists, use the Metrics API query:
builtin:billing.ddu.metrics.byEntity:filter(and(in("dt.entity.monitored_entity",entitySelector("type(AZURE_STORAGE_ACCOUNT), fromRelationships.isAccessibleBy(type(AZURE_SUBSCRIPTION),entityName.startsWith(~"myPrefix~"))")))):splitBy():fold