Ingest Wiz cloud configuration findings and audit logs
- Latest Dynatrace
- Extension
- Published Jun 01, 2026
- Preview
Prioritize Wiz cloud configuration findings with runtime context from production.
Get started
Overview
Dynatrace integration with Wiz allows you to unify and contextualize cloud security posture findings and audit activity across your DevSecOps tools and products, enabling central prioritization, visualization, and automation of security findings.
This integration brings Wiz Cloud findings into Dynatrace. Wiz Cloud is a cloud-native application protection platform (CNAPP) that scans your cloud environments and reports misconfigurations as cloud security posture management (CSPM) findings. Dynatrace enriches these findings with runtime context to help you focus on the misconfigurations that affect your production workloads.
Use cases
With the ingested data, you can accomplish various use cases, such as
Requirements
See below for the Wiz and Dynatrace requirements.
Wiz requirements
-
A Wiz service account to authenticate with the Wiz API using OAuth2 client credentials. You need the following details from the service account:
- Client ID
- Client secret
- Authentication URL (typically
https://auth.app.wiz.io/oauth/token)
-
The service account must have read access to cloud configuration findings.
Dynatrace requirements
-
ActiveGate version 1.330+ that needs to be able to
- Run Extensions 2.0 framework
- Reach the Wiz API endpoints
-
Permissions:
- To run
 Extensions: Go to Hub, select Extensions, and display Technical information.
 - To query ingested data:
storage:security.events:read.
- To run
-
Tokens:
- Generate an access token with the
openpipeline.events_securityscope and save it for later. For details, see Dynatrace API - Tokens and authentication.
- Generate an access token with the
Activation and setup
-
In Dynatrace, search for Wiz and select Install.
-
Follow the on-screen instructions to configure the extension.
When configuring the monitoring configuration, provide the following:
- Wiz configuration: the Wiz authentication URL, client ID, and client secret (or a credential vault entry).
- Dynatrace configuration: the Dynatrace API access token with the
openpipeline.events_securityscope (or a credential vault entry). - Optional Advanced options: adjust the ingest frequency, initial time window, page size, and whether to include passed findings.
-
Verify configuration by running the following queries in
 Notebooks:
-
For audit logs:
fetch logs| filter log.source=="Wiz" -
For compliance finding events:
fetch security.events| filter dt.system.bucket == "default_securityevents"| filter event.provider == "Wiz"AND event.type == "COMPLIANCE_FINDING"
-
-
After the extension is installed and working, you can access and manage it in Dynatrace via
Extensions. For details, see About Extensions.
Details
How it works
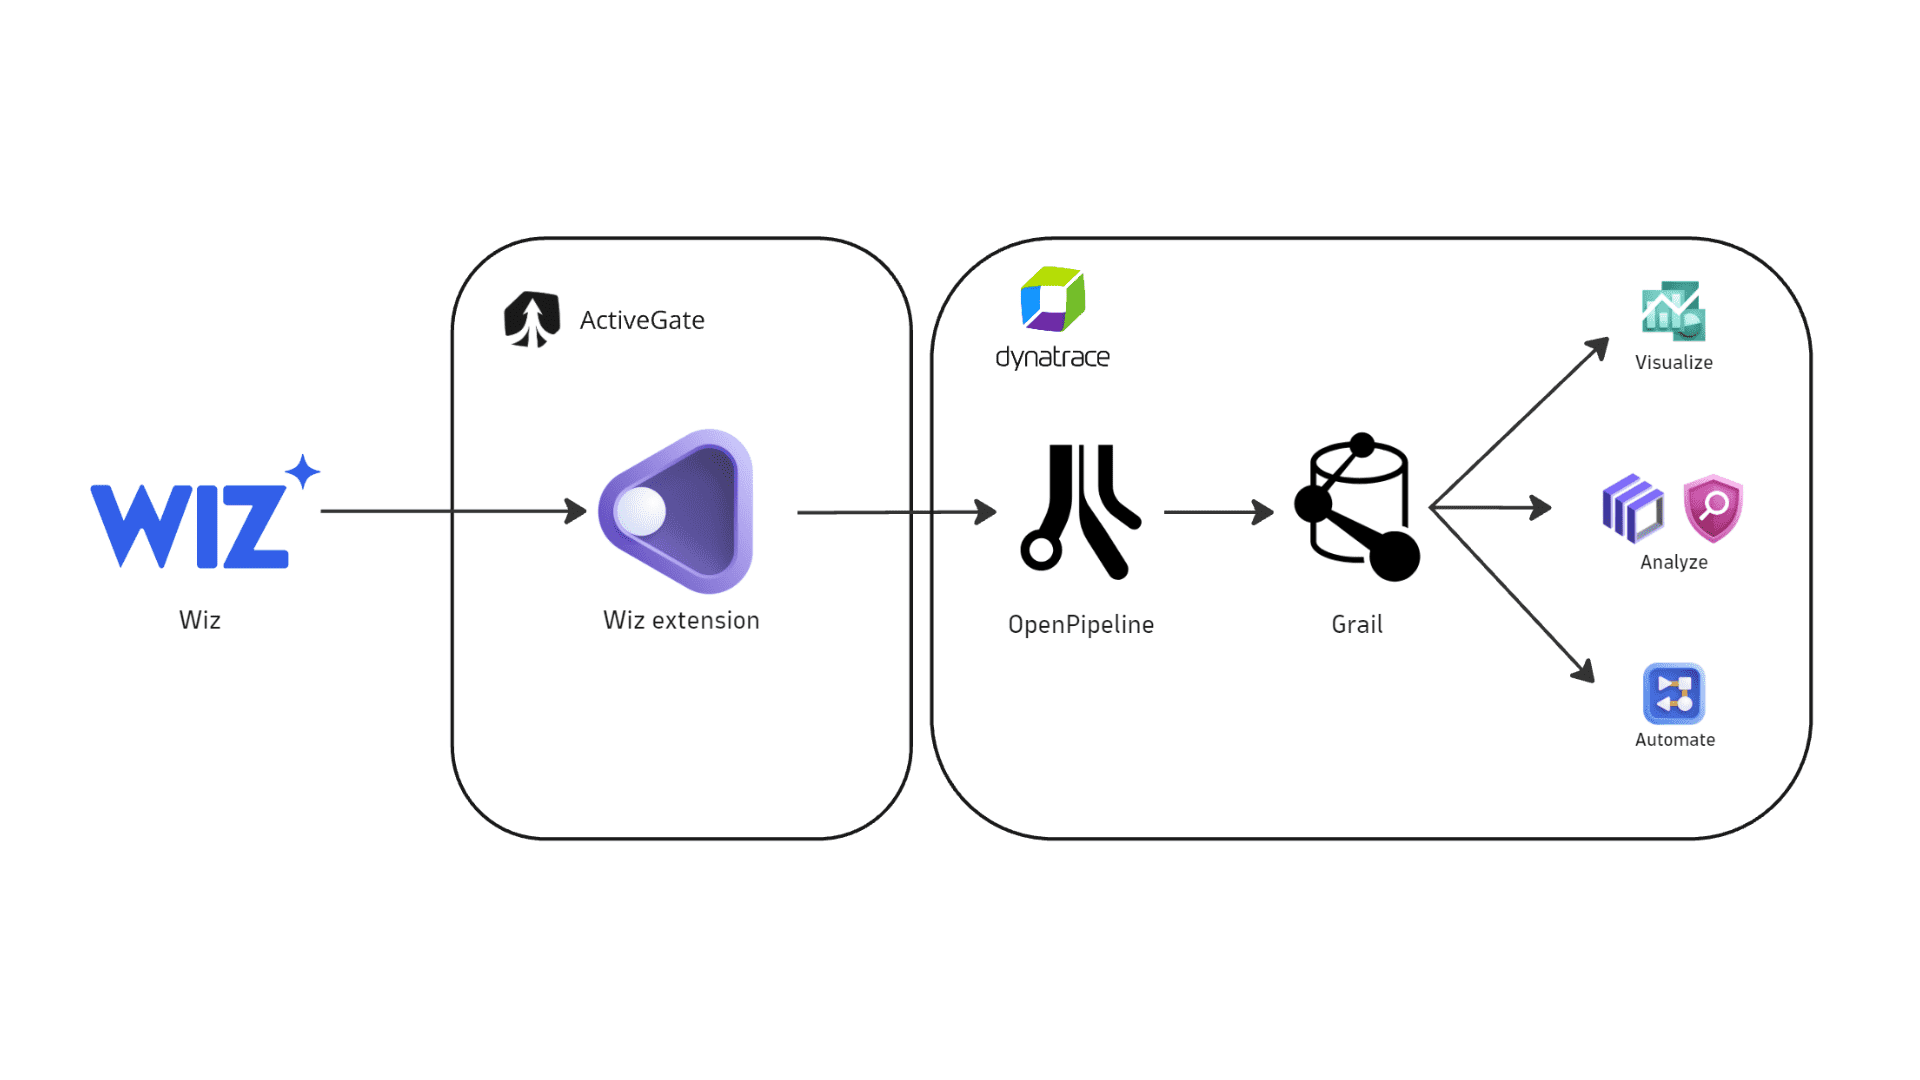
Dynatrace integration with Wiz is an extension running on Dynatrace ActiveGate. After you enable and configure the Dynatrace Wiz extension:
-
It periodically authenticates to the Wiz API using OAuth2 client credentials and fetches cloud configuration (CSPM) findings and audit logs.
-
The fetched data is ingested into Dynatrace and mapped to the Dynatrace Semantic Dictionary.
-
Data is stored in a bucket called
default_securityevents(for details, see Built-in Grail buckets).
Visualize
The Wiz extension ships with ready-made dashboards.
-
Open
Extensions and go to Wiz. -
In Extension content, select one of the bundled ready-made dashboards:
- Security findings for an overview of the security findings reported by Wiz and other products.
- Security product coverage to review which products and accounts are reporting findings.
-
In the Product filter, select Wiz to view data reported by Wiz.
Analyze
Open Notebooks or  Investigations to query ingested data, using the data format in Semantic Dictionary.
For a list of DQL examples based on compliance events that you can use for further investigation or reporting, see Query compliance events.
Automate notifications
Open  Workflows and build a workflow to create notifications for critical Wiz findings. For details, see Automate and orchestrate security findings.
Licensing and costs
For billing information, see Events powered by Grail.
FAQ
Which data model is used for the security logs and events coming from the Wiz integration?
-
Compliance finding events store the individual cloud configuration findings reported by Wiz per affected cloud resource. Dynatrace categorizes these events as
COMPLIANCE_FINDINGwith categoryCOMPLIANCEin the security event schema. -
Audit logs represent user activity logs.
Which Wiz findings are imported into Dynatrace?
-
Wiz cloud configuration (CSPM) findings are reported by default.
-
On the first ingest run, the integration ingests all findings within the configured initial time window (90 days by default).
-
On subsequent runs, the integration ingests findings according to the configured ingest frequency.
-
By default, findings with a
PASSresult aren't ingested. To also ingest passed findings, enable Include passed findings in the advanced options.
Why isn't my data ingested?
If you installed and configured the extension, but data isn't being ingested, follow the steps below.
- Open the extension and go to Health to check the status of the monitoring configuration.
- If the status isn't
OK, scroll down to Logs and select Run query to see the error information. - If the error information isn't enough, or the status shows
OKbut you're still not getting data, enable theEnable extension debug logsflag in the monitoring configuration and contact Dynatrace Support.
Common causes for missed data ingest include:
-
No connectivity between the ActiveGate and the Wiz API
Suggestion: Attempt to curl the Wiz authentication URL from the ActiveGate to ensure connectivity is working.
-
Wrong client ID and/or client secret
Suggestion: Double-check the credentials configured on the monitoring configuration.
-
Missing permissions on the Wiz service account
Suggestion: Ensure that the service account can read cloud configuration findings.
How is the risk score for Wiz findings normalized?
Dynatrace normalizes severity and risk scores for all findings ingested through the current integration. This helps you to prioritize findings consistently, regardless of their source. For details on how normalization works, see Severity and score normalization.
The Dynatrace risk levels and scores are mapped from the original Wiz severity.
dt.security.risk.level (mapped from finding.severity) | dt.security.risk.score (mapped from dt.security.risk.level) |
|---|---|
critical → CRITICAL | 10.0 |
high → HIGH | 8.9 |
medium → MEDIUM | 6.9 |
low → LOW | 3.9 |