Ingest Palo Alto Prisma Cloud detection findings, compliance findings, and audit logs
- Latest Dynatrace
- Extension
- Published Nov 10, 2026
Ingest detection and compliance findings and audit logs from Palo Alto Prisma Cloud into Dynatrace. Dynatrace enriches the findings with the cloud entities it monitors, so you can prioritize risks that affect your production workloads.
Get started
Overview
The Dynatrace integration with Palo Alto Prisma Cloud lets you unify and contextualize cloud security findings and audit activity across your DevSecOps tools and products. The integration provides central prioritization, visualization, and automation of security findings.
The integration ingests incident and risk alerts from Prisma Cloud as detection and compliance finding events. Dynatrace enriches them with the cloud entities it monitors and makes them available in dashboards, apps, and workflows.
The integration helps security teams investigate detections faster and review security posture and compliance more efficiently. The integration also helps security teams connect security findings with monitored environments and prioritize and assess risk.
Use cases
With the ingested data, you can address use cases such as
Requirements
Palo Alto Prisma Cloud requirements
To use this integration, make sure you have:
- An active Prisma Cloud tenant with API access to Alerts V2
- The Prisma Cloud API URL for your tenant (for example,
https://api.prismacloud.ioorhttps://api2.eu.prismacloud.io) - A Prisma Cloud access key ID and secret key
Dynatrace requirements
-
ActiveGate that must:
- Run the Extensions 2.0 framework.
- Reach the Prisma Cloud API URL for your tenant.
-
Recommended Use the Dedicated limits option for the performance profile. For details, see ActiveGate performance profile configuration.
-
For required permissions, open Hub, select
 Extensions, then go to the Technical information tab.
-
Generate an access token with the
openpipeline.events_securityscope and save it for later. For details, see Dynatrace API - Tokens and authentication.
Activation and setup
-
In Dynatrace, open Hub.
-
Look for Palo Alto Prisma Cloud and select Install.
-
Follow the instructions to configure the extension.
-
To verify the configuration, run the following queries in
 Notebooks:
-
For detection finding events:
fetch security.events| filter event.provider == "Palo Alto Prisma Cloud"AND event.type == "DETECTION_FINDING" -
For compliance finding events:
fetch security.events| filter event.provider == "Palo Alto Prisma Cloud"AND event.type == "COMPLIANCE_FINDING" -
For audit logs:
fetch logs| filter log.type == "pan-prisma-cloud-audit-logs"
-
-
After installation, you can access and manage the extension in
Extensions. For details, see About Extensions.
Details
How it works
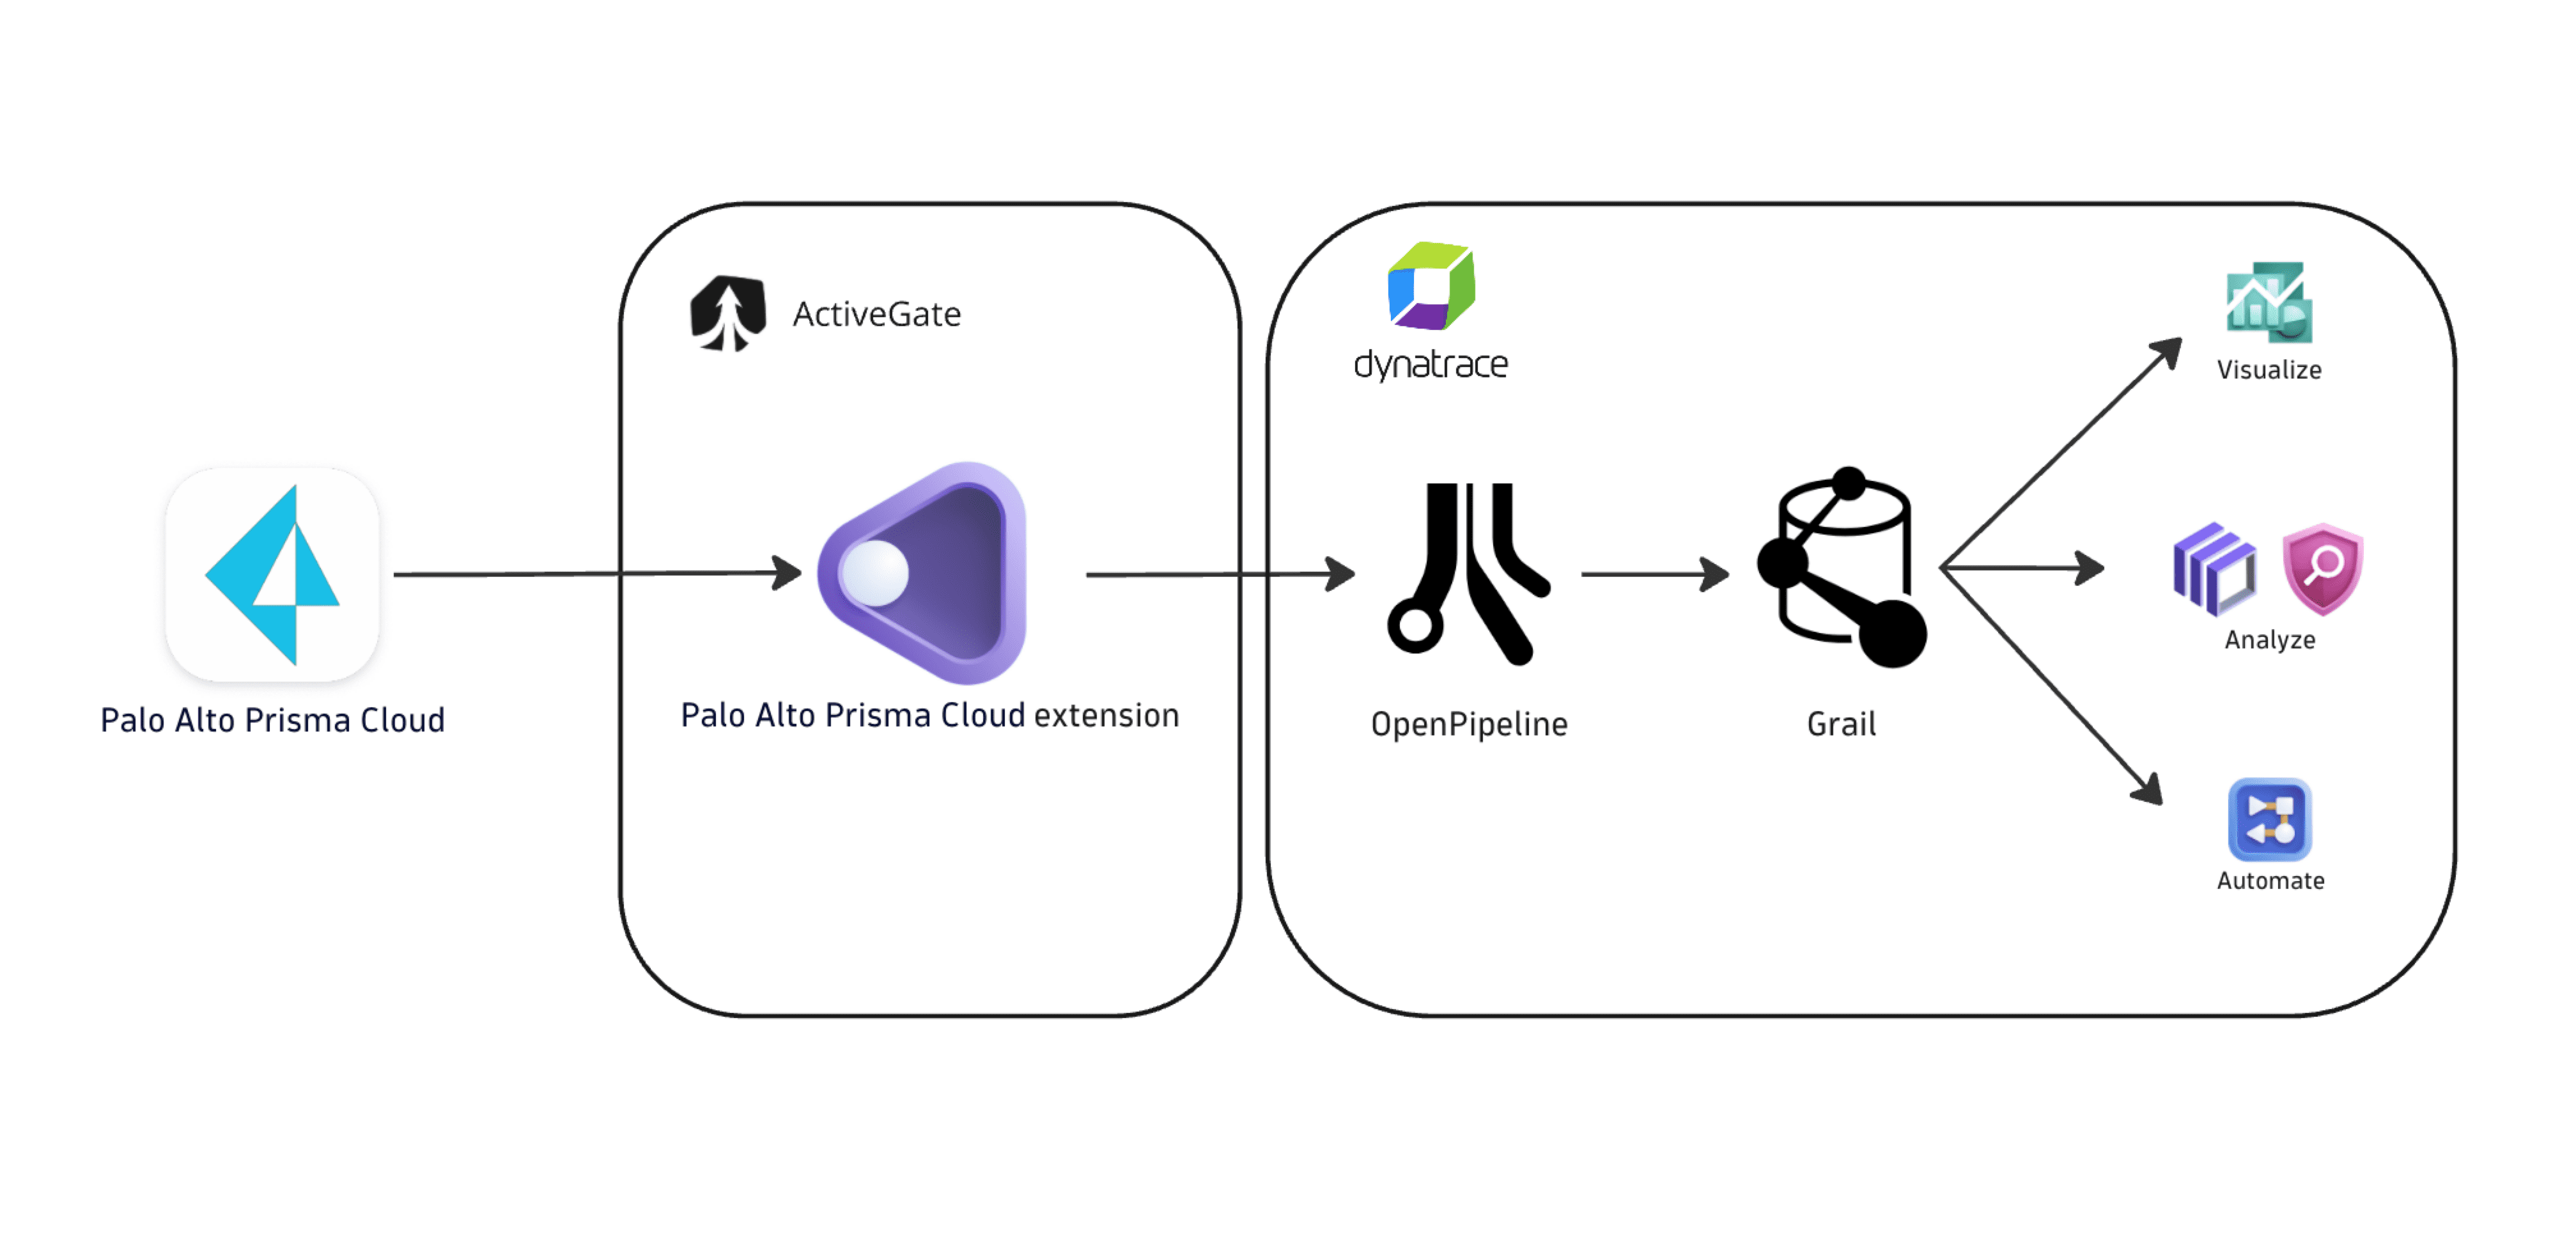
The integration runs as an extension on Dynatrace ActiveGate. After you install and configure the Prisma Cloud extension:
- The extension periodically polls the Prisma Cloud APIs for detection and compliance findings. If you turn on audit log ingestion, it also polls audit logs. Polling follows the ingestion configuration.
- Dynatrace maps the fetched data to the appropriate Dynatrace Semantic Dictionary data models.
- Dynatrace stores the data in the
default_securityeventsbucket (for details, see Built-in Grail buckets).
Licensing and costs
For billing information, see Events powered by Grail.
FAQ
Which Prisma Cloud product does this integration support?
The integration ingests security events from Prisma Cloud Enterprise Edition.
Which data model do Prisma Cloud events use in Dynatrace?
- Detection finding events store individual detection findings, each represented by a Prisma Cloud incident alert.
- Compliance finding events store individual compliance findings, each represented by a Prisma Cloud risk alert.
- Audit logs represent Prisma Cloud audit activity.
How does Dynatrace collect Prisma Cloud findings and audit logs?
The integration ingests alerts from Prisma Cloud based on the configured ingestion options:
- On the first ingest, Dynatrace fetches alerts created in the last
mdays, wheremis set by the Security events initial fetch time window option in the monitoring configuration. - On subsequent runs, the extension checks for alerts created in the last
nminutes, wherenis set by the Security events ingest frequency option in the monitoring configuration. - If you turn on audit log ingestion, the extension collects audit logs every
pminutes, wherepis set by the Audit logs ingest frequency option. The first run starts from the current time.
Which fields does the integration add on top of the core Dynatrace security event fields?
The prisma namespace is added for Prisma Cloud-specific attributes on top of the core security event schema. The full upstream payload is stored in event.original_content.
Fields added to findings include:
prisma.policy.id: Prisma Cloud policy identifierprisma.policy.category: Policy category (for example, incident or risk)prisma.policy.type: Policy type (for example, anomaly, config, oraudit_event)prisma.policy.class: Policy classprisma.policy.mode: Policy modeprisma.rule.type: Rule type from the policyprisma.alert.reason: Alert reason (for example,NEW_ALERT)prisma.finding.types: Finding types reported by the policy
How is risk score normalized for Prisma Cloud findings?
Dynatrace normalizes severity and risk scores for all findings ingested through this integration. Normalization helps you prioritize findings consistently, regardless of their source. For details, see Severity and score normalization.
-
dt.security.risk.levelis mapped from the Prisma Cloud policy severity returned by the Alerts and Policy APIs.finding.severitykeeps that Prisma severity string. -
dt.security.risk.scoreis derived from that severity using the standard Dynatrace static severity-to-score mapping.
dt.security.risk.level (mapped from finding.severity) | dt.security.risk.score (mapped from finding.score) |
|---|---|
critical → CRITICAL | 10.0 |
high → HIGH | 8.9 |
medium → MEDIUM | 6.9 |
low → LOW | 3.9 |
other → NONE | 0.0 |