Understand and manage Events consumption (DPS)
- Latest Dynatrace
- Explanation
- 10-min read
Events is a DPS capability for ingesting, retaining, and querying discrete event data stored in Grail. Consumption is measured in GiB ingested, GiB-days retained, and GiB scanned when querying. This page explains how Events consumption is calculated, which events are billable, and how to track and manage your usage.
Use events to capture and correlate business, deployment, and security signals from any source. Events support alerting, business activity tracking, deployment correlation, and security monitoring, and you can send custom events via API.
Events consumption is based on the Ingest & Process, Retain, and Query licensing framework, which is common to all telemetry signals. For more information, see Telemetry overview (DPS).
How consumption is calculated
The units of measurement for Events consumption are:
- Ingest & Process: GiB (gibibytes), measured as raw data before enrichment and transformation.
- Retain: GiB-days for data retained in Grail buckets.
- Query: GiB scanned during DQL query execution.
These are measured using the Events – Ingest & Process, Events – Retain, and Events – Query rate card items, respectively.
Key terms
- Event
A discrete occurrence, state change, or business transaction captured by Dynatrace at a specific point in time, stored as a structured record in Grail.
- Billable event
An event that generates Events consumption. All events are billable except certain included events. Examples of billable events: business events, SDLC events, custom events, files in the Grail Resource Store (including lookup tables).
- Included event
An event included with a separate rate-card capability package at no additional charge, within the limits shown in the included events table. Consumption beyond those limits is billable. For example, an allowance of Kubernetes warning event consumption is included with the Kubernetes Platform Monitoring rate-card item.
- Built-in event
An event type that Dynatrace monitors and reports through OneAgent or cloud integrations. A built-in event is billable unless it is listed as an included event. Examples of events that are both built-in and included: Davis problems and events, Kubernetes warning events.
- Custom event
An event you send to Dynatrace through the Events API v2 or the OneAgent API, or create from log messages by a log processing rule or in an OpenPipeline processing step. Retention of custom events is billable. Examples of custom events include: custom security events, custom Davis events that you send yourself.
- GiB (gibibyte)
The raw data volume sent to Dynatrace before enrichment and transformation.
- GiB-day
The volume of processed event data stored in Grail, per day, before compression.
- GiB scanned
The volume of uncompressed event data read during DQL query execution.
Which events are billable
The consumption of all events is billable, except for certain events that are included with a separate rate-card capability package. Included events are listed in the following table.
| If you have… | Ingest & Process included for… | For these events, Retain is included for… | For these events, Query is included within… |
|---|---|---|---|
| Full-Stack Monitoring | Davis problems and events | First 15 months | Included with Dynatrace |
| Kubernetes Platform Monitoring | Kubernetes warning events (up to 60 per pod-hour) | First 15 months |  Kubernetes,  Distributed Tracing, and  Services |
| Runtime Vulnerability Analytics (RVA) Security Posture Management (SPM) | Built-in security events | First 3 years |  Vulnerabilities,  Security Posture Management, Distributed Tracing, and Services |
In all cases:
- Events that are extracted from other telemetry signals (such as logs) are billed for Retain and Query, but not Ingest & Process. This includes, for example, custom events that are created from log messages, by a log processing rule, or in an OpenPipeline processing stage.
- Retention for all events, beyond the included period, is billed as Events - Retain.
Ingest & Process
The unit of measure for Events - Ingest & Process is GiB (gibibytes), based on the raw volume of event data received before enrichment and transformation.
What's covered with Ingest & Process
The Events - Ingest & Process rate card item covers delivery via OneAgent, RUM JavaScript, the Events API v2, the OneAgent API, and cloud integrations.
How GiB is calculated
Ingested data is measured as the raw volume of event data sent to Dynatrace before enrichment and transformation. Enrichment and transformation can increase the data volume.
- Data enrichment: includes adding topology context (for example, host, process, or Kubernetes metadata) or lookup data (for example, team ownership or cost center).
- Data transformation: includes adding or editing attributes, calculating new attributes from numerical values, masking sensitive data, and extracting business, infrastructure, or application data from raw logs into new attributes for querying and filtering.
Depending on the source and the attributes added, the total volume after transformation can increase by a factor of 1.5× or more. During processing, you can also drop unwanted attributes to reduce the retained data volume.
For data uploaded to the Grail Resource Store (such as lookup tables), a minimum file size of 1 MiB is used for Events - Ingest & Process calculations.
Estimate your cost
Assume you ingest 5 GiB of event data per day. For a full year:
5 GiB/day × 365 days = 1,825 GiB per year
At the list price of $0.20 per GiB:
1,825 GiB × $0.20 = $365 per year
List prices are shown for illustration; your contracted rate-card prices may differ.
Retain
The unit of measure for Events - Retain is GiB-days for data retained in Grail buckets.
Consumption is measured after processing but before compression. The compressed storage size does not represent Retain consumption.
All retention generates consumption, except for event types that are included with other rate-card capabilities (see Which events are billable).
Retention is configured per bucket. Available retention periods are between 1 day and 3,657 days.
For data in the Grail Resource Store (such as lookup tables):
- A minimum file size of 1 MiB applies.
- Each upload or save charges a minimum of one day of Events - Retain, even if the file is deleted within 24 hours or overwrites an existing file.
- Consumption is calculated using hourly windows based on currently stored data volume.
Estimate your cost
Assume you ingest 5 GiB of event data per day, which results in 9 GiB of enriched data in storage after a 1.8× enrichment factor.
For this ingested data, 35 days of retention is calculated as such:
9 GiB/day × 35 days = 315 GiB retained at full retention315 GiB × 30 days = 9,450 GiB-days per month
At the list price of $0.0007 per GiB-day:
9,450 GiB-days × $0.0007 = $6.62 per month
List prices are shown for illustration; your contracted rate-card prices may differ.
Query
The unit of measure for Events - Query is GiB scanned.
The volume of uncompressed event data read during DQL query execution, regardless of query origin. Grail applies scan optimizations, and data identified as irrelevant to the query result is discounted by 98%.
Events - Query consumption is generated when DQL queries scan event data in Grail, for example, by:
- Custom DQL queries in
 Logs advanced mode.
- Queries from Business Observability apps:
 Business Flow,
 Carbon Impact,
 Compliance Assistant.
- DQL queries in
 Notebooks,
 Dashboards,
 Workflows, custom apps, and via API.
- Opening a finding details page in
 Threats & Exploits may trigger queries from other apps such as
 Problems, which can generate consumption depending on the data scanned. However, queries on
security.eventsin Threats & Exploits are not billed. - For data loaded from the Grail Resource Store (such as lookup tables), a minimum file size of 1 MiB is used for Events - Query calculations.
For more information about how to query data via DQL, see Dynatrace Query Language
Understand your consumption
Dynatrace provides several ways to monitor and analyze your Events consumption.
- Use Account Management for subscription-level totals, forecasts, costs, and breakdowns.
- Use billing usage events, the authoritative record of billable usage, to build cost dashboards and chargeback reports.
Insights via Account Management
License managers can view usage and costs in Account Management.
-
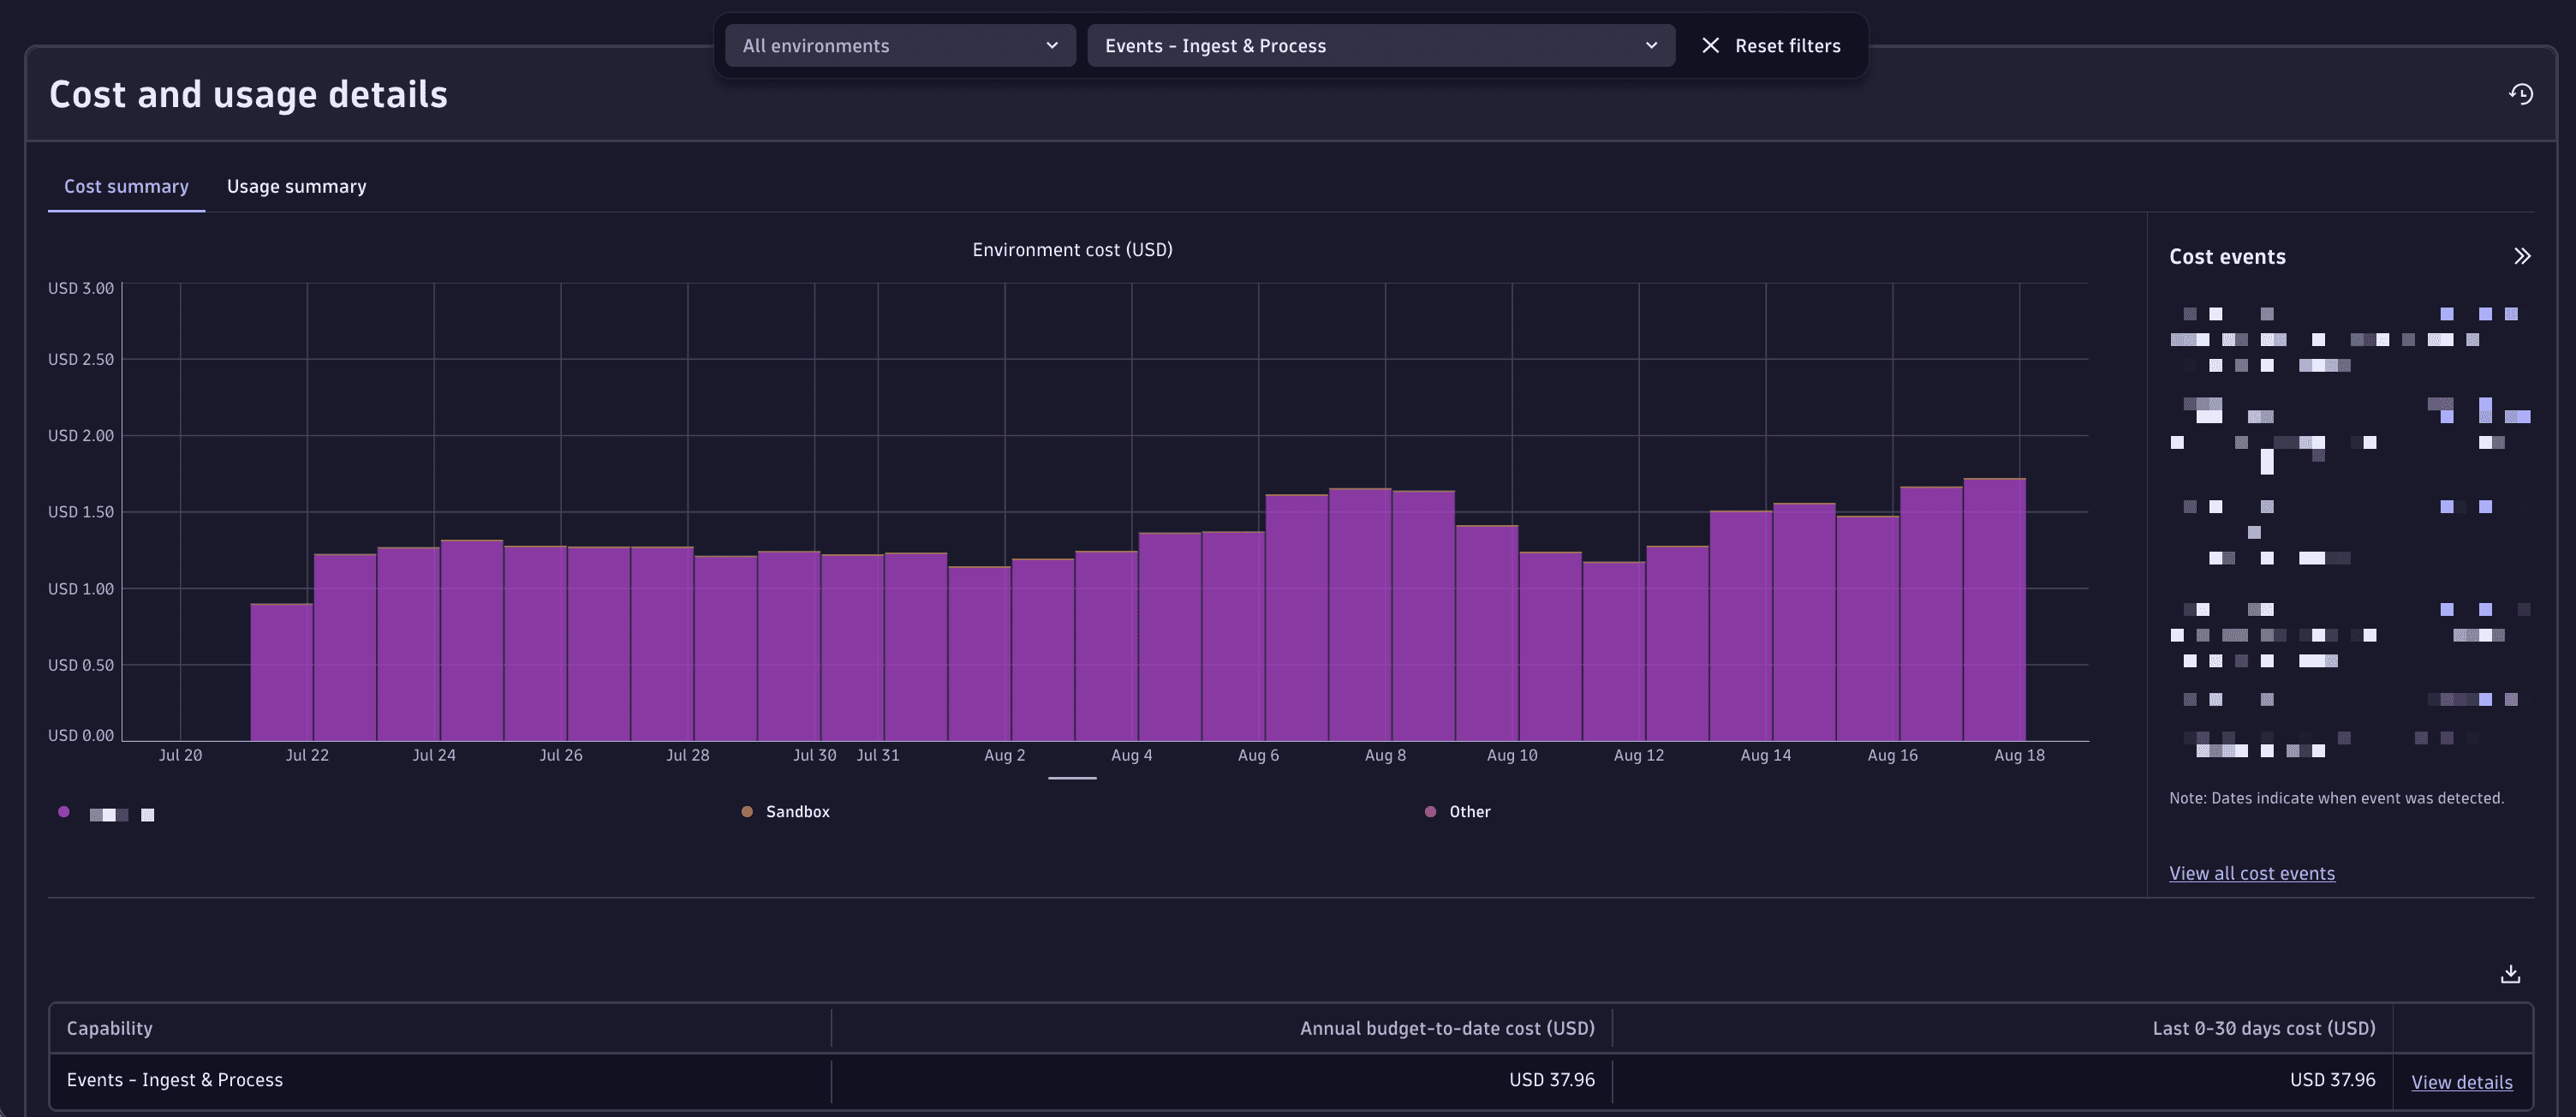
Go to Account Management > Subscription > Overview > Cost and usage details > Usage summary.
-
Select Events - Ingest & Process > Actions > View details, Events - Retain > Actions > View details, or Events - Query > Actions > View details.
-
From this page, you can also drill down into usage detail at the capability: select View Details next to the capability you want to explore.
For more information, see Overview (Dynatrace Platform Subscription).
Insights via billing usage events
Billing usage events (billing_usage_event) are system events emitted by Dynatrace that represent the authoritative record of billable usage.
Use them to build reliable cost dashboards and chargeback reports.
To learn more about billing usage events, see System event models.
Insights via API
Query Events consumption programmatically via the Account Management API for integration with external reporting systems. You can also query the underlying metrics through the Environment API – Metrics API v2.
FAQs
Does viewing problems or alerts in the Dynatrace UI generate Events - Query consumption?
Viewing problems or alerts is billable, except for:
- Problems and alerts that are included with the Dynatrace platform or specific apps, as described in Which events are billable.
- Queries on
security.eventsrun from within Threats & Exploits.
Are all custom events billable?
All events are billable except for included events: Davis problems and events, Kubernetes warning events (up to 60 per pod-hour), and built-in security events. Custom events sent via the Events API v2 are billed for Events - Ingest & Process, Events - Retain, and Events - Query. Events extracted from other telemetry signals, such as events created by log processing rules or in an OpenPipeline processing stage, are billed for Events - Retain and Events - Query, but not Events - Ingest & Process.
What is the minimum charge for files stored in the Grail Resource Store?
A minimum file size of 1 MiB is applied for Ingest & Process and Query calculations. For Retain, each upload or save operation charges a minimum of one day, even if the file is deleted within 24 hours.