Telemetry overview (DPS)
- Latest Dynatrace
- Overview
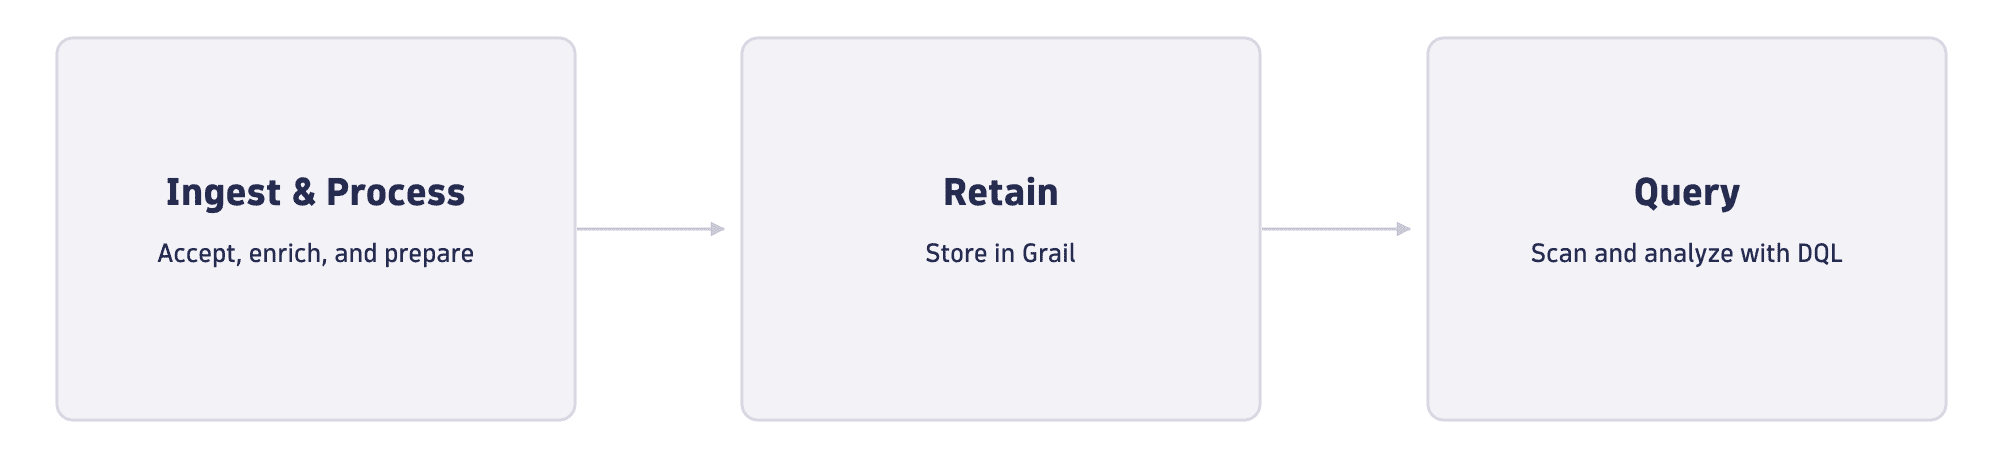
With the Dynatrace Platform Subscription (DPS), you can observe telemetry signals (metrics, traces, and events) with a common three-part licensing framework: Ingest & Process, Retain, and Query.
Dynatrace lets you ingest and analyze metrics, traces, and events from any source; OpenTelemetry is natively supported. You can send OTLP metrics, traces, and logs directly to Dynatrace, and analyze them in context alongside the rest of your telemetry. Context is preserved so you can query and correlate across signals.
Overview
This page describes when metrics, traces, and events are billed, and when to use each signal.
For capability-specific documentation of counting rules, included usage, calculation examples, and guidance on tracking and managing consumption, see:
This overview page covers consumption of metrics, traces, and events. For logs, see Log Analytics.
Which telemetry signal should I use?
Match what you want to monitor to the signal. Most environments use all three together. Units, retention, and query details are in the sections below.
-
Metrics: measure and trend performance across infrastructure, network, and cloud services.
This includes custom metrics from Prometheus, OpenTelemetry (OTLP), cloud provider APIs, extensions, and custom business metrics.
-
Traces: track requests end to end across distributed services, APIs, and serverless workloads.
This includes OpenTelemetry (OTLP) traces from services not covered by OneAgent, and traces from serverless functions.
-
Events: capture and correlate business, deployment, and security signals from any source.
Events support alerting, business activity tracking, deployment correlation, and security monitoring, and you can send custom events via API.
When telemetry data is billed
Telemetry billing has three components for every signal: Ingest & Process, Retain, and Query, as shown in the diagram above.
The table below summarizes how metrics, traces, and events are billed per component. Refer to the linked Understand and manage… pages for capability-specific information.
| What's billed… | Metrics | Traces | Events |
|---|---|---|---|
| Ingest & Process | Custom metrics, including OpenTelemetry (OTLP) metrics, and some built-in dt.* metrics, beyond any included allowance. Billed when data points are saved in Grail, after processing. | OpenTelemetry (OTLP) traces, serverless function traces, and traces beyond the Full-Stack included volume. Billed on the volume sent to Dynatrace, before enrichment and processing. | Events delivered via OneAgent, RUM JavaScript, APIs, or cloud integrations, except included and extracted events. Billed on the raw volume sent to Dynatrace, before enrichment and transformation. |
| Retain | Billed after 15 months. Extendable up to 10 years. | Billed after 10 days. Extendable up to 10 years. | Billed for the retention you configure, up to 10 years, except for included events. |
| Query | No additional cost. | Billed for the volume of data scanned in a query. | Billed for the volume of data scanned in a query. |
How Ingest & Process is measured
For traces and events, Ingest & Process is billed on the volume of data sent to Dynatrace, measured before enrichment and processing, so data you drop during processing still counts.
For metrics, it is billed when custom metric data points are saved in Grail, so dropped metrics do not count.
How metric extraction is billed
When you extract metrics from another signal, such as logs, events, or spans, the extracted metrics are stored in Grail and generate Metrics - Ingest & Process consumption. Extracted non-metric signals, such as events extracted from logs, do not generate Ingest & Process consumption for their own signal (for example, Events - Ingest & Process), because the source data was already counted when it arrived. Stored extracted metrics generate Metrics - Retain consumption beyond the included 15 months, and other stored extracted data generates Retain consumption for its own signal, such as Events - Retain.