Understand and manage Metrics consumption (DPS)
- Latest Dynatrace
- Explanation
- 12-min read
Metrics is a DPS capability for ingesting, retaining, and querying timeseries metric data. Consumption is measured in metric data points ingested and GiB-days of retained data. This page explains how Metrics consumption is calculated, which metrics are billable, and how to track and manage your usage.
Use metrics to measure and trend performance across infrastructure, network, and cloud services. This includes custom metrics from Prometheus, OpenTelemetry (OTLP), cloud provider APIs, extensions, and custom business metrics.
Metrics consumption is based on the Ingest & Process, Retain, and Query licensing framework, which is common to all Dynatrace telemetry signals. For more information, see Telemetry overview (DPS).
How consumption is calculated
The units of measurement for Metrics consumption are:
- Ingest & Process: Metric data points.
- Retain: GiB-days for data retained beyond the included 15 months.
These are measured using the Metrics – Ingest & Process and Metrics – Retain rate card items, respectively.
In many environments, consumption of Metrics - Ingest & Process is effectively the entire Metrics cost. This is because the first 15 months of retention are included, and querying metrics never generates a separate charge.
Key terms
- Metric
A metric is a named numerical measurement that represents a specific aspect of a system, observed over time.
- Metric data point
A recorded measurement for a metric at a specific point in time, saved as a numeric value.
- Dimension
A key-value pair used to filter, split, or group metrics or timeseries. Dimensions can (but do not need to) create additional metric data points that are stored in Grail, which increases consumption. For more information, see Dimensions and consumption.
- Timeseries
A series of metric data points, which represents measurements of the same metric over time. It consists of a metric, a tuple of dimensions (a tuple of key-value pairs), and a series of numeric values (data points).
- Summary statistics measurement
Captures a gauge or counter. Each data point consists of the average (gauge) or sum (counter), and possibly the min, max, and number of observations.
- Histogram measurement
Captures a distribution of measures at various levels, suited to calculate percentiles.
Ingest & Process
The unit of measure for Metrics - Ingest & Process consumption is metric data points.
What's covered
The Metrics - Ingest & Process rate card item covers:
- Delivery through OneAgent, OpenTelemetry, extensions (e.g. network), cloud integrations, or ingest API.
- Enrichment with source and topology metadata.
- Transformations and rollups.
- Deriving metrics from high-volume logs and span data.
- Assignment to the Grail buckets that determine retention.
All metrics are billable unless they are explicitly non-billable or their data points are covered by the included allowance of another rate card item.
How Ingest & Process consumption is calculated
Total Ingest & Process consumption is based on the number of data points that are stored in Grail. For metrics, this is calculated after processing.
Because data points are counted after processing, any metric data points you drop during processing do not contribute to consumption. If you extract metrics from other types of telemetry, this creates additional stored data points and contributes to consumption of Metrics - Ingest & Process.
Counting rules and granularity
Measurements consume the following number of Metrics - Ingest & Process data points:
- Summary statistics measurement (gauge or counter): One data point.
- Histogram measurement: 10 data points, except
dt.service.*metric keys, which are counted as one data point.
If several incoming measurements from the same timeseries and metric interval are stored as one measurement in Grail, only the single stored measurement is counted for consumption purposes, see Dimensions and consumption.
Metrics collected more often than once per minute are aggregated into fixed one-minute buckets, so a higher collection frequency does not necessarily create more stored data points.
Which metrics are billable
Dynatrace bills you only for metric data points that have been ingested and written to Grail, excluding non-billable metrics and custom metrics that are within the included custom metrics volume.
-
Non-billable metrics:
- Internal self-monitoring metrics that Dynatrace generates to observe and operate itself.
- Certain metrics representing AWS and Azure VM state counts are also non-billable, even though the broader cloud metric families are billable.
Non-billable metric keys
The following metric keys are non-billable:
dt.*(with exceptions listed in the next section)dt.cloud.aws.az.runningdt.cloud.azure.region.vms.initializingdt.cloud.azure.region.vms.runningdt.cloud.azure.region.vms.stoppeddt.cloud.azure.vm_scale_set.vms.initializingdt.cloud.azure.vm_scale_set.vms.runningdt.cloud.azure.vm_scale_set.vms.stoppedlegacy.containers.*legacy.dotnet.perform.*legacy.tomcat.*
Metrics stored in the
dt_system_metricsbucket are also non-billable.Billable metrics keys (dt.* exceptions)
The following metric keys are billable unless they are explicitly included by another rule:
-
Metrics beginning with
dt.cloud.aws.*,dt.cloud.azure.*, ordt.osservice.*. The exact keys identified as non-billable in the list above remain non-billable. -
Metrics beginning with
dt.service.*, depending on their source: span data from hosts or containers monitored by OneAgent in Full-Stack Monitoring mode consumes the included Full-Stack metric data-point allowance; span data from any other source is billed as Metrics - Ingest & Process. -
The following Network Availability Monitoring metrics:
dt.synthetic.multi_protocol.request.availabilitydt.synthetic.multi_protocol.request.executionsdt.synthetic.multi_protocol.icmp.success_ratedt.synthetic.multi_protocol.icmp.packets_sentdt.synthetic.multi_protocol.icmp.packets_receiveddt.synthetic.multi_protocol.icmp.round_trip_timedt.synthetic.multi_protocol.tcp.connection_timedt.synthetic.multi_protocol.dns.resolution_time
-
Included metrics: Some DPS capabilities come with an allowance of custom metric points, see Included metrics and allowances.
Included metrics and allowances
Metrics from Full-Stack Monitoring and Infrastructure Monitoring that fall within the included metric data points don't generate Metrics – Ingest & Process consumption. They only start generating consumption once the included quota is exceeded. For more details, see Full-Stack Monitoring and Infrastructure Observability.
Dimensions and consumption
Adding additional metric dimensions does not inherently generate consumption. Consumption is generated only when additional metric data points are stored in Dynatrace.
The examples below show different ways that consumption is generated based on one metric with two dimensions (url and status_code).
-
Example 1: The metric has one combination of values. Consumption is one metric data point per minute.
Timestamp Metric key URL Status code Value 10:00 http_requests_count/checkout200100 -
Example 2: There are two distinct value combinations for the same metric. Consumption is two metric data points per minute.
Timestamp Metric key URL Status code Value 10:00 http_requests_count/checkout20010010:00 http_requests_count/checkout5002
Estimate your Ingest & Process cost
Assume that, after non-billable metrics and included allowances are applied, your environment produces 55 million billable metric data points per day. For a 30-day month:
55 million data points/day × 30 days = 1.65 billion data points/month
At the list price of $0.15 per 100,000 data points:
1.65 billion / 100,000 × $0.15 = $2,475 per month
List prices are shown for illustration; your contracted rate-card prices may differ.
Retain
The unit of measure for Metrics - Retain is GiB-days for data stored in Grail.
One GiB-day is equal to one GiB of metrics retained for one day (24 hours).
How Retain consumption is calculated
For metrics, the GiB volume is based on consolidated data points; it is independent of the ingested data volume. For each non-empty timeslot of a retained timeseries, the retained data volume is equal to the size of the series' dimensions plus a payload whose size varies according to the data type (whether summary stats, cardinality, or histogram).
Metrics retention is configured at the bucket level. Metrics include 15 months (462 days) of one-minute-granularity retention. Only data you keep beyond day 462 generates Metrics - Retain consumption.
Shortening a metrics bucket's retention below 462 days does not reduce your Retain cost, since this period is already included at no charge. Use a shorter retention period for compliance or data-minimization purposes instead.
Estimate your Retain cost
Assume each metric data point adds about 600 bytes of processed metric data to storage. Ingesting 55 million data points per day (as with the example in Estimate your Ingest & Process cost) adds about 30.73 GiB to storage daily.
At the default 462-day retention, billable Retain usage is 0 GiB-days.
If you extend retention to 5 years (1,832 days):
1,832 − 462 days = 1,370 billable retention days30.73 GiB/day × 1,370 days = 42,100.1 GiB retained at full retention42,100.1 GiB × 30 days = 1,263,003 GiB-days per month
At the list price of $0.0007 per GiB-day:
1,263,003 × $0.0007 = $884.10 per month
List prices are shown for illustration; your contracted rate-card prices may differ.
This monthly cost applies once data has been retained for the full 1,832-day retention period. Before that, consumption grows as data accumulates.
If you have multiple metrics buckets with different retention periods, calculate the retention consumption separately for each bucket.
Query
Querying metrics with the DQL timeseries command is included with Metrics - Ingest & Process, regardless of where the query originates (dashboard, API, and so on). Because of this, Metrics - Query has no separate unit of measure.
The following timeseries query reads a metric, so querying is included and generates no query charge (the metric itself still generates Ingest & Process and, beyond 462 days, Retain consumption):
timeseries sum(log.all_logs_count)
The data a query reads determines which query capability applies, not the format of the result. A query that reads logs, traces, or events can generate query consumption for that data type even when it outputs a timeseries.
For example, a query that scans log records via maketimeseries will consume Log Management & Analytics - Query.
It will not consume Metrics - Query, even though the result is a timeseries.
Understand your consumption
Dynatrace provides several ways to monitor and analyze your Metrics consumption.
- Use the Usage - Metrics ready-made dashboard for real-time consumption insights and optimization opportunities.
- Use Account Management for subscription-level totals, forecasts, costs, and breakdowns.
- Use billing usage events, the authoritative record of billable usage, to build cost dashboards and chargeback reports.
Insights via usage dashboard
The Usage - Metrics ready-made dashboard helps you view, allocate, and predict your Metrics consumption across the platform.
Open  Dashboards > Ready-made and search for Usage - Metrics.
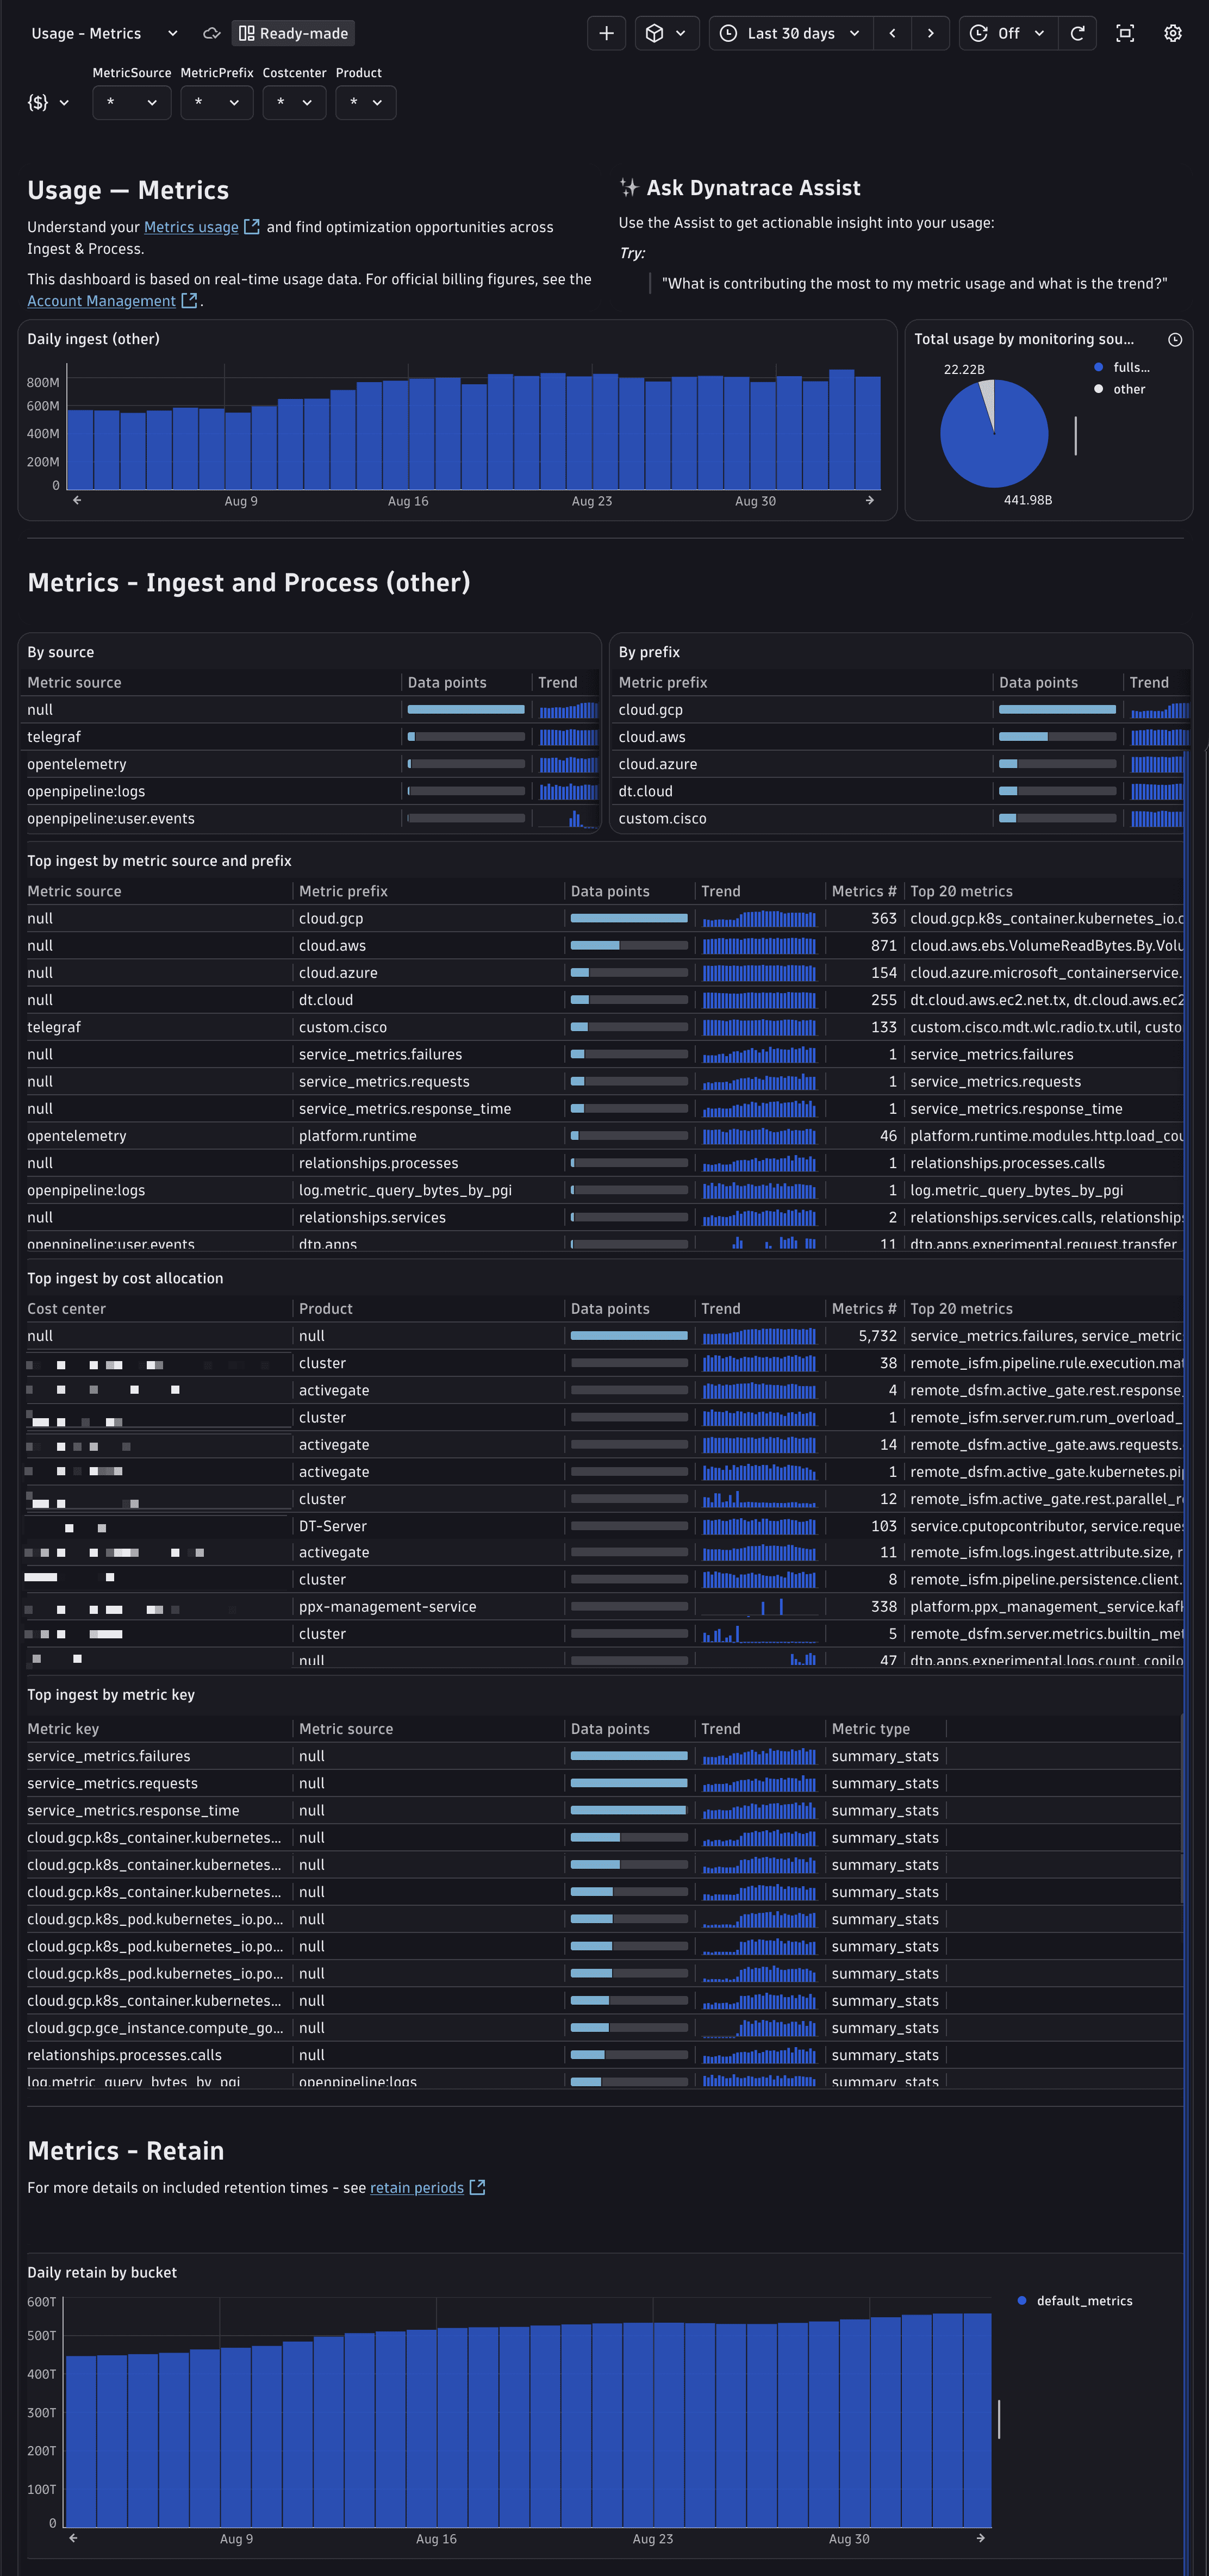
The dashboard covers:
- A granular breakout of ingest volume by source, down to the metric prefix key, to help you spot ingest spikes.
- Top metrics by source or prefix, and by Cost Allocation cost center or product, to identify what's driving your ingest and costs.
- Optimization guidance via Dynatrace Assist to help you identify unnecessary metrics for ingest, see Best practices for optimizing metrics cost.
Insights via Account Management
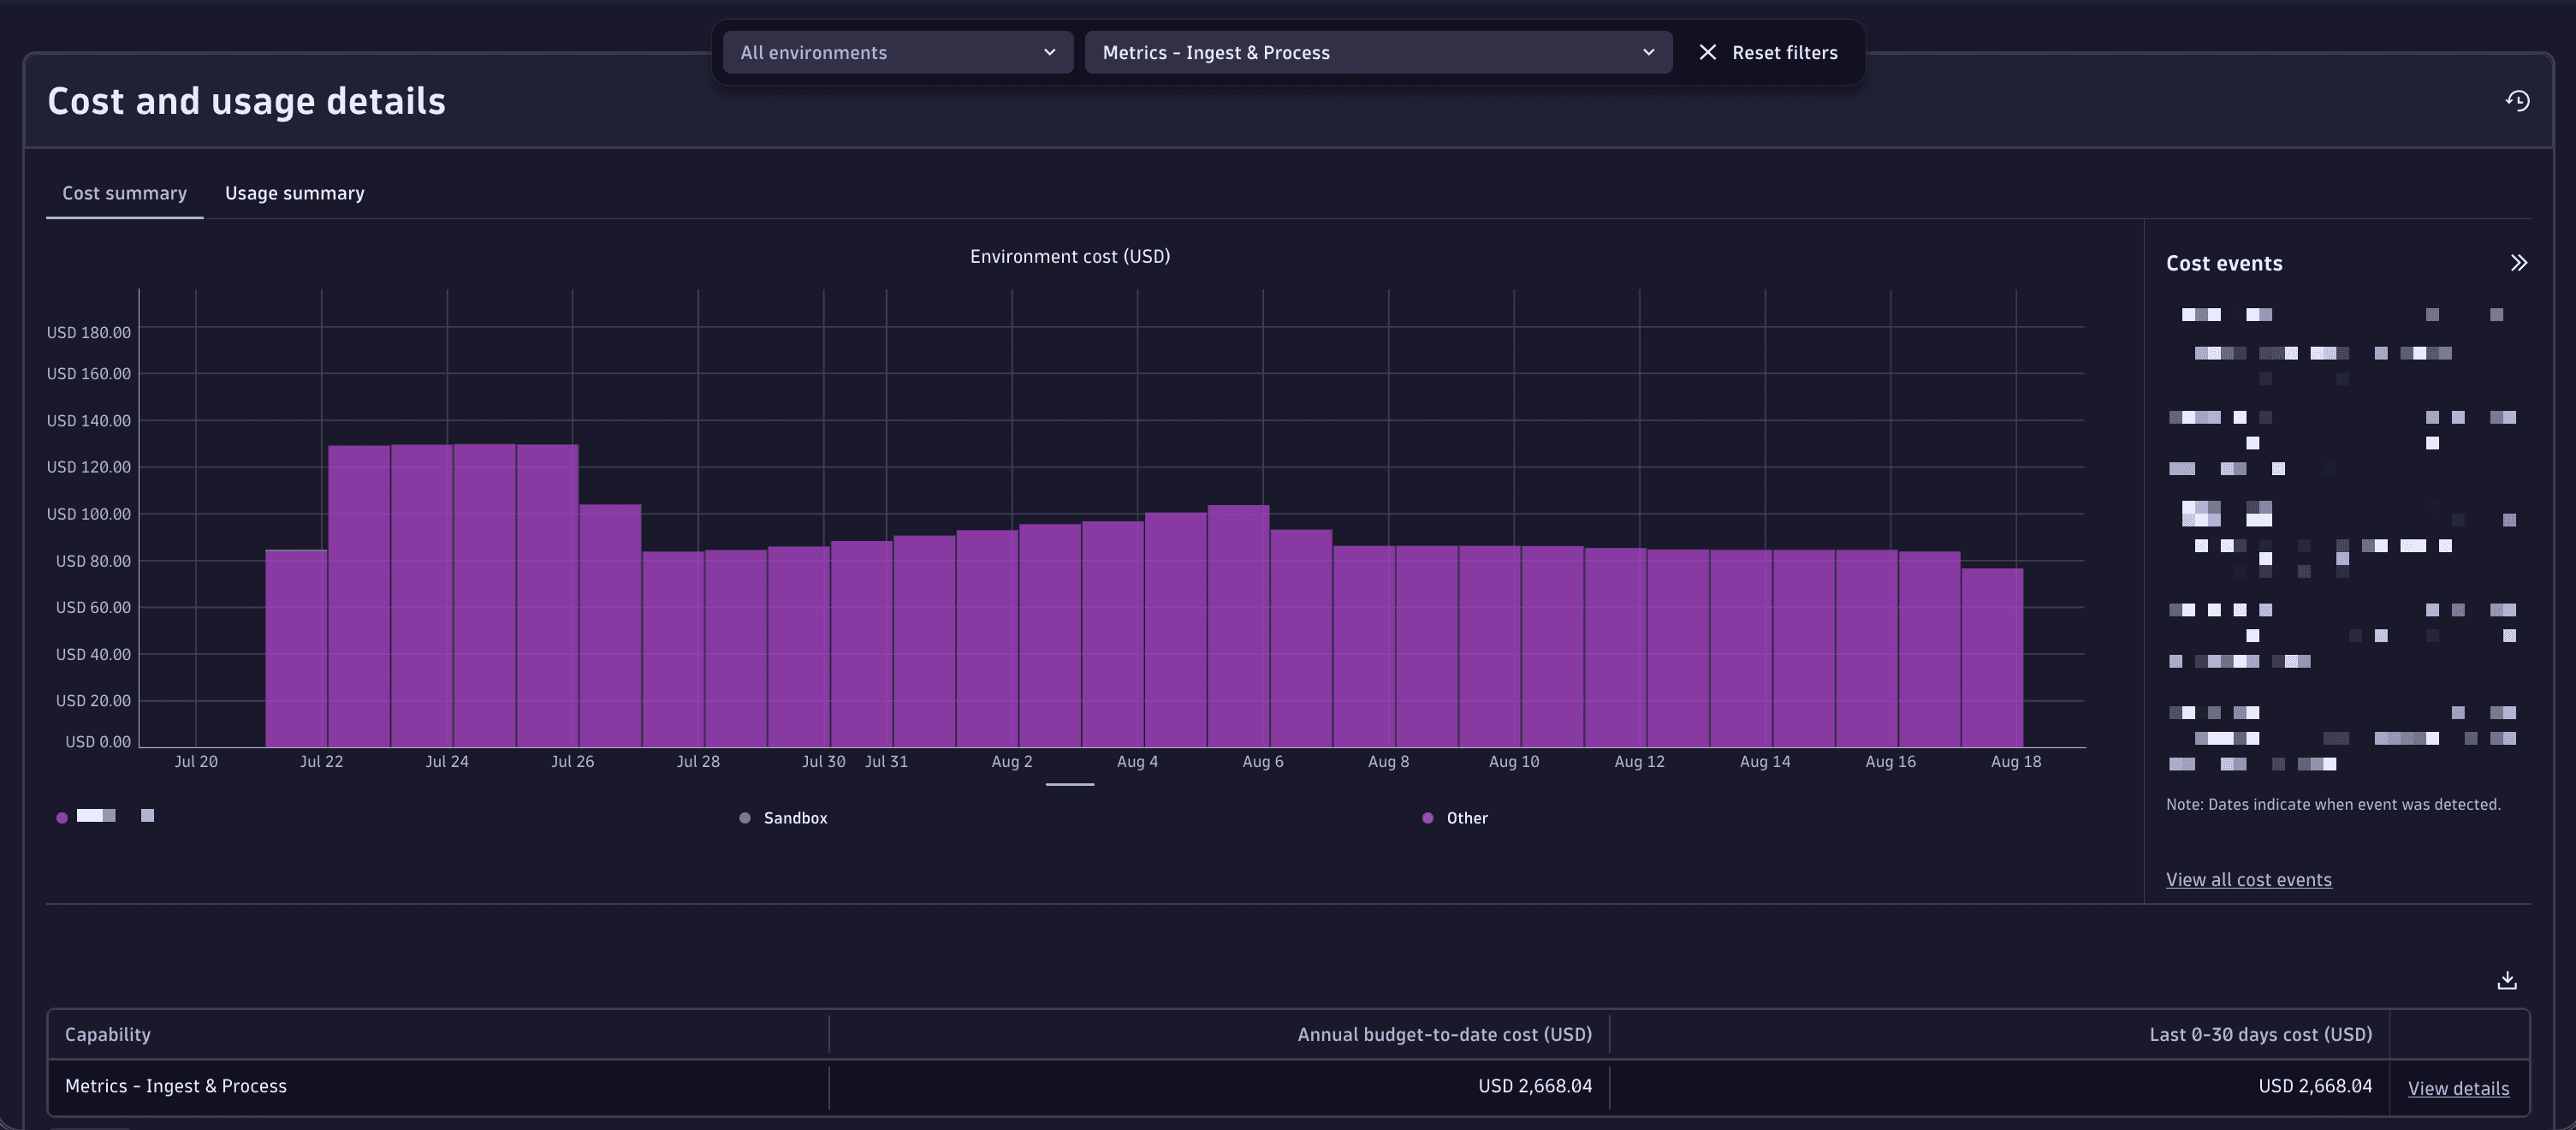
License managers can view usage and costs in Account Management.
-
Go to Account Management > Subscription > Overview > Cost and usage details > Usage summary.
-
Select Metrics - Ingest & Process > Actions > View details, or Metrics - Retain > Actions > View details. (Metrics - Query does not appear as a consumed capability because
timeseriesqueries are included.) -
From this screen, you can also drill down into usage detail on the capability level: select View Details next to the capability you want to explore.
For more information, see Overview (Dynatrace Platform Subscription).
Insights via billing usage events
Billing usage events (billing_usage_event) are system events emitted by Dynatrace that represent the authoritative record of billable usage.
Use them to build reliable cost dashboards and chargeback reports.
To learn more about billing usage events, see System event models.
Insights via API
Query Metrics consumption programmatically via the Account Management API for integration with external reporting systems. You can also query the underlying metrics through the Environment API – Metrics API v2.
Optimize your consumption
For best practices about how to optimize your metrics consumption, see Best practices for optimizing metrics cost.
FAQs
Do dimensions generate Metrics consumption?
A dimension does not generate a separate charge. Consumption increases only when distinct value combinations generate additional metric data points that are ingested and stored. Adding a dimension that doesn't increase the number of data points does not change consumption.
For more information, see Dimensions and consumption.
How do metric data points relate to timeseries?
Each measurement that a timeseries reports generates metric data points according to its type: one data point for a gauge or counter, and 10 data points for a histogram, except dt.service.* histogram metrics, which count as one.
For example, a gauge or counter timeseries that reports every minute generates 60 data points per hour, while a histogram timeseries that reports every minute generates 600.
Consumption is based on data points, not on the number of timeseries.
For more information, see Counting rules and granularity and Dimensions and consumption.
Why is data point billing more cost-efficient than timeseries billing in dynamic environments?
In dynamic environments with frequent pod restarts, short-lived jobs, and rolling deployments, distinct value combinations appear constantly. Some vendors count each of these as an active timeseries for the billing interval, such as an hour, regardless of how much metric data is sent. Dynatrace bills only for the metric data points that are ingested and stored.
For example, the metric http_requests_count has two value combinations. /checkout / 200 reports every minute, while /checkout / 500 reports only once within the hour.
| Timestamp | Metric key | URL | Status code | Value |
|---|---|---|---|---|
| 10:00 | http_requests_count | /checkout | 200 | 100 |
| 10:00 | http_requests_count | /checkout | 500 | 2 |
| 10:01 | http_requests_count | /checkout | 200 | 95 |
| … | http_requests_count | /checkout | 200 | … |
| 10:59 | http_requests_count | /checkout | 200 | 98 |
Over the hour, consumption is 61 metric data points: 60 for /checkout / 200 (one per minute), plus one for /checkout / 500. If this pattern repeats every hour over a 30-day month, consumption is as follows:
| Combination | Data points per hour | Data points per month |
|---|---|---|
/checkout / 200 | 60 | 43,200 |
/checkout / 500 | 1 | 720 |
| One-month total | 61 | 43,920 |
Although the /checkout / 500 combination appears in every hour, it adds only 720 data points over the month, about 1.6% of the total. If the same workload were counted as active timeseries per hour, it would count as two timeseries, and the /checkout / 500 combination would count the same as /checkout / 200, which reports every minute.
Are all dt.* metrics non-billable?
No.
Most dt.* metrics are non-billable, but documented exceptions apply to cloud metrics, operating-system-service metrics, source-dependent dt.service.* metrics, and specific Network Availability Monitoring metrics.
Use the exact lists under Which metrics are billable? rather than assuming the dt. prefix means non-billable.
Are all metrics from a Full-Stack Monitoring or Infrastructure Monitoring host included?
Built-in metrics are included for both Full-Stack and Infrastructure Monitoring.
Full-Stack and Infrastructure Monitoring also include a defined amount of custom metric data points. For information about metric data points that are included with these monitoring modes, see:
The following metrics can generate Metrics - Ingest & Process consumption for Full-Stack or Infrastructure monitored hosts:
- Custom metric data points that exceed included volume
- Custom metric data points that are not included with Full-Stack Monitoring
- Custom metric data points that do not originate at hosts and containers that are monitored by OneAgent in Full-Stack Monitoring mode
Does opening or refreshing a dashboard generate Metrics - Query consumption?
A dashboard tile that queries metrics with timeseries does not generate separate Metrics - Query consumption.
A dashboard query that reads logs, traces, events, or another billable data type can generate query consumption for that data type.