Understand and manage Container Application Monitoring consumption (DPS)
- Latest Dynatrace
- Licensing
- 8-min read
- Published Sep 14, 2026
Container Application Monitoring is a DPS capability that provides complete application performance monitoring for containerized workloads, including distributed tracing.
Built for teams running cloud-native container workloads, Container Application Monitoring is licensed with a flat container-hour model that makes costs easier to estimate and scales with modern workloads.
It is specifically built to support:
- OpenTelemetry-native environments: all monitored container workloads are instrumented via OpenTelemetry agents or SDKs.
- Dynatrace OneAgent-monitored workloads: all monitored container workloads are instrumented via OneAgent.
- Mixed setups: some container workloads are instrumented via OpenTelemetry and others are instrumented via OneAgent.
This page explains how Container Application Monitoring consumption is calculated, and how you can manage your Container Application Monitoring spend in Dynatrace.
How consumption is calculated
The unit of measurement for Container Application Monitoring consumption is container-hours, using the Container Application Monitoring rate card item.
Key terms
- Container
In the context of Container Application Monitoring, a container is any actively monitored container running in a supported environment.
- Container-hour
The unit of measure for Container Application Monitoring. One container-hour represents one hour of monitoring for a single container.
What's included in a container-hour
With Container Application Monitoring, you get automated root-cause analysis,  Services monitoring,
 Distributed Tracing, and metrics. It includes:
-
6,000 KiB volume of traces ingested per 15-minute interval, with a default 10-day retention.
- Trace volume that exceeds your included volume is charged as Traces - Ingest & Process.
- The included 10-day retention can be extended up to 10 years. Only the retention beyond the first 10 days is charged per-gibibyte as Traces - Retain.
-
300 metric data points per 15-minute interval, with a default 15-month retention. This covers billable metrics that can be attributed to a single opted-in container, including span-derived service metrics (keys starting with
dt.service.*).- Metric data points that exceed your included volume are charged as Metrics - Ingest & Process.
- The included 15-month retention can be extended up to 10 years and is charged on a per-gibibyte basis as Metrics - Retain.
Counting rules and billing granularity
-
Each container generates 0.25 container-hours for each 15-minute interval in which Dynatrace receives spans or metrics from it.
-
Container-hour consumption is calculated in 15-minute intervals. One 15-minute interval is equivalent to 0.25 container-hours. If a container is monitored for fewer than 15 minutes in a given interval, its consumption is rounded up to 15 minutes. This design accurately captures short-lived services, which are common in cloud-native environments.
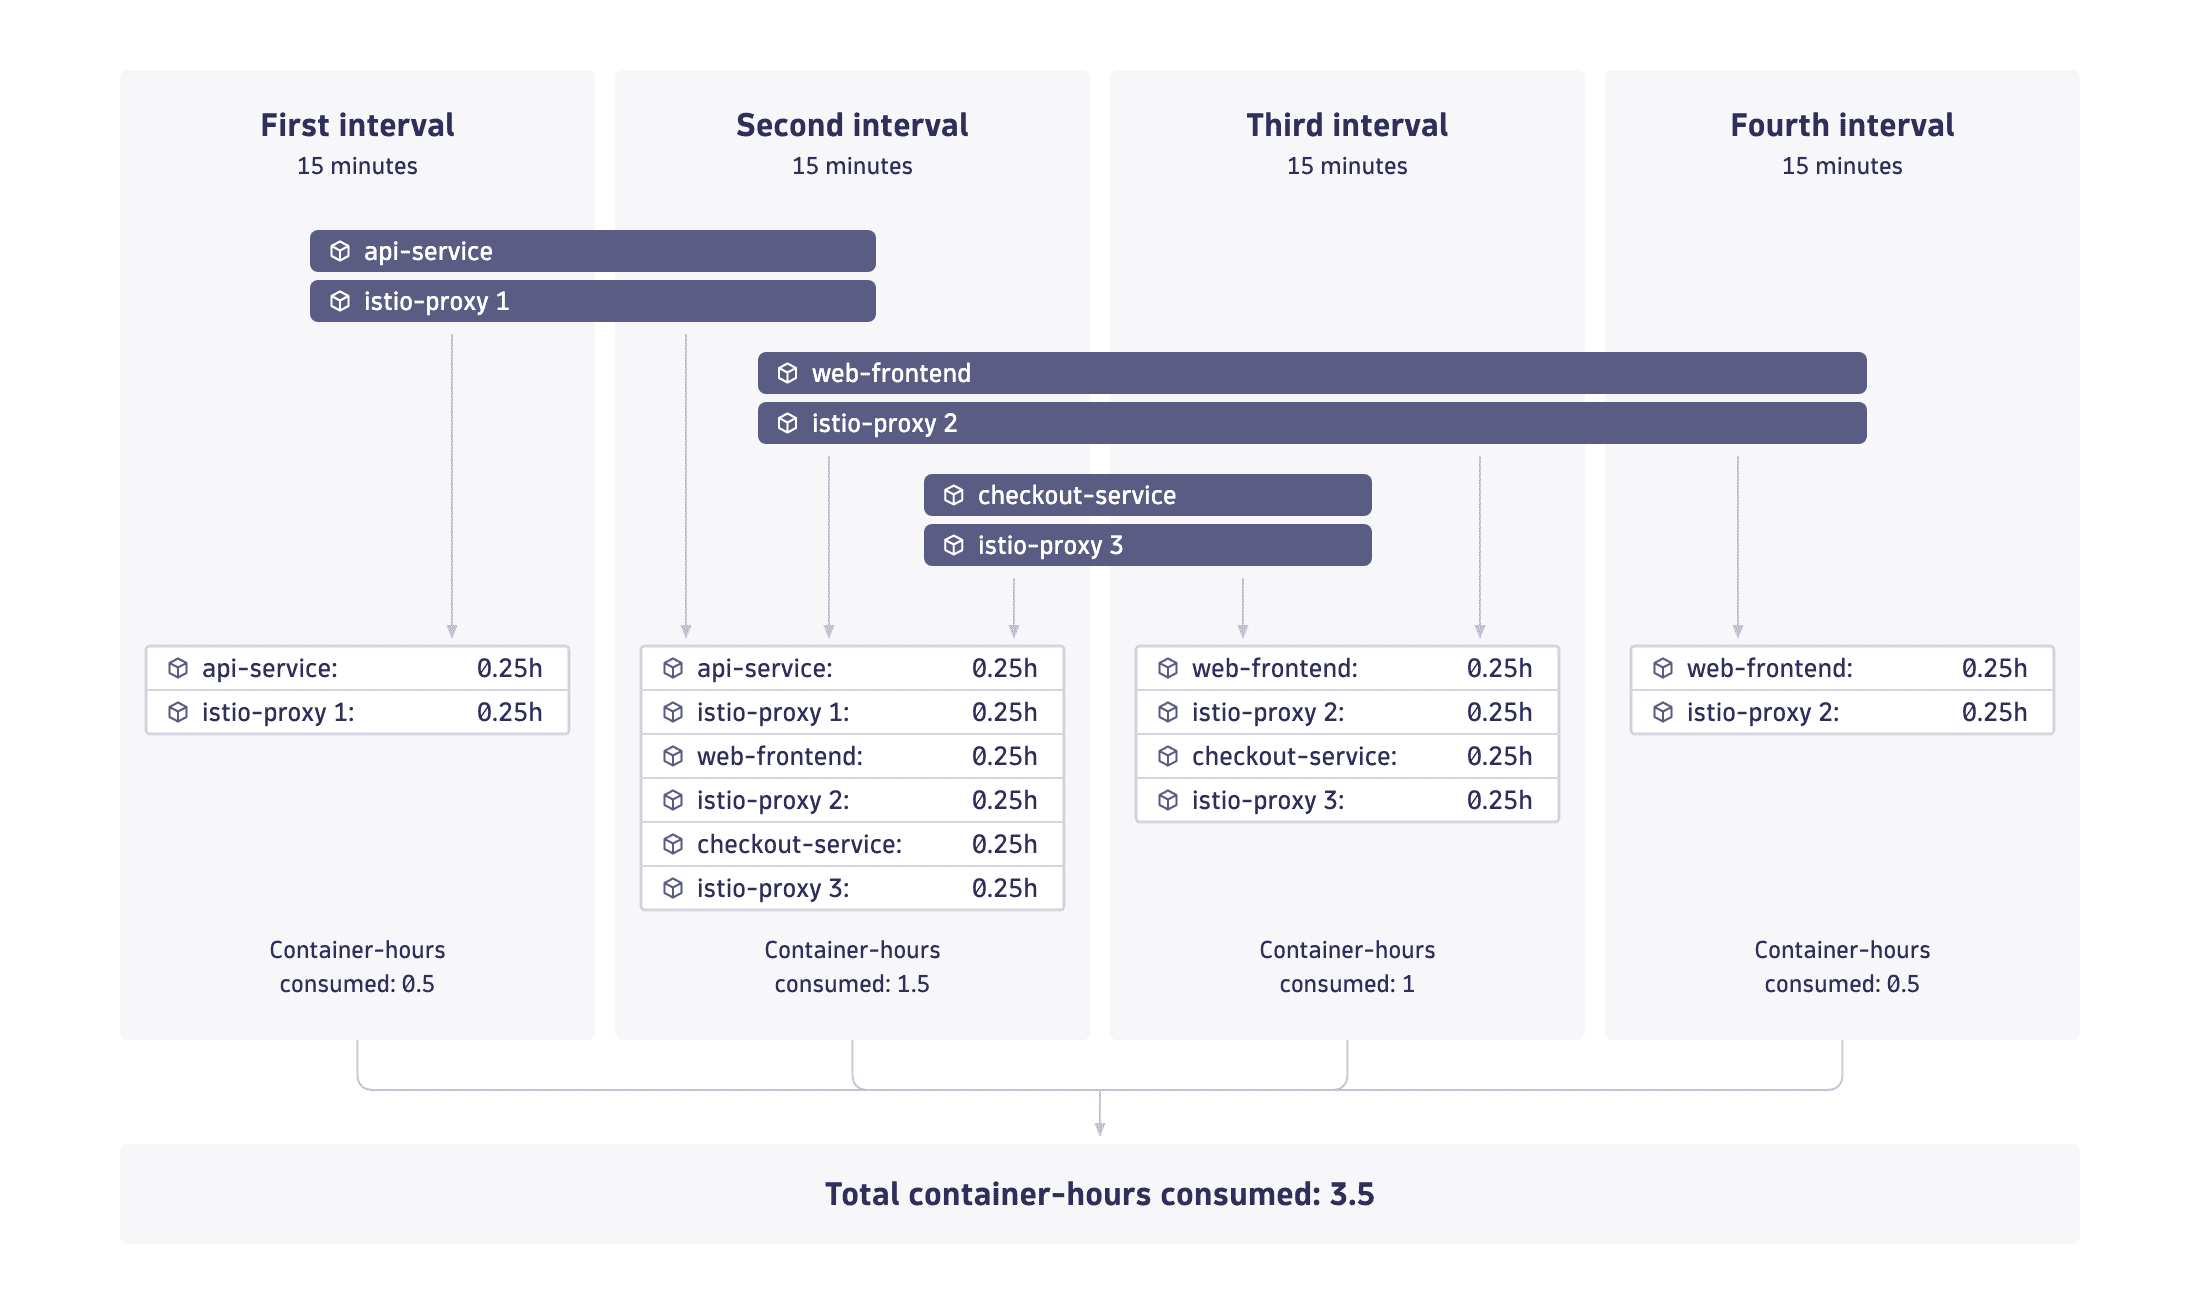
Calculation example
As an example, a team runs a data processing workload consisting of three application containers, each with an Istio sidecar.
The workload lifecycle is:
api-servicestarts when the workload begins and exits after 23 minutes.checkout-servicestarts whenapi-servicefinishes and runs for 15 minutes.web-frontendstarts 2 minutes aftercheckout-serviceand runs until the workload terminates at minute 54.- Each application container automatically receives its own
istio-proxysidecar.
Because container-hours are billed per container per 15-minute interval, 3.50 total container-hours are consumed.
The included volume is calculated per 15-minute interval based on the number of monitored containers:
| 15-minute interval | Containers monitored | Included trace volume | Included metric data points |
|---|---|---|---|
| First | 2 | 2 × 6,000 KiB = 12,000 KiB | 2 × 300 = 600 |
| Second | 6 | 6 × 6,000 KiB = 36,000 KiB | 6 × 300 = 1,800 |
| Third | 4 | 4 × 6,000 KiB = 24,000 KiB | 4 × 300 = 1,200 |
| Fourth | 2 | 2 × 6,000 KiB = 12,000 KiB | 2 × 300 = 600 |
Estimate your cost
The following examples demonstrate how to calculate your monthly cost for Container Application Monitoring.
-
Calculations are based on the following list prices (which may differ from your rate card prices):
- Container Application Monitoring: $0.007 per container-hour.
- Metrics - Ingest & Process: $0.15 per 100k data points.
- Traces - Ingest & Process: $0.2 per GiB.
- All costs are in USD.
-
One month is equivalent to 30 days, 24 hours per day.
-
200 containers are running continuously.
Cost example 1: Container-hours only
-
200 containers × 24 hours × 30 days = 144,000 container-hours per month
-
144,000 container-hours × $0.007 = $1,008 per month
This example assumes the following included trace/metric volumes:
-
Included trace volume: 6,000 KiB × 4 × 200 containers × 24 hours × 30 days = 3,295.9 GiB per month
-
Included metric data points: 300 × 4 × 200 containers × 24 hours × 30 days = 172,800,000 data points per month
Cost example 2: With extended trace and metric volume
This extends the example above with additional trace and metric volume: 1,500 GiB of trace volume and 10 million total metric data points are ingested over the last 30 days beyond the included volume.
-
200 containers × 24 hours × 30 days = 144,000 container-hours per month × $0.007 = $1,008 per month
-
1,500 GiB × $0.2 = $300 per month
-
(10 million excess data points) × ($0.15 per 100,000 data points) = $15 per month
-
Total: $1,008 + $300 + $15 = Total consumption: $1,323 per month
Understand your consumption
Dynatrace provides several ways to monitor and analyze your Container Application Monitoring consumption.
Insights via Account Management
License managers can view usage and costs in Account Management.
-
Go to Account Management > Subscription > Overview > Cost and usage details > Usage summary.
-
Select Container Application Monitoring > View details.
For more information about the subscription overview UI, see Overview (Dynatrace Platform Subscription).
Insights via usage dashboard
The Usage – Container Application Monitoring ready-made dashboard shows real-time estimates of your Container Application Monitoring consumption.
Open  Dashboards > Ready-made and search for Usage – Container Application Monitoring.
The dashboard covers:
- Container Application Monitoring usage in container-hours, as an overall trend and broken down by namespace, cluster, and hyperscaler.
- A breakdown of included versus extended trace volume.
For more information about ready-made dashboards, see Ready-made dashboards.
Insights via billing usage events
Billing usage events (billing_usage_event) are system events emitted by Dynatrace that represent the authoritative record of billable usage.
Use them to build reliable cost dashboards and chargeback reports by host, Kubernetes namespace, cloud account, or cost-center tag.
Each billing usage event for Container Application Monitoring contains:
- The DPS capability consumed (Container Application Monitoring).
- The usage amount in container-hours that contributes to billing.
- The time window the usage belongs to.
- The entity context (host, plus Kubernetes namespace and cluster or cloud account identifiers where applicable).
Insights via API
Query Container Application Monitoring consumption programmatically via the Account Management API for integration with external reporting systems. You can also query the underlying metrics through the Environment API - Metrics API v2.
FAQs
Can I combine Container Application Monitoring with other rate-card items?
Yes, with one exception: host monitoring of the same host. Container Application Monitoring can be combined with any other rate-card item, except host-based monitoring of the host its containers run on, such as Full-Stack Monitoring, Infrastructure Monitoring, or Foundation & Discovery.
Don't enable Container Application Monitoring on containers that run on a host monitored by OneAgent in any host monitoring mode. The host is already licensed through its host monitoring capability, and its containers would additionally be licensed in container-hours under Container Application Monitoring, which results in double licensing. For details, see Get started with Kubernetes platform monitoring + Application observability.
Kubernetes Platform Monitoring, Log Analytics, Code Monitoring, Real User and Synthetic Monitoring, and Application Security are also commonly used alongside it.
What is needed for Container Application Monitoring?
Container Application Monitoring requires:
- A Dynatrace Platform Subscription (DPS) license.
- A SaaS deployment.
- Any instrumentation that emits OpenTelemetry spans with the required resource attributes.
- Dynatrace OneAgent instrumented containers (via the code module).
- Optional Dynatrace Operator version 1.10+ for Kubernetes deployments.
Can I adopt Container Application Monitoring immediately after switching to DPS from Dynatrace classic licensing?
No. When your environment migrates from a Dynatrace classic license to DPS, Adaptive Traffic Management and the Full-Stack trace volume calculations are migrated as well. This is an automatic process that takes one week, and it must finish before you can use Container Application Monitoring.
You can start using Container Application Monitoring one week after the initial migration.
How does Container Application Monitoring work with OpenTelemetry?
Container Application Monitoring treats OneAgent and OpenTelemetry as equals: trace data from both sources counts against the same included trace volume per container-hour. Billable metrics emitted from both sources count against the same included metric data point volume per container-hour.
There is one important difference in how sampling is handled:
- OneAgent: Dynatrace automatically manages trace sampling via Adaptive Traffic Management. The sampler continuously adjusts the capture rate to keep ingested trace data within the included volume. You can extend Trace ingest and tell the system that you want to exceed the included trace volume, but that is an explicit opt-in within the Dynatrace configuration.
- OpenTelemetry: Dynatrace does not manage trace sampling for OpenTelemetry agents. If the OpenTelemetry collector, agent or SDK sends more trace data than the included 6,000 KiB per 15-minute billing interval per container, the excess is charged under the Traces - Ingest & Process rate card.
How do I attribute Container Application Monitoring usage to specific teams or applications?
We recommend using Cost Allocation with enrichment rules to attribute Container Application Monitoring usage to specific teams, or products.
Set up Cost Allocation and enrich your data with the appropriate Cost Allocation attributes, such as dt.cost.costcenter and dt.cost.product.
Usage details are also available at the application level. For more information about the available Container Application Monitoring attributes, see the Semantic Dictionary.
How does the included distributed tracing volume work?
Each monitored container adds 6,000 KiB of trace data per 15-minute interval to an included pool. Unused volume doesn't roll over to the next interval.
The pool covers trace data from both OneAgent and OpenTelemetry that can be attributed to a single opted-in container. How the pool is protected from overage differs by source:
- OneAgent: Adaptive Traffic Management adjusts the capture rate to keep ingested trace data within the pool. Trace data exceeds the pool only if you extend Trace ingest. Volume above the pool is then charged under Traces - Ingest & Process.
- OpenTelemetry: Dynatrace doesn't manage sampling. Trace data counts against the pool first; volume that exceeds it is charged under Traces - Ingest & Process. To stay within the pool, configure sampling in your OpenTelemetry collector, agent, or SDK.
Which metrics are included?
Container Application Monitoring includes a defined volume of custom metric data points for metrics from your monitored containers. This volume is based on total monitored container-hours and is calculated per 15-minute interval—300 metric data points are included per 15-minute interval. The included volume covers only applications that run in containers, and unused data points don't roll over to the next interval.
- Application performance monitoring metrics, other built-in metrics for containerized applications, and metrics from monitored containers, such as OpenTelemetry metrics, Spring Micrometer, and JMX, count against this pool first.
- Service monitoring metrics (
dt.service.*) also count against it when the span data comes from a Container Application Monitoring-monitored container. - A metric counts against the pool only if Dynatrace can attribute it to a Container Application Monitoring container.
- Infrastructure Monitoring metrics aren't part of Container Application Monitoring.
To attribute metrics to containers, enrich your metrics with the context that identifies the container they come from. Metrics without this context aren't correlated with the container, and are billed as Metrics - Ingest & Process from the first data point. Additionally, metric data points that exceed the included volume are charged as Metrics - Ingest & Process.
How is container-hour consumption affected by container size?
It is not. A container-hour is independent of the container's memory size, CPU requests, or resource limits. Each monitored container contributes one container-hour per hour, regardless of how large or small it is.
What happens if a container switches from Full-Stack Monitoring to Container Application Monitoring during a billing window?
Usage is metered per 15-minute billing window. If a container is licensed under Full-Stack Monitoring and under Container Application Monitoring within the same window, it's charged for both in that window.
How are distinct containers identified?
To count distinct billable units, Dynatrace generates a stable container identifier (dt.container.uid) during ingest.
You don't set dt.container.uid yourself, but Dynatrace generates it if the telemetry carries the container identity attributes for your platform, such as k8s.pod.uid and k8s.container.name on Kubernetes or aws.ecs.container.arn on Amazon ECS.
OneAgent and Dynatrace Operator can add these attributes for you. For OpenTelemetry, you may need to set them yourself or enable a resource detector.
For the attributes and setup per platform, see Where it's supported.
Telemetry without these attributes can't be attributed to a container and is charged as Traces - Ingest & Process and Metrics - Ingest & Process instead.
Which containers are supported by Container Application Monitoring?
For the supported environments and technologies, see Where it's supported.