Understand and manage Traces consumption (DPS)
- Latest Dynatrace
- Explanation
- 12-min read
Traces is a DPS capability for ingesting, retaining, and querying distributed trace and span data stored in Grail. Consumption is measured in GiB ingested, GiB-days retained, and GiB scanned when querying. This page explains how Traces consumption is calculated, what trace data is billable, and how to track and manage your usage.
Use traces to track requests end to end across distributed services, APIs, and serverless workloads. This applies to OpenTelemetry (OTLP) traces, OneAgent traces, and traces from serverless functions.
Traces consumption is based on the Ingest & Process, Retain, and Query licensing framework, which is common to all telemetry signals. For more information, see Telemetry overview (DPS).
How consumption is calculated
The units of measurement for Traces consumption are:
- Ingest & Process: GiB (gibibytes), measured before transformation in service detection and OpenPipeline.
- Retain: GiB-days for trace data retained beyond the included 10-day default retention.
- Query: GiB scanned during DQL query execution.
These are measured using the Traces – Ingest & Process, Traces – Retain, and Traces – Query rate card items, respectively.
Key terms
- Extended trace ingest
Trace data from Full-Stack Monitoring that exceeds the included trace data volume.
- GiB (gibibyte)
The data volume before transformation in service detection and OpenPipeline, independent of data source or protocol.
- GiB-day
The volume of processed span data stored in Grail, per day, before compression.
- GiB scanned
The volume of uncompressed span data read during DQL query execution.
Ingest & Process
The unit of measure for Traces - Ingest & Process is GiB (gibibytes).
- The GiB volume is calculated at the beginning of the pipeline: after all pre-processors, but before any regular processors such as transformation in service detection and OpenPipeline.
- It is independent of how the data is sent.
Dynatrace reserves the right to work with customers to adjust or disable parsing rules, processors, or pipelines that experience service degradation.
What's covered
The Traces - Ingest & Process rate card item covers:
- Distributed trace data from OpenTelemetry via the OTLP Trace Ingest API.
- Distributed trace data from serverless function ingest from OpenTelemetry or OneAgent.
- Extended trace ingest for Full-Stack Monitoring beyond the included trace data volume. (Trace data from Full-Stack Monitoring that falls within the included trace data volume does not generate Traces - Ingest & Process consumption.)
For all trace ingest, topology enrichment—which uses classic entities (dt.entity.* entity types) or Smartscape on Grail node types—does not increase billable span size.
Trace-related consumption billed under other rate-card items
The following trace-related consumption is billed via other DPS rate-card items:
- Traces included with Full-Stack monitoring: Full-Stack Monitoring includes a certain volume of included traces, see Full-Stack trace volume licensing types.
- Metrics extracted from traces: Custom metrics created from traces data are billed as Metrics - Ingest & Process, not as traces usage.
How GiB is calculated
Billed volume is calculated before transformation in service detection and OpenPipeline. The measured size is independent of the data source or protocol.
All three sources of billable ingest are summed to determine total Traces - Ingest & Process consumption:
(GiB via OTLP API) + (GiB via serverless) + (GiB of Full-Stack extended ingest, including fullstack-adaptive and fullstack-fixed-rate excess above the included volume) = total billable GiB
Full-Stack trace volume licensing types
When trace data from full-stack monitored sources exceeds the Full-Stack included trace volume, the excess is billed via Traces – Ingest & Process. Depending on how the excess was generated, it's attributed to one of the two licensing types:
fullstack-adaptive: Trace data managed by Adaptive Traffic Management that exceeds the Full-Stack included trace volume. Typically, this implies trace data captured by OneAgent, but it could also be Envoy configured to use adaptive traffic management as a sampling mechanism.fullstack-fixed-rate: Trace data from full-stack monitored sources that is captured via fixed-rate sampling or from OpenTelemetry instrumentation on full-stack monitored hosts, which exceeds the Full-Stack included trace volume.
Estimate your cost
Sum your billable trace sources to estimate monthly Ingest & Process consumption:
(GiB/day via OTLP + GiB/day via serverless + GiB/day extended ingest) × 30 days = GiB per month
At the list price of $0.20 per GiB:
GiB per month × $0.20 = cost per month
List prices are shown for illustration; your contracted rate-card prices may differ.
Retain
The unit of measure for Traces - Retain is GiB-days for data stored in Grail.
- The GiB volume is calculated in the last OpenPipeline step: after all processing (data parsing, enrichment, transformation, and filtering), but before the data is stored in buckets.
- The measured size is independent of source or protocol.
- The first 10 days of retention are included.
Extended retention for up to 10 years is billed as Traces - Retain when you explicitly configure it. Retention is configured per bucket and is independent of the trace ingestion source.
For Traces - Retain, data availability in certain apps is limited:
 Distributed Traces Classic provides access to only the first 10 days of retained data.
This app is superseded by
 Distributed Tracing.
 Services Classic provides access only to the first 10 days of retained data.
This app is superseded by
 Services.
 Multidimensional Analysis provides access only to the first 35 days of retained data.
This app is superseded by
 Notebooks.
Estimate your cost
To estimate your daily Retain consumption, at the list price of $0.0007 per GiB-day:
GiB of uncompressed span data stored beyond 10 days × $0.0007 = daily consumption
List prices are shown for illustration; your contracted rate-card prices may differ.
This applies once data has been retained for the full configured retention period; before that, consumption grows as data accumulates.
Query
The unit of measure for Traces - Query is GiB scanned.
Consumption is measured as the volume of uncompressed span data scanned during DQL query execution, regardless of query origin.
Specifically, this is the value in dt.retain.size on the span record of retained data, see Retain for how the size of retained data is measured.
Traces - Query consumption is generated when DQL queries scan span data in Grail. This could be from Notebooks,  Dashboards,
 Workflows, custom apps, or the API.
When a query reads other data types alongside spans, it can generate consumption for those capabilities, such as Log - Query.
Distributed Tracing and Services generate no query consumption—their usage is included with Dynatrace.
Understand your consumption
Dynatrace provides several ways to monitor and analyze your Traces consumption.
- Use the Usage - Traces ready-made dashboard for real-time consumption insights and optimization opportunities.
- Use Account Management for subscription-level totals, forecasts, costs, and breakdowns.
- Use billing usage events, the authoritative record of billable usage, to build cost dashboards and chargeback reports.
Insights via usage dashboard
The Usage - Traces ready-made dashboard shows real-time estimates of your Traces consumption.
Open Dashboards > Ready-made and search for Usage - Traces.
The dashboard covers:
- Query volume over time, broken down by source, with weekly query and user counts.
- The top 25 dashboards and notebooks by query volume, to identify frequently accessed documents running expensive queries.
- Top users and queries by billable volume, with DQL optimization suggestions to reduce scan volume.
- A per-bucket breakdown of included versus extended span retention.
Insights via Account Management
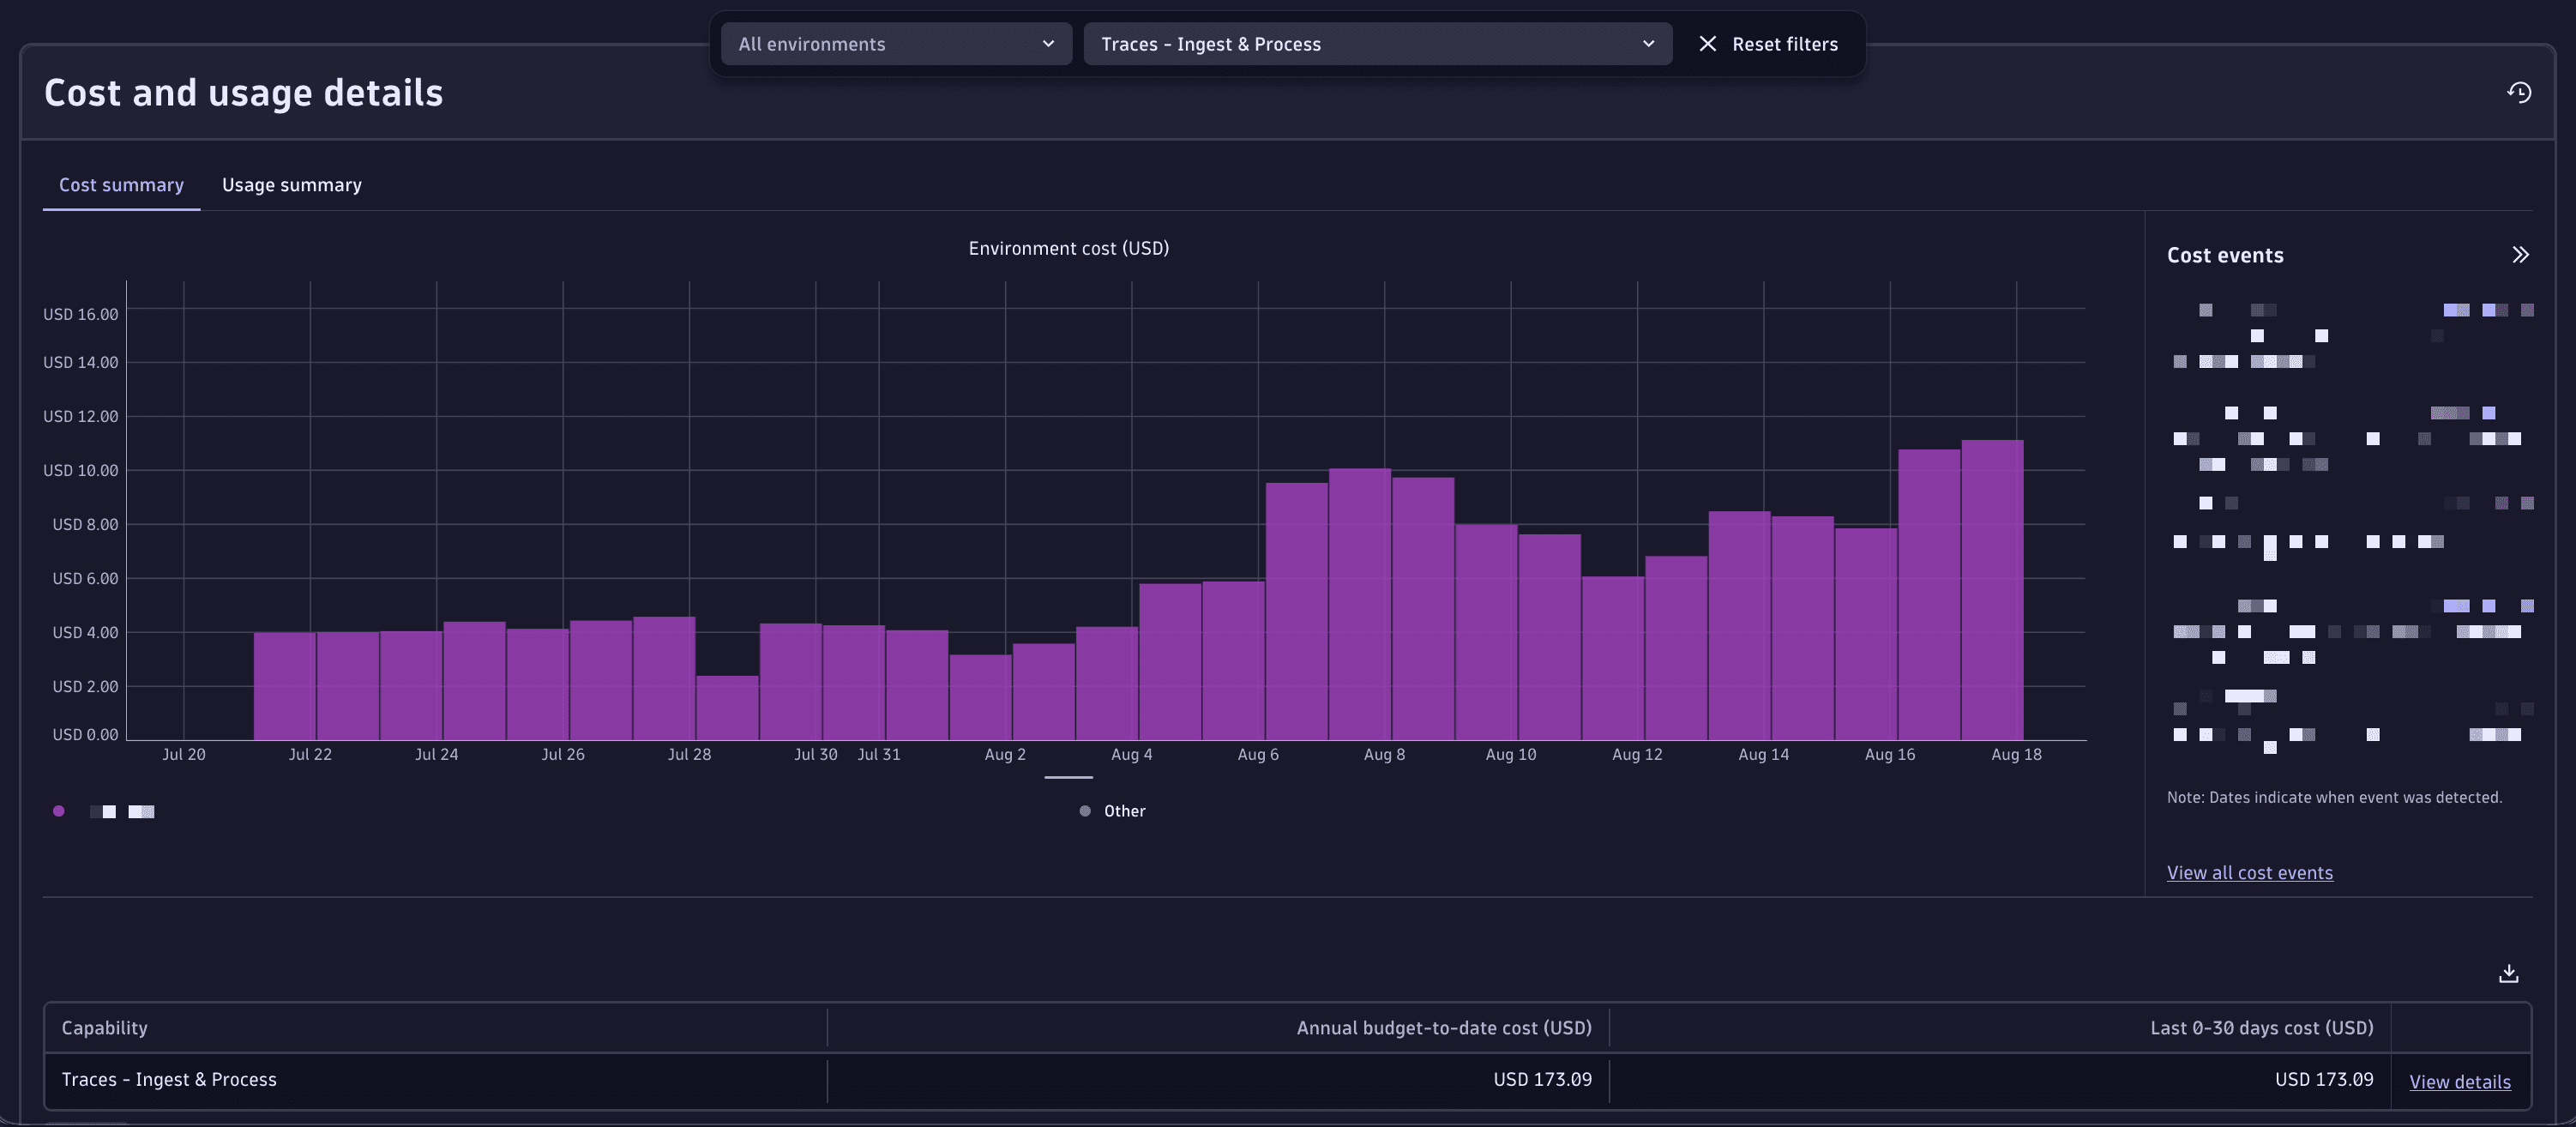
License managers can view usage and costs in Account Management.
-
Go to Account Management > Subscription > Overview > Cost and usage details > Usage summary.
-
Select Traces - Ingest & Process > Actions > View details, Traces - Retain > Actions > View details, or Traces - Query > Actions > View details.
-
From this screen, you can also drill down into usage detail at the capability level: select View Details next to the capability you want to explore.
For more information, see Overview (Dynatrace Platform Subscription).
Insights via billing usage events
Billing usage events (billing_usage_event) are system events emitted by Dynatrace that represent the authoritative record of billable usage.
Use them to build reliable cost dashboards and chargeback reports.
To learn more about billing usage events, see System event models.
Insights via API
Query Traces consumption programmatically via the Account Management API for integration with external reporting systems. You can also query the underlying metrics through the Environment API – Metrics API v2.
FAQs
Does using Distributed Tracing or Services generate Traces - Query consumption?
No. When you analyze traces and spans using Distributed Tracing or Services, no billable trace queries are generated.
What counts as extended trace ingest?
Extended ingest is Full-Stack Monitoring trace data that exceeds the included trace data volume defined by the Full-Stack Monitoring rate card item. The included volume is described in Extended Trace ingest for Full-Stack Monitoring.