Upgrade from classic to new cloud connections
- Dynatrace Classic
- Upgrade guide
- 15-min read
- Published Sep 21, 2026
This guide helps you plan and run an upgrade from classic to new cloud connections in  Clouds.
Why upgrade?
New cloud connections unlock Cloud Platform Observability on Latest Dynatrace and a new Clouds experience.
- No infrastructure to manage
Platform-managed cloud connections replace the ActiveGate (AWS, Azure) and self-hosted GKE workload (GCP) required by classic cloud connections. Dynatrace handles connection setup, telemetry ingestion, and topology discovery.
- Broader coverage with curated content
Broader and deeper coverage of AWS, Azure, and Google Cloud services. Ready-made dashboards and health alerts for each service are maintained by Dynatrace and available immediately after setup. Scope telemetry ingestion by cloud account, region, or cloud tag.
- Automatic topology mapping
Smartscape maps your full cloud environment within minutes, including resource-to-resource relationships. Query full resource configuration to analyze drift, resource consumption, or compliance posture.
- All data is queryable
Metrics, logs, events, traces, and topology from all cloud providers land in Grail. Query them with DQL across
Clouds,  Dashboards,
  Notebooks, and
  Workflows.
Use segments and primary Grail fields & tags as consistent filters across apps.
- AI-assisted analysis
Dynatrace Intelligence answers natural-language questions about your Grail data. Generative AI skills for AWS, Azure, and GCP are available in Dynatrace Assist or via the GitHub repository.
What is new?
When you upgrade to the new cloud connections, each cloud provider gets its own separate ingestion path, and all data is stored in Grail. To fully benefit from latest Dynatrace, the entity model and metric shape change from what you had before. These changes matter while upgrading, since you need to adjust existing dashboards, notebooks, alerts, or custom API integrations.
| Classic AWS Monitoring | New AWS Cloud Platform Monitoring | |
|---|---|---|
Connection and deployment | Classic AWS connections are based on Dynatrace ActiveGate and are scoped per AWS Account. | The new AWS connections use the Dynatrace platform to establish a connection between AWS and Dynatrace (no ActiveGate required). You can scope the deployment by AWS account or AWS Organization. |
Topology model | AWS resources are either represented as "built-in" entity types ( | AWS resources are represented as Smartscape nodes (entities) named from AWS resource types (for example, |
Metrics | Depending on the 3 different flavours of classic AWS connections (builtin vs cloud services vs metric streams), metric keys have different prefixes and patterns, ranging from | Metric keys are unified to |
Alerting | Alerting in Dynatrace classic is based on metric events and expressions. Classic metric events and anomaly detectors (including those enabled via | Alerting in latest Dynatrace is based on Dynatrace Query Language (DQL). You can use ready-made health alerts and alert templates provided out of the box for new cloud connections, or create custom alerts (based on DQL) using the new metric keys and Smartscape topology. |
Dashboards | Classic preset dashboards are provided for many AWS services based on classic AWS metrics and entity types. | New ready-made dashboards are provided alongside |
For a full mapping of classic entities and metrics to their new equivalents, see metric and entity mapping for AWS and Azure.
What is not changing?
- Cloud-side configuration
Existing IAM roles, service principals, and service accounts used for classic connections stay in place until you remove them.
New connections add their own authentication and don't reuse the classic credentials.
- Manual cutover
Classic cloud connections stay running until you turn them off. Existing connections are not automatically upgraded or removed.
- Historical data
Historical metric, entity, and topology data from classic connections is retained according to your environment's data retention settings.
The Explorer Classic tab in
Clouds and the classic AWS, Azure, and GCP apps continue to surface that data.
Breaking changes
-
Classic entity IDs and classic entity types do not carry over to new Smartscape nodes. A classic
EC2_INSTANCE-0A1B2C3D4E5F6789and the newAWS_EC2_INSTANCE-9F8E7D6C5B4A3210point to the same AWS virtual machine but are different entities in Dynatrace. -
Metric keys for cloud resources change when upgrading from classic to new cloud connections.
For a full mapping of classic entities and metrics to their new equivalents, see metric and entity mapping for AWS and Azure.
Capabilities not yet available
AWS CloudWatch Metric Streams Coming soon: Not yet supported by new AWS connections. If you rely on Metric Streams today, keep that classic ingestion path until support ships.
Plan your upgrade
First, see the high-level overview on how to upgrade:
- Create new cloud connections for your relevant cloud accounts.
- Upgrade all Dynatrace assets that depend on classic cloud connections (for example, dashboards, workflows, alerts, segments, IAM).
- Verify cloud data is properly enriched and alerting works.
- Disable (and remove) your classic cloud connections.
Best practices
-
Start with a low-risk account
Start with a development or staging cloud account to validate the end-to-end flow before making any changes to production.
-
Plan for the overlap when both connection types run against the same account/subscription/project
During the upgrade, you might have both, the classic and new connections, running against the same AWS account, Azure subscription, or GCP project for a limited period of time. Before you begin, it is worth understanding two effects of the overlap so you can manage them:
Classic and new connections can coexist across a mixed set of accounts. For example, some AWS accounts on classic while others use the new connection. What we don't recommend is running both connection types against the same AWS account, Azure subscription, or GCP project for an extended period, because doing so has a two-fold impact:
- Duplicated cost: Depending on your configuration, both connection types could independently ingest the same topology, metrics, logs and events, which means you could be billed for monitoring the same cloud services twice while both connection types are active.
- Cloud API throttling: Each connection makes its own calls to the cloud providers' monitoring APIs (for example, AWS CloudWatch), so running both roughly doubles the request volume against that account/subscription/project. Cloud Providers limit how many requests you can make in a given time window, and once this limit is crossed they begin throttling, delaying or rejecting requests until the rate drops back down. Throttling often first shows up as slower telemetry polling, though on large AWS accounts, Azure subscriptions, or GCP projects it can begin immediately as polling interruptions that leave gaps in ingested data.
For Azure specifically, the metric picker also shows entries from both connection types during the overlap, and a small number of metrics keep the exact same key in both. See Avoid key collisions with classic Azure monitoring to tell them apart.
Where your business requirements allow it, disabling the classic connection during the upgrade is always the preferred approach, since it avoids the overlap entirely. If a period of overlap is unavoidable, decommission the classic connection you are replacing as soon as the new one is validated, so you're not carrying duplicated charges or extra API load longer than needed. In case you expect a longer overlap, or you're already near your cloud providers' API limits, reach out to the support team of your cloud provider ahead of time to request rate-limit increases where available, which helps avoid throttling and the data gaps it can cause.
-
Decide on an alert strategy
Either create the new alerts in a disabled state and switch over at cutover (no alerting gap), or migrate alerts only after the classic connection is disabled (accepting a brief gap). The right choice depends on environment criticality.
Before you begin
Ensure you can meet the following prerequisites for being able to upgrade to new cloud connections
-
Dynatrace environment and license
- Dynatrace SaaS environment powered by Grail and AppEngine, hosted in a region eligible for new cloud connections.
- DPS license with the following capabilities:
-
Cloud provider IAM permissions
You need new credentials on the cloud side. New connections don't reuse the classic ones.
For per-cloud detail, see Create a new AWS connection, Create a new Azure connection, and Create a new GCP connection.
-
User permissions in
CloudsReview the full
Clouds prerequisites before you start. -
Latest Dynatrace concepts
Make sure that you are familiar with the most important concepts that are building the foundation of the Dynatrace platform. See upgrade to latest Dynatrace.
How to upgrade
The recommended sequence for each cloud account, subscription, or project:
Step 1: Set up new cloud connection(s)
The new cloud connections are conceptually different from classic cloud connections and need to be set up and configured independently. Since classic and new cloud connections can co-exist, create at least one new connection per cloud provider and Dynatrace environment in parallel to the classic cloud connection until you have verified all dependent assets are upgraded.
Start with a low risk non-production cloud account to validate the end-to-end upgrade flow before making any changes to all cloud connections.
Create new cloud connection
To create a new cloud connection from within Clouds:
-
Open
Clouds. -
In the upper-right corner, select Create connection and select the cloud provider you want to create the new connection for (for example, AWS New).
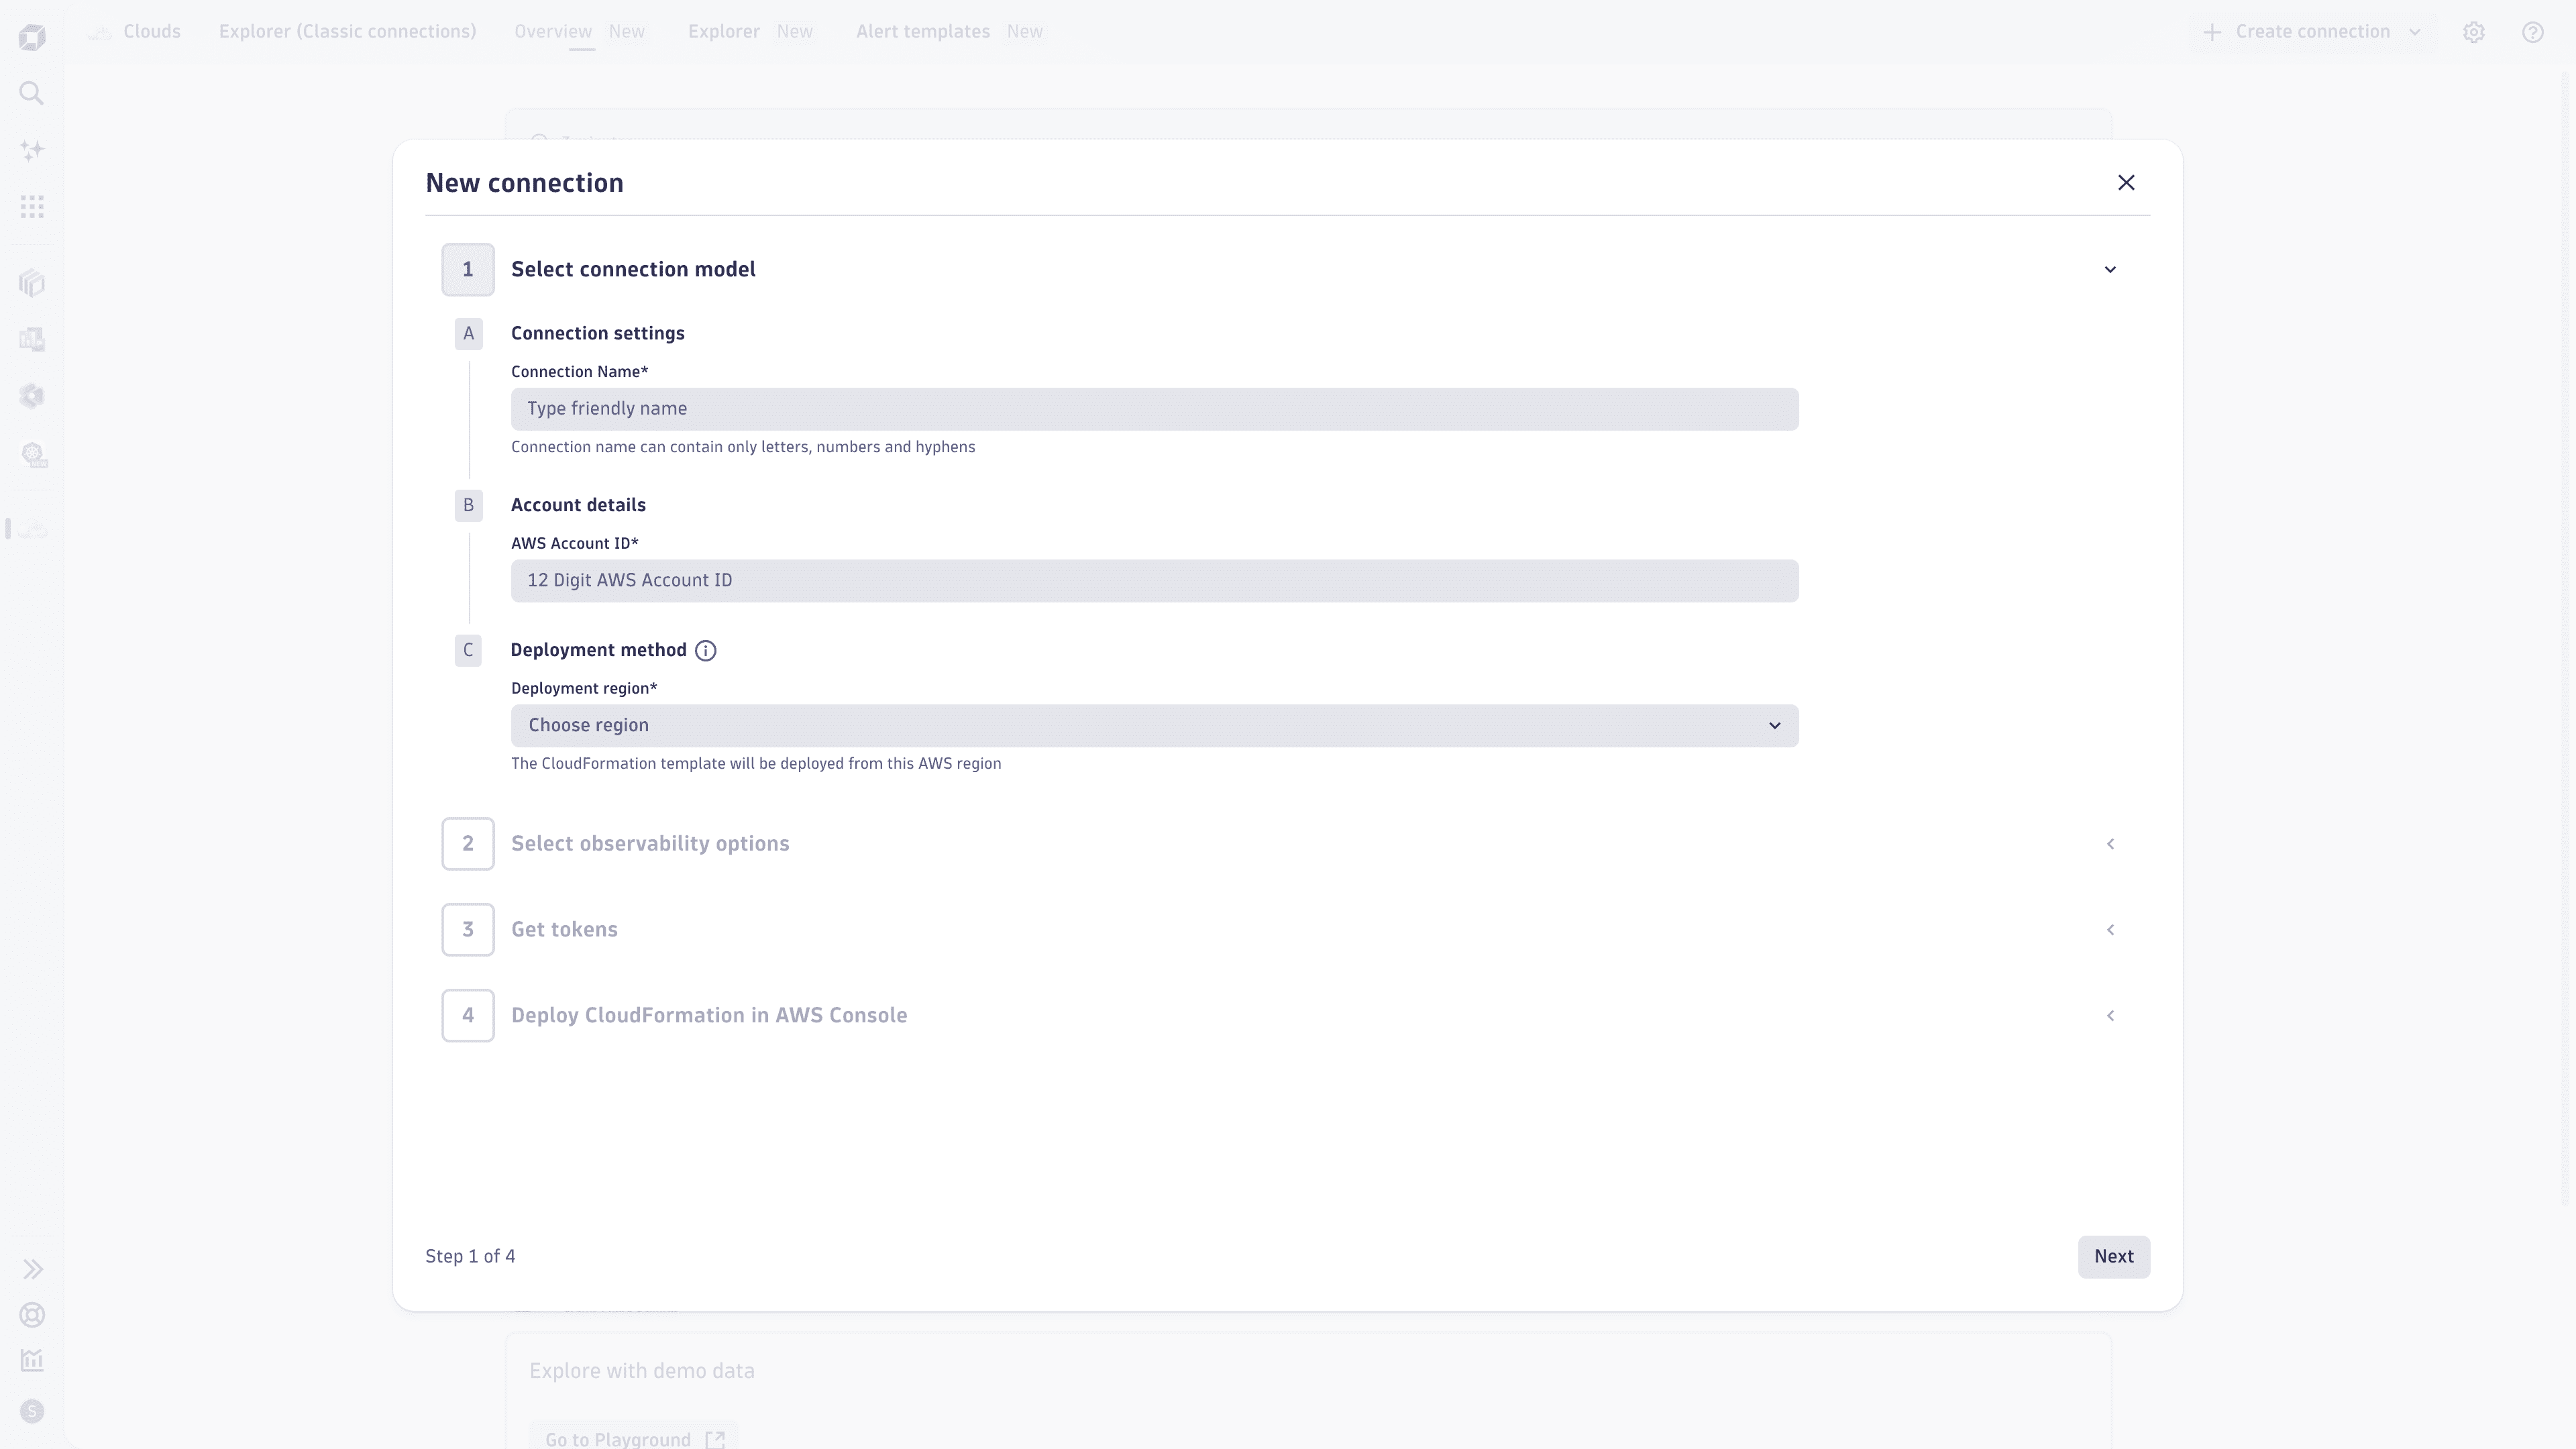 Clouds app | Create a new AWS connection
 -
Follow the steps outlined in New connection to start the onboarding process for a new AWS cloud connection.
Alternatively, you can create cloud connections directly in
 Settings . You can find additional information on how to create cloud connections, including guidance for an Infrastructure-as-code (IaC) setup and how you can scope cloud connections (for example, by using Cloud tags), in our ingest-related documentation sections:
Check connection health
Check the state and health of your cloud connection in Settings and ensure that the relevant connections are healthy before you proceed with step 2.
- Go to Settings > Collect and capture > Cloud and virtualization.
- Select AWS / Azure / GCP.
DQL examples - cloud accounts and connections
You can use the following DQL snippets to check your active cloud connections and accounts per cloud provider. After you’ve successfully created a new cloud connection, it takes up to 15 minutes to get your cloud inventory into Smartscape on Grail.
-
Classic AWS connections:
fetch dt.entity.aws_credentials, from:now()-12h| fields classicConnectionName = entity.name, awsAccountId, lifetime, id| sort awsAccountId, classicConnectionName- One row per classic AWS connection.
awsAccountId: AWS Account ID (numeric string, for example,"444652832050").classicConnectionName: Human-readable connection name configured in Dynatrace.id: Dynatrace entity ID for classic AWS connection (AWS_CREDENTIALS-*).
-
New AWS accounts(Smartscape on Grail):
smartscapeNodes AWS_ACCOUNT, from:now()-12h| fields id, name, `aws.account.id`aws.account.id: AWS account number (for example,"038026236411").name: AWS account alias (cloud-side display name, not Dynatrace connection name).
Step 2: Verify topology and telemetry ingest
After you’ve successfully created a new cloud connection, it initially takes up to 15 minutes to get your cloud inventory into Dynatrace to observe and analyze your cloud resources in-context (for example, Explorer tab view within Clouds).
Since classic and new cloud connections can be configured independently, we recommend that you verify the configuration of new cloud connections and ensure that you ingest all relevant topology and telemetry data into Dynatrace.
Smartscape topology
Make sure you can see and analyze the expected cloud services in Dynatrace. You can check the Smartscape topology either in Clouds,  Smartscape or by using DQL to directly query Grail.
DQL snippets
Use the following DQL snippet to get all Smartscape nodes per cloud provider grouped by type and cloud account.
-
AWS
smartscapeNodes "AWS*"| fields cloud.provider, aws.account.id, type| lookup [smartscapeNodes "AWS_ACCOUNT"| fields id, aws.resource.name, aws.account.id],sourceField:aws.account.id,lookupField:aws.account.id,prefix:"account_"| fieldsAdd aws.account.name = account_aws.resource.name| summarize count(), by:{cloud.provider, aws.account.name, aws.account.id, type} -
Azure
smartscapeNodes "AZURE*"| fields cloud.provider, azure.subscription, type| lookup [smartscapeNodes "AZURE_MICROSOFT_RESOURCES_SUBSCRIPTIONS"| fields azure.subscription, azure.resource.name],sourceField:azure.subscription,lookupField:azure.subscription,prefix:"subscription_"| fieldsAdd azure.subscription.name = subscription_azure.resource.name| summarize count(), by:{cloud.provider, azure.subscription.name, azure.subscription,type}- GCP
smartscapeNodes "GCP*"| fields cloud.provider, gcp.project.id, type| lookup [smartscapeNodes "GCP_COMPUTE_GOOGLEAPIS_COM_PROJECT"| fields gcp.project.id, name],sourceField:gcp.project.id,lookupField:gcp.project.id,prefix:"project_"| fieldsAdd gcp.project.name = project_name| summarize count(), by:{cloud.provider, gcp.project.name, gcp.project.id,type}
In case you are missing only specific cloud services, check the following:
- Which cloud region you have selected to monitor in your cloud connection.
- Whether you have defined a tag-based filter in your new cloud connection. Only cloud services matching the filter criteria are ingested into Smartscape on Grail.
- The required vs granted IAM permissions for the new cloud connection.
- The list of supported cloud services for the new cloud connections (AWS, Azure, Google Cloud).
Metrics
You can explore metrics either in Dashboards and Notebooks by using the metric selector or use the following DQL snippets to get a list of all metrics that are currently ingested from new cloud connections.
DQL snippets
Use the following DQL snippet to get all Smartscape nodes per cloud provider grouped by type and cloud account.
- AWS
metrics| filter startsWith(metric.key, "cloud.aws")| filter dt.da.source == "aws-metric-poller"| fields metric.key, aws.account.id| dedup metric.key
- Azure
metrics| filter startsWith(metric.key, "cloud.azure")| filter dt.da.source == "azure-metric-poller"| fields metric.key, azure.subscription| dedup metric.key
- GCP
metrics| filter startsWith(metric.key, "cloud.gcp")| filter dt.da.source == "gcp-cloud-monitoring"| fields metric.key, gcp.project.id| dedup metric.key
If you do not see any metric originating from the new cloud connection in Dynatrace, check whether you have enabled Metric ingest at all in your newly created cloud connection.
In case you are missing specific metrics, check the following:
- Which cloud region you have selected to monitor in your cloud connection.
- Whether you have defined a tag-based filter in your new cloud connection. Only metrics from cloud services matching the filter criteria are ingested into Dynatrace.
- The list of supported cloud services and metrics for the new cloud connections (AWS, Azure, Google Cloud). By default, Dynatrace uses a recommended subset of available metrics for the most important cloud services. You can adjust the selected cloud services and metric configurations for each cloud service in your respective cloud connection.
Logs
Logs originating from the new cloud connection are enriched with the following attribute:
- AWS:
dt.da.source="aws-log-ingest" - Azure:
dt.da.source="azure-log-ingest"
In case you are missing logs from the new cloud connections, check the following:
- Whether you have enabled log ingest in your newly created cloud connection
- Which cloud region you have selected to monitor in your cloud connection
- The specific documentation sections (AWS logs, Azure logs, Google Cloud)
Step 3: Identify and upgrade dependent assets
Consider the following types of assets in Dynatrace that might (still) depend on classic cloud entities or metrics/logs/events originating from classic cloud connections:
- (Custom) Dashboards
- Alerts (Metric Events for Alerting, DQL-based anomaly detectors) and alerting profiles
- SLOs
- Workflows
- Notebooks
- Custom API Integrations (using Dynatrace API)
- Classic autotagging and management zones
You can either identify and upgrade dependent assets manually or by using an AI-assisted approach.
Asset impact awareness
Dashboards
-
Classic dashboards that were provided out-of-the-box alongside classic cloud connections (preset dashboards) are replaced with new ready-made dashboards for the most important cloud services. You can find a list of all ready-made dashboards that are released alongside
Clouds when you search for Cloudsin Hub in the Contents tab. -
(Custom) classic dashboards need to be upgraded to latest Dynatrace. See Upgrade from Dashboards Classic to Dashboards.
-
Classic or latest Dashboard tiles and filters using classic cloud metric keys (
dt.cloud.<provider>.*,builtin:cloud.<provider>.*,ext:cloud.<provider>.*) or entity selectors (fetch dt.entity.<classic_type>) need new metric keys and DQL-based Smartscape queries.
Alerts
-
Metric event based alerts: Replace metric event based alerts with ready-made health alerts and/or create custom alerts (for example, based on cloud alert templates) using new metric key and entities (AWS or Azure). See upgrade guide for metric alerting for detailed instructions on how to upgrade classic metric events to custom alerts.
-
Anomaly detectors and custom alerts: Replace DQL-based custom alerts with new cloud metric keys and entities (AWS or Azure).
-
Anomaly detection for classic AWS services: Switch to ready-made health alerts to replace classic alerts that were enabled in classic infrastructure anomaly detection settings for AWS (
builtin:anomaly-detection.infrastructure-aws) -
For Alert notifications, see upgrade guide for alert notifications.
Workflows & Notebooks
Any workflow step or notebook section that uses classic cloud entity types or metric keys, for example, within a DQL query, needs the new equivalents (AWS and Azure).
SLOs
SLOs that use metric selectors against classic cloud metric keys must be converted to DQL and updated to the new metric keys. DQL based SLOs using classic cloud metric keys need to get updated to the new metric keys. See metric and entity mapping for AWS or Azure.
Tags and management zones
Autotagging and management zones are conceptually replaced with primary Grail tags, segments, and many new IAM capabilities. Familiarize yourself with the following explanations and guides:
Metric and entity mapping
See detailed mapping tables from classic to new cloud entities and metrics for AWS or Azure.
Update dependent assets
Update all relevant assets that you have identified in the previous step.
For alerts and anomaly detectors, re-create the inputs against the new metric keys (consider creating them disabled to avoid double alerting).
For environments with many accounts and a large dashboard/alert/SLO inventory, see Need help with a large estate?.
Step 4: Switch over to new cloud connections
Configure the new cloud connection to ingest all telemetry data you are expecting. Once new metrics flow and the migrated assets work, disable the classic connection. Keep it disabled (not deleted) for one to two weeks as a rollback buffer.
- AWS: Disable via Settings > Collect and Capture > Cloud and virtualization > AWS Classic (schema
builtin:cloud.aws). - Azure: Disable via Settings > Collect and Capture > Cloud and virtualization > Azure Classic (schema
builtin:cloud.azure). - GCP: Stop or remove the GKE workload that runs the classic integration.
Step 5: Decommission classic connection
After the buffer period, with no remaining dependencies, you can delete the classic connection. Deleting a connection is an operation that can't be reverted.
Historical classic data remains in Dynatrace and ages out according to the respective data retention policy.
Need help with a large estate?
For environments with many cloud accounts and a significant inventory of dashboards, alerts, and SLOs that reference classic cloud data, we offer an assisted migration.
Your Dynatrace Account Team can coordinate a guided exercise that discovers your active classic connections, scans your dashboards, alerts, and SLOs for classic references, produces a per-asset remediation plan, and supports you through the cutover.
Reach out to your Dynatrace contact if you'd like to scope this for your environment.
FAQ
Will my classic data disappear when I disable the classic connection?
No. Disabling a classic connection stops new data ingestion from classic polling, but existing metrics, entities, and topology data are retained according to your environment's retention settings.
You can still query historical classic data and continue to use the Explorer (Classic connections) tab.
Can I run classic and new connections on the same AWS account or Azure subscription?
Technically yes, but we strongly advise against it as a long-term setup. During an upgrade, a temporary overlap on the same account is expected. Once the upgrade is complete, you should not leave both connection types running against the same AWS account, Azure subscription, or GCP project on an ongoing basis.
Classic and new connections can safely coexist across a mixed set of accounts. For example, some AWS accounts on classic while others use the new connection. The recommendation is only against pointing both at the same account/subscription/project long-term, because it has two effects:
- Duplicated cost: Depending on your configuration, both connections may independently ingest the same metrics, logs, and events, which means you could be billed for the same data twice while both are active.
- Cloud API throttling: Each connection makes its own calls to the cloud provider's monitoring APIs (for example, AWS CloudWatch), so running both roughly doubles the request volume against that account/subscription/project. Cloud Providers cap how many requests you can make in a given window, and once this limit is crossed they begin throttling, delaying or rejecting requests until the rate drops back down. Throttling often first shows up as slower telemetry polling, though on large AWS accounts, Azure subscriptions, or GCP projects it can begin immediately as polling interruptions that leave gaps in ingested data.
If you're overlapping on Azure, also see Avoid key collisions with classic Azure monitoring for the small number of metrics whose key doesn't change between classic and new.
Once your upgrade is validated, decommission the classic connection so you're not carrying duplicated charges or extra API load on that account/subscription/project.
I use AWS CloudWatch Metric Streams—can I migrate today?
Metric Streams is not yet supported in new AWS connections, so accounts that rely exclusively on Metric Streams should wait.
If the account also uses classic polling-based AWS metrics, you could partially migrate that portion to a new connection and continue using the Metric Streams pipeline in parallel until new connection support ships.
Do my existing dashboards keep working during the parallel run?
Yes. Dashboards built on classic metric keys and entity types continue to render from classic data for as long as the classic connection runs.
Once you disable the classic connection, those dashboards stop receiving new data, which is why you re-point them to the new metric keys before cutting over.
When should I delete (rather than just disable) the classic connection?
Keep the classic connection disabled for one to two weeks after cutover as a rollback buffer.
Once you're confident that all migrated dashboards, alerts, and SLOs are functioning and no further dependencies surface, you can delete the classic connection.
Historical classic data is retained independently and is not affected by the deletion.
CloudsInfrastructure Observability