Support for SQL bind variables
- Dynatrace Classic
- How-to guide
- 4-min read
Bind variables are a means of parameterizing SQL statements so that the statements have question marks or parameters in their where clauses, such as:
- SQL server:
select count (*) from report where tenant = @tenant - Java JDBC:
select count (*) from report where tenant = ?
Bind variables allow the database server to prepare the statement once and execute it multiple times without reparsing or reanalyzing it.
Bind variables aren't applicable to statements that use literals, such as:
select count (*) from report where tenant = ‘xxxx’
These statements can't be parameterized and are reparsed and reanalyzed by the database server with each execution.
Bind variables generate high network and storage demands. To learn more about bind variables support and its availability, see FAQ below.
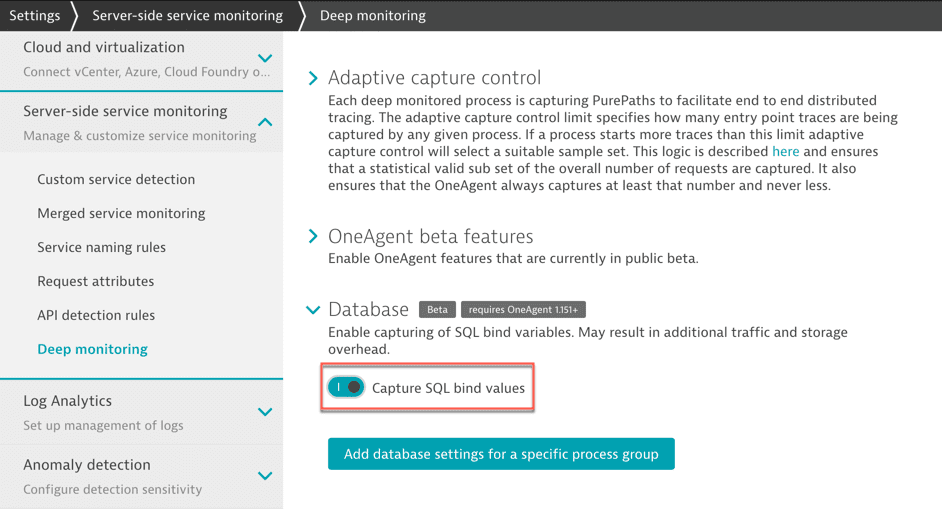
Enable capture of SQL bind variables
To enable SQL bind value capture
- Go to Settings > Server-side service monitoring > Deep monitoring.
- Expand Database and turn on/off Capture SQL bind values on the global level.
- Optional To override the global setup, go to Process group override.
- To add an override, select Add process group override and select the affected process group.
- Optional To select a specific process from the selected process group, select the process from the dropdown list.
- Select Add.
- Select Save changes.
Whether you enable this setting site-wide or for individual process groups, you can use Dynatrace OneAgent to capture the values of bind variables. This is applicable to the following technologies:
- ADO.net
- JDBC
- PHP database frameworks
If the array returned by executeBatch() contains more than one element, indicating multiple commands were executed, Dynatrace masks the values of the bind variables to ensure data privacy. This is because different executions of executeBatch() may aggregate multiple commands, necessitating the masking of bind variable values to prevent the exposure of sensitive information.
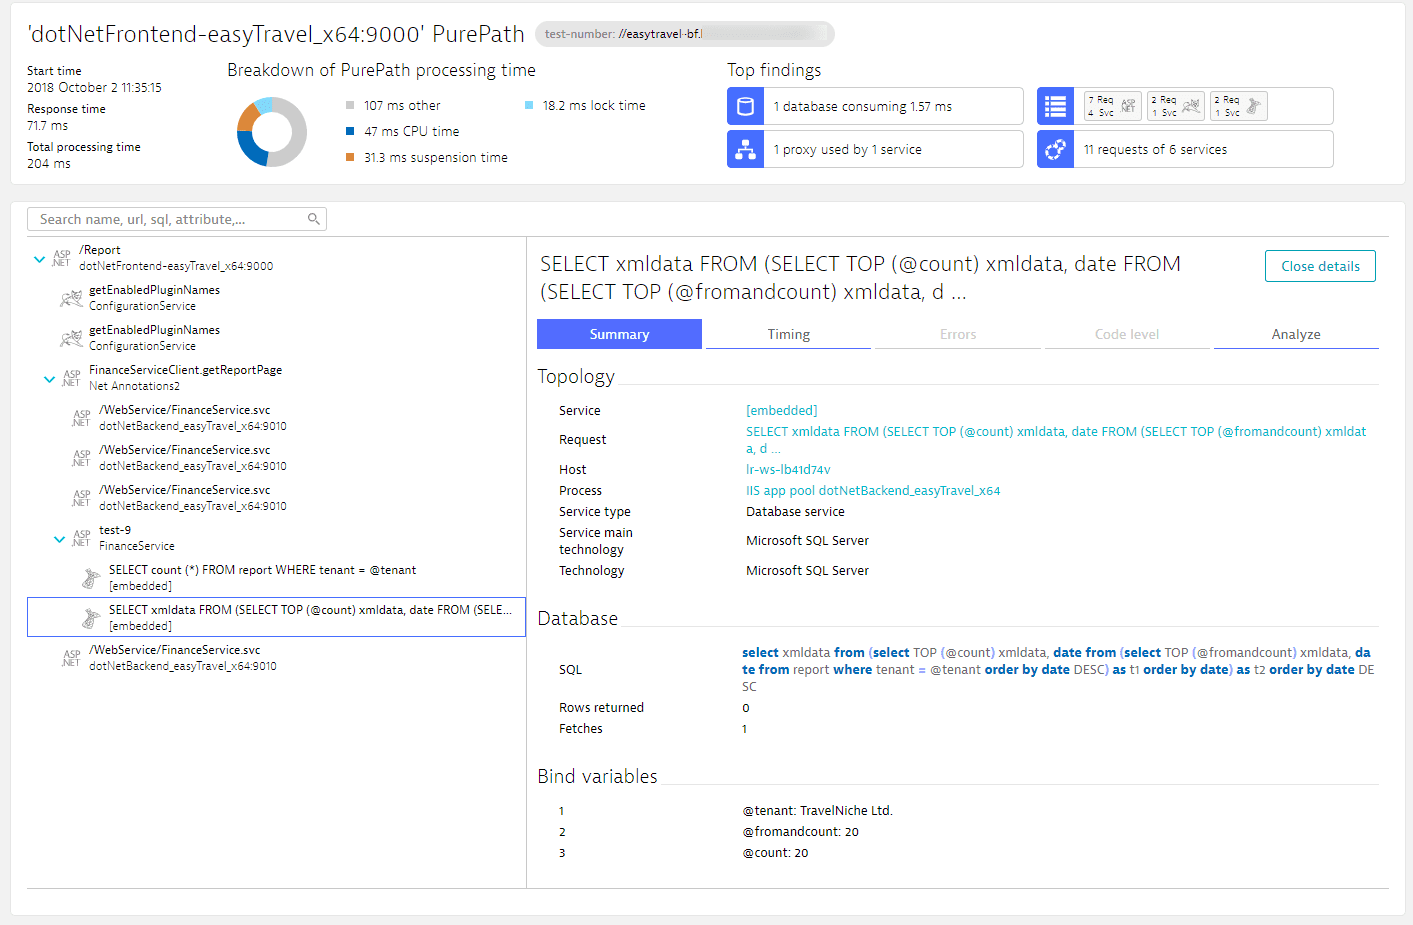
Example of masked and unmasked SQL bind values
A sample result of this feature is distributed tracing. The following webpage illustrates the masking of bind variables.
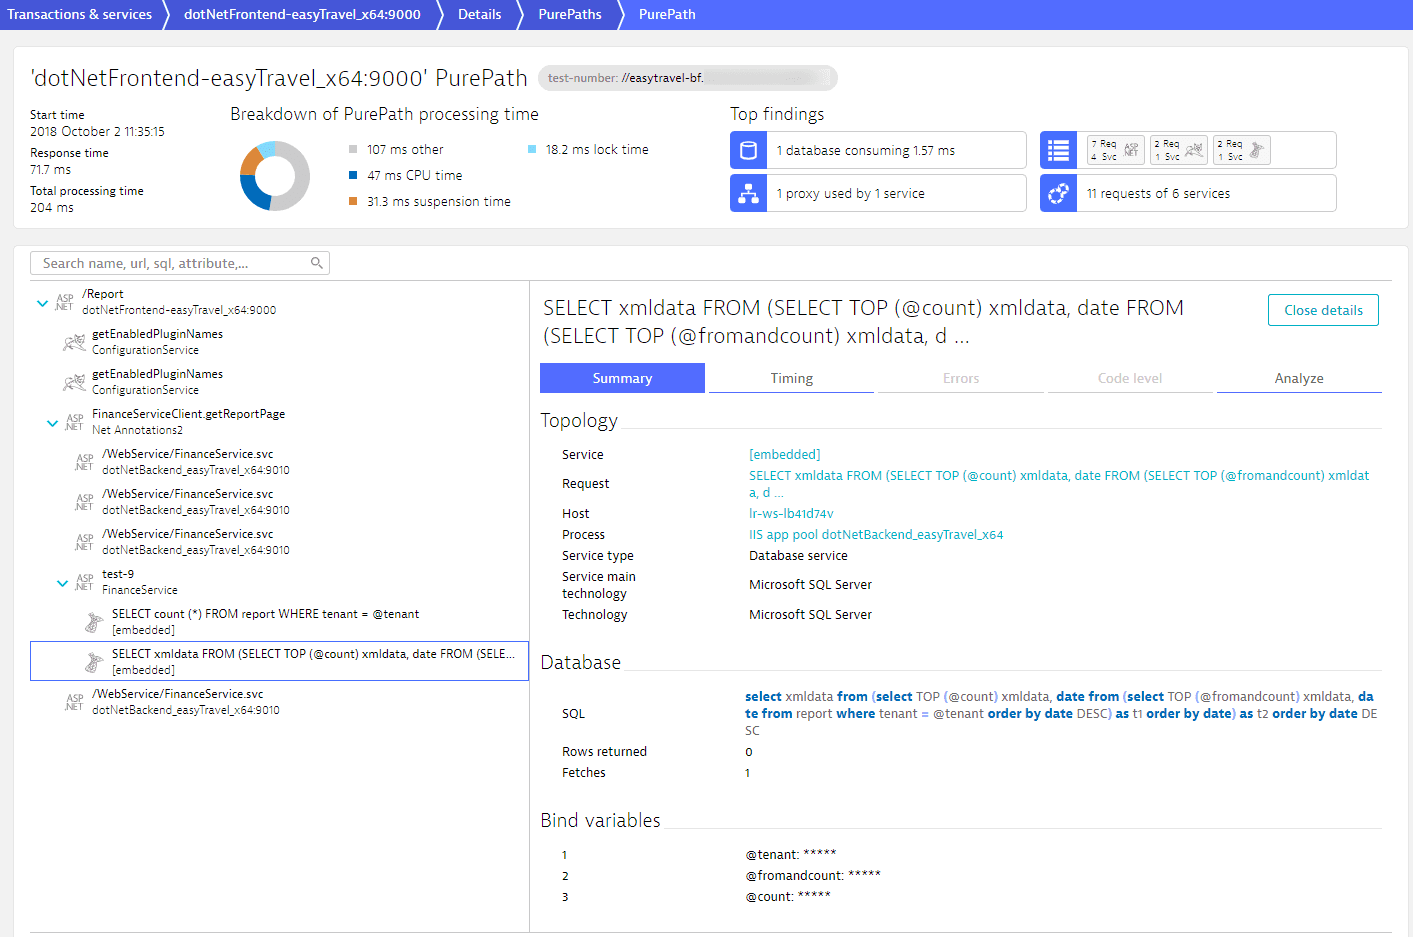
Bind variables are considered confidential as they can contain IDs and other sensitive values. Learn how to ensure the data privacy of your customers.
Only users who have permission to view a specific entity or management zone can view the bind variables within that entity or zone.
FAQ
Bind variables are not available in my Dynatrace environment. How do I get this feature?
This feature is available in Dynatrace environments that are licensed via Dynatrace Platform Subscription (DPS). If you have a Dynatrace classic license, change your subscription plan to a Dynatrace Platform Subscription (DPS) license to use bind variables.
Does capturing bind variables have negative consequences?
This feature can capture a lot of sensitive data, so you should consider its usage carefully. You might also choose to mask or drop parts of the captured data via OpenPipeline.
Additionally, this feature can capture a lot of data in the absolute sense. Heavy usage of this feature means that you will run out of the included trace volume for your Full-Stack monitored applications faster. In other words, heavy usage can lower your trace capture rate. To mitigate this, you should either use this feature for troubleshooting only or you can opt into Extended trace ingest to accommodate the increased data volume.