Dashboards
- Latest Dynatrace
- App
- 10-min read
Prerequisites
Permissions
The following table describes the required permissions.
With  Dashboards, you can create powerful, data-driven documents for custom analytics.
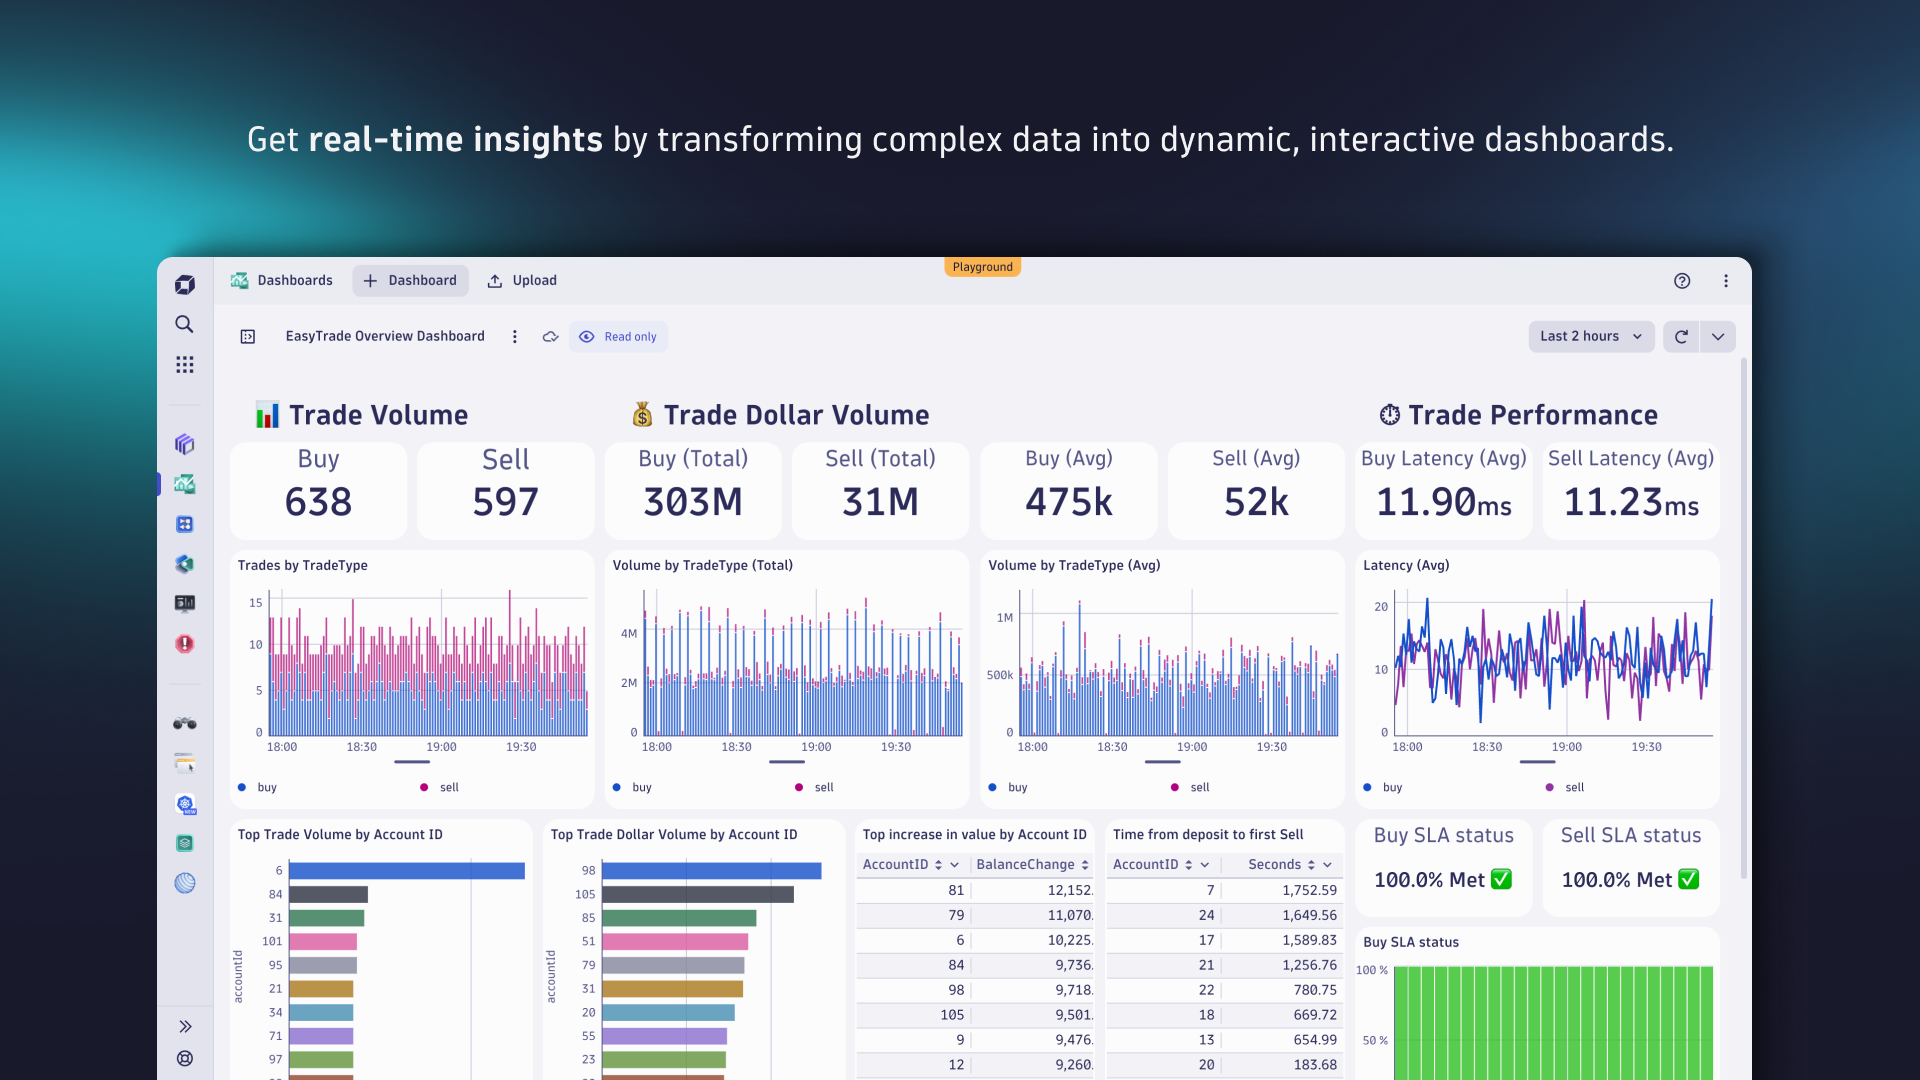
These procedures describe the basics of using Dashboards and get you started on the way to customizing and creating your own dashboards.
Use dashboards
Use shortcuts
Keyboard shortcuts help you work faster in Dashboards.
To list keyboard shortcuts, in Dashboards, open the menu and select Keyboard shortcuts or use keyboard shortcut Shift+?
| Action | Keyboard shortcut |
|---|---|
General | |
Multiselect tiles | Select a tile, press Space to get a double border around the tile, use arrow keys to go to another tile, and then press Space again to select multiple tiles |
Select all tiles | Ctrl/Cmd+A |
Delete selected tiles | Del |
Copy selected tiles to clipboard | Ctrl/Cmd+C |
Paste tiles from clipboard | Ctrl/Cmd+V |
Add tile | Ctrl/Cmd+Shift+Enter |
Code tiles | |
Add code | Shift+C |
Execute code | Ctrl/Cmd+Enter |
Data tiles | |
Add query | Shift+D |
Run query | Ctrl/Cmd+Enter |
Markdown tiles | |
Add markdown | Shift+M |
Service-Level Objective tiles | |
Add Service-Level Objective | Shift+S |
Variables | |
Add variable | Shift+V |
Image tiles | |
Add image | Shift+I |
List dashboards
To list dashboards
-
Go to
Dashboards. -
In the Dashboards panel, the Last opened by you section lists recently accessed dashboards.
-
Hover over a dashboard name and select for a menu of available commands for that dashboard. In this example, we would display the menu for a dashboard called
my dashboard 3.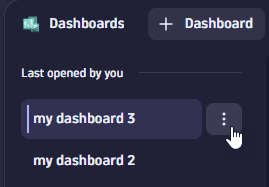 Dashboards: Last opened by you: dashboard-specific menu
The commands you see in the menu depend on your permissions for that dashboard. For example, you can't rename someone else's dashboard unless they have given you edit permissions for that dashboard. (But you can make a copy of a shared dashboard and then edit your copy.)
- Rename enables editing for the dashboard name
- Duplicate makes a copy of the dashboard
- Download writes the dashboard to a JSON file that you can import
- Change owner assigns dashboard ownership to a new owner
- Move to trash moves the dashboard to the trash can
This icon after a dashboard name means someone shared that dashboard with you.
-
To display a table of all dashboards to which you have access—your own dashboards and all dashboards that people have shared with you—select All dashboards.
-
To sort the table, select the Name, Created, Modified, or Opened by you header.
-
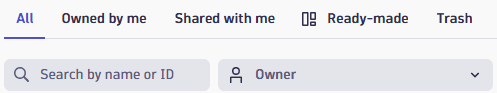
To filter the table, you have several options:
 Listing your documents: filter options
- All: list all dashboards.
- Owned by me: list only dashboards you own.
- Shared with me: list only dashboards someone else owns but which are shared with you.
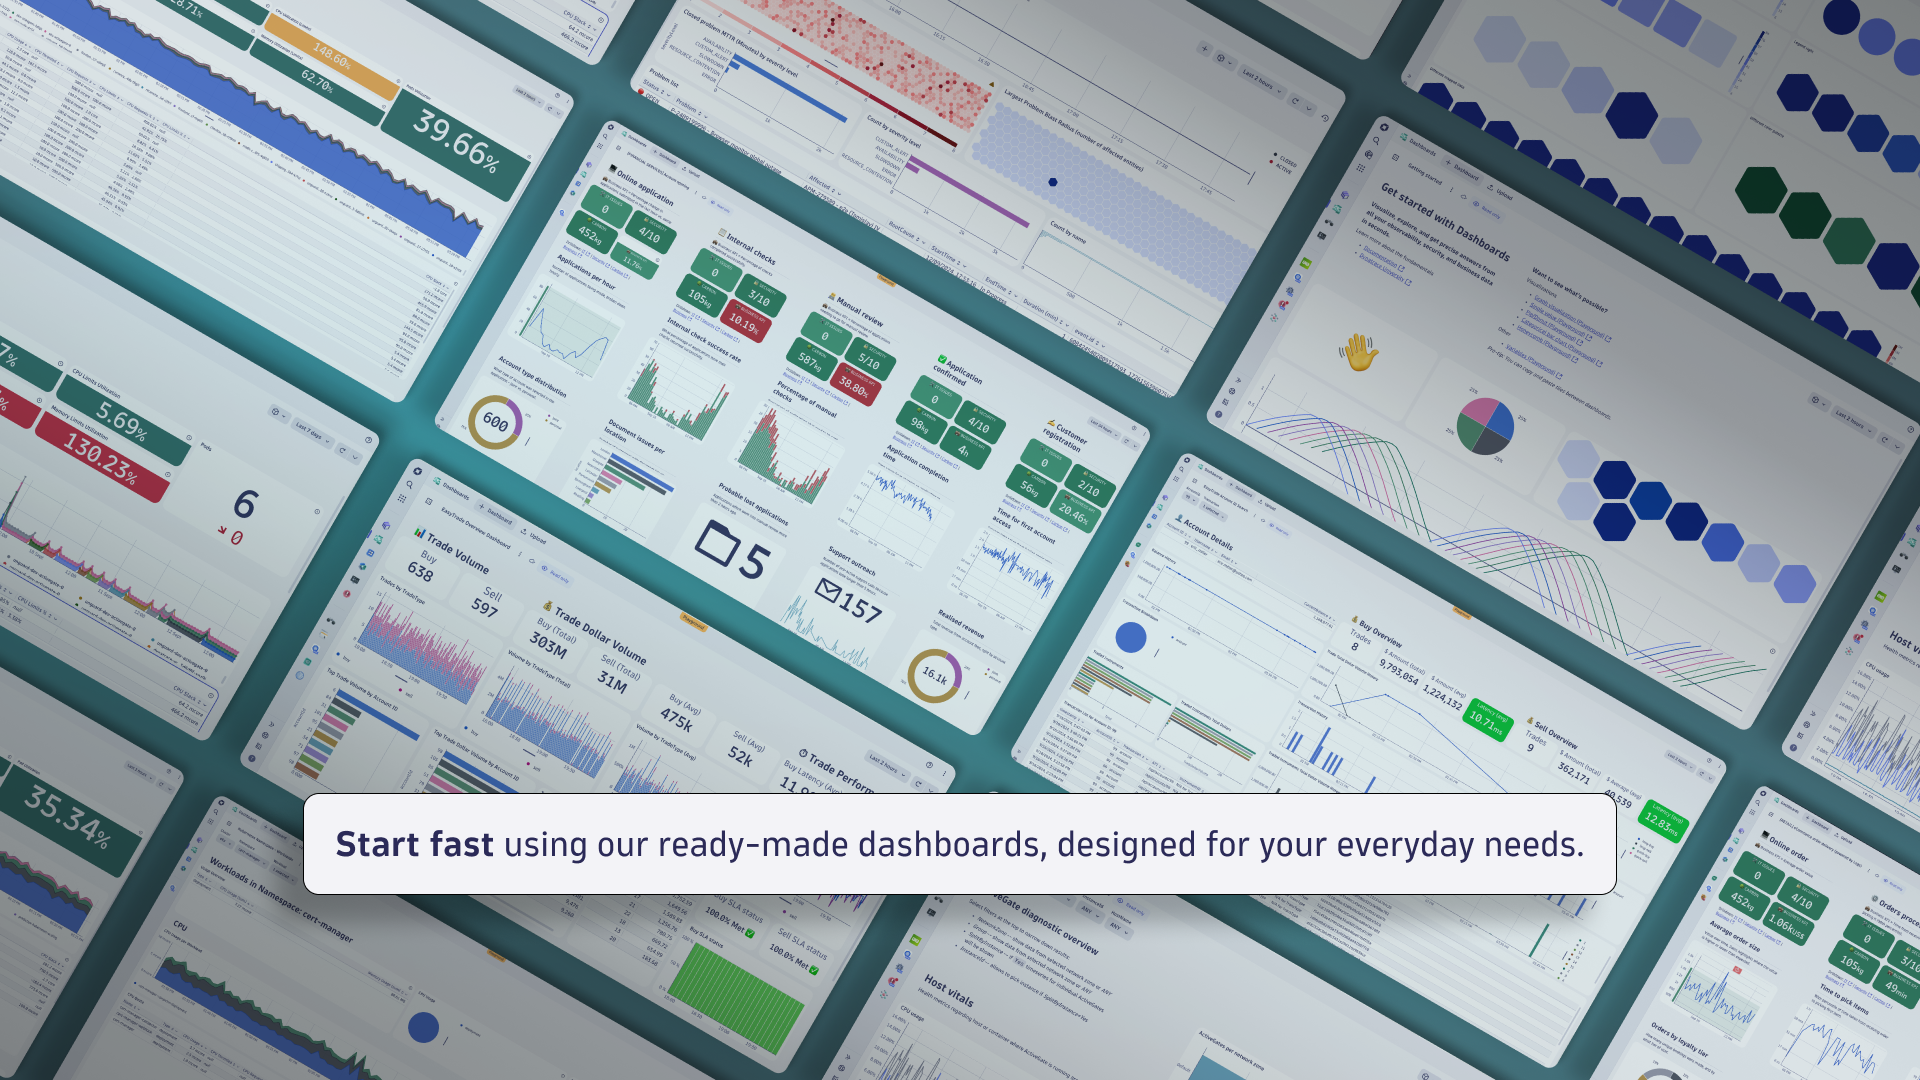
- Ready-made: list only ready-made dashboards. You can further filter the Ready-made tab by dashboard source:
- All ready-made
- Dynatrace
- Extensions
- Trash: list dashboards in the trash can.
- : filter the table by dashboard name or ID.
- Owner: filter the table by owner (available on All and Shared with me tabs).
-
Display a dashboard
To display a dashboard
-
Go to
Dashboards. -
Select the name of the dashboard. In this example, we open
my dashboard 2.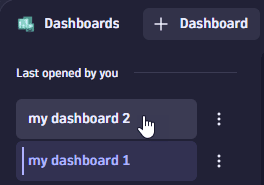 Open a dashboard
Interact with a tile
If you see something on a dashboard that you want to zoom in on, you can maximize it and have a closer look, and then minimize it again when you're done.
When you maximize a tile, it is temporarily zoomed to the maximum size of the display so you can see the details of the selected tile.
To maximize a tile
- Hover over the tile to display the tile-specific commands.
- Select Maximize.
To return to the normal dashboard view, select Minimize in the upper-right corner.
Refresh a dashboard
When you open a dashboard for the first time, the refresh rate is set to Off (no automatic refresh).
Manual refresh
To refresh the current dashboard manually, in the upper-right corner of the dashboard, select (in the pair).
Automatic refresh
To refresh the current dashboard automatically, in the upper-right corner of the dashboard, select (in the pair) and select a refresh rate.
Offturns off automatic refresh- Other settings will refresh the dashboard at the specified interval
If you change the refresh rate, that rate is remembered the next time you open the dashboard.
A frequent refresh rate can keep you literally up to the minute, but a complex dashboard may take some time to recalculate each time it is refreshed. Choose a refresh rate that suits your needs and the complexity of the dashboard.
Edit read-only dashboards
When you open a document (dashboard or notebook) for which you don't have write permission, you can still edit the document during your session. After you're finished, you have two options:
- Save your changes to a new document
- Discard your changes
Example:
-
Go to
Dashboards, list the ready-made dashboards, and select the Getting started dashboard.It says Ready-made in the upper-left corner, next to the document name.
-
Select the Pie chart tile and then select Edit.
-
Change the visualization from Pie to Donut.
Now you are offered two buttons: Save as new and Discard changes.
-
Use the updated dashboard as needed. You have full edit access for this session.
-
When you're finished, select what to do with your changes:
- Save as new—saves your changes in a new copy of the edited dashboard.
- Discard changes—discards your changes and returns you to the unedited read-only dashboard.
Select the timeframe
To review or change settings that apply to an entire dashboard
-
Display the dashboard.
-
In the upper-right corner of the dashboard, select Settings.
The Settings panel is displayed.
-
Review or change settings as needed.
Custom timeframe
To set a default timeframe for a dashboard
-
Display the dashboard.
-
In the upper-right corner of the dashboard, select Settings.
-
Turn on Custom timeframe.
-
Select the default timeframe for the selected dashboard.
Changing this setting does not immediately update the timeframe of the current dashboard. The change is applied only to a new session with the dashboard (either for a different user, or for the same user returning to the dashboard for another session).
For details about the dashboard timeframes, see Select the timeframe.
Default segment
To review or change the dashboard default segment
-
Display the dashboard.
-
In the upper-right corner of the dashboard, select Settings.
-
Turn on Default segment.
-
Select the default segment for the selected dashboard.
Changing this setting does not immediately update the segment of the current dashboard. The change is applied only to a new session with the dashboard (either for a different user, or for the same user returning to the dashboard for another session).
For details about dashboard segments, see Select segments.
{$} Variables
To review or change dashboard variables
-
Display the dashboard.
-
In the upper-right corner of the dashboard, select Settings.
The Settings panel is displayed.
-
Select Variables.
For details about dashboard variables, see Add a variable to a dashboard.
Annotations
What is an annotation?
Annotations allow you to indicate significant events such as deployments, incidents, or configuration changes on a timeseries chart. This helps you correlate metric behavior with what happened in your environment when troubleshooting or reviewing trends.
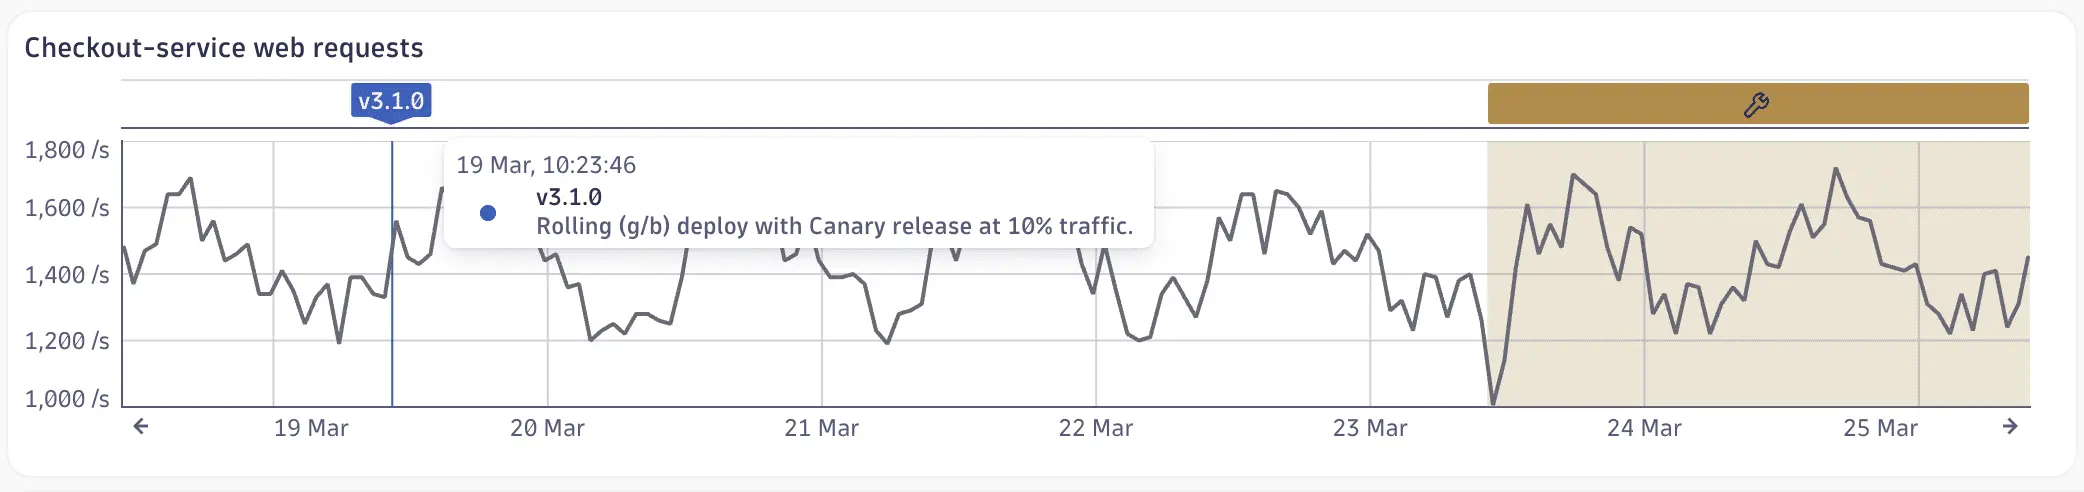 Example point-in-time and range annotation
Annotations are data-driven, so they stay current as your data changes. You can create an annotation in two ways:
- DQL query that returns timestamps and associated metadata.
- Code snippet that returns annotation records.
When you apply an annotation to a chart, the result of the DQL or code are mapped to the chart so you can see what happened and when it happened.
To add an annotation to a dashboard
- Select (Settings) in the upper-right corner of the dashboard.
- Select Annotations.
- Select Create annotation.
- In the Data section, select the annotation type you want to create:
- DQL: enter DQL.
- Code: enter code.
- Select Run.
- In the Data mapping section, map fields:
- Name
- Description
- Time start (and Time end if needed)
- In the Display settings section, configure display settings/references.
For details, see Add annotations to a dashboard.
-
The timeframe describes the when of the data on the dashboard.
-
When you open a dashboard for the first time, the standard global timeframe (Last 2 hours) is applied.
-
If you change the global timeframe setting for your dashboard, that timeframe is applied the next time you open the dashboard. However, there are exceptions as described below.
-
You can set a dashboard-specific default timeframe that is applied each subsequent time you open the dashboard.
-
You can set a tile-specific timeframe. This setting overrides the global timeframe.
-
When you open a dashboard via a link, if a timeframe is included in the link, the link timeframe is applied and the default dashboard timeframe is ignored.
Change global timeframe
To change the global timeframe
- In the upper-right corner of the dashboard, open the timeframe selector menu (the default is Last 2 hours ).
- Select a new timeframe.
- To select a standard timeframe, choose one of the standard Relative timeframes
- To define a custom timeframe, define the timeframe in the Custom timeframe panel and select Apply.
- Use the calendar buttons
 to select calendar dates
 - Edit the resulting From and To settings to fine-tune the range
- Use the calendar buttons
When you change the global timeframe:
- The new timeframe is displayed in the upper-right corner of the dashboard.
- The dashboard contents are recalculated and displayed according to the new timeframe. This overrides the default dashboard timeframe.
- This does not affect any tile-specific timeframe overrides. Tile-specific timeframes take precedence over any global timeframe settings.
Default dashboard timeframe
To set a default timeframe for a dashboard
-
Display the dashboard.
-
In the upper-right corner of the dashboard, select Settings.
-
Turn on Custom timeframe.
-
Select the default timeframe for the selected dashboard.
Changing this setting does not immediately update the timeframe of the current dashboard. The change is applied only to a new session with the dashboard (either for a different user, or for the same user returning to the dashboard for another session).
Tile-specific timeframe override
To specify a custom timeframe in a dashboard tile
-
Edit the tile.
-
In the edit panel, turn on Custom timeframe.
-
Select the timeframe to apply to the selected tile.
This timeframe overrides the dashboard timeframe set in the upper-right corner of the dashboard. Using this method, a dashboard can have multiple tiles, where each tile has its own timeframe.
You can also specify a custom timeframe in a data tile's DQL query. If you use this method (with a timeframe specified in the query), the above UI setting is disabled and the timeframe specified in the query is used.
Example timeframe specification in DQL:
fetch [recordtype], from:now() - 2h| ....
For details on specifying a timeframe in DQL, see Specify timeframe in the DQL documentation.
Select segments
To filter data, you can specify segments at two levels: dashboard and tile. Tile-level segment selections override dashboard-level segment selections.
Should I use segments or variables?
Segments
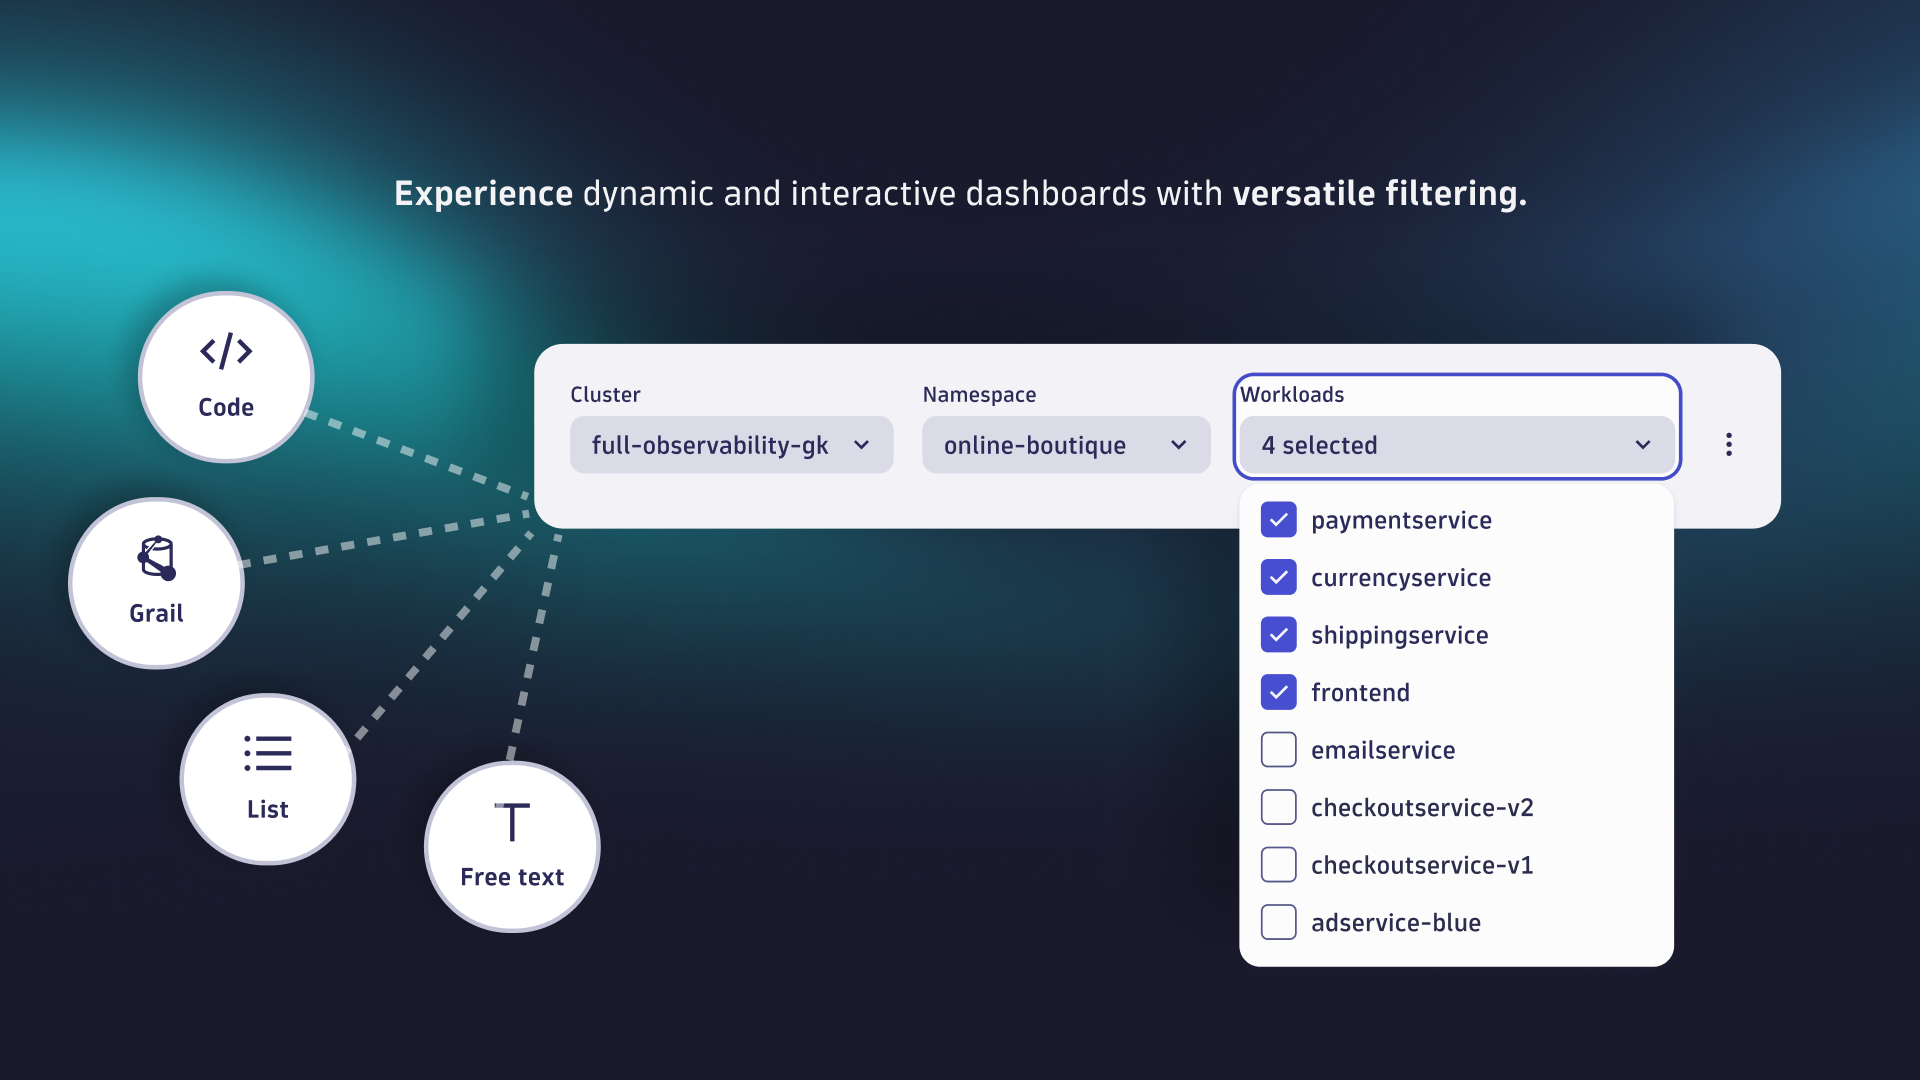
Use segments when you want to reuse them across dashboards. For example, use segments for recurring filters such as for your Kubernetes clusters, namespaces, workloads, or pods. Segments automatically apply on top of the queries of your tiles/sections, so you don’t need to reference them within.
Variables
If you need more control over how a filter is applied, however, you might want to use variables.
- Variables allow you to fully control the underlying query or within your Explore section or tile, determining where and how they are applied. For example, you can specify how they connect with other filters applied (AND, OR) and you can control which operator is used for your filter (such as
equals,contains,startsWith, andendsWith). - Additionally, use variables when you need fine-grained control over how filters are interdependent.
- For details on segments, see Segments
- For a Dashboards-specific segments use case, see Analyze monitoring data with segments
Dashboard-level segments
To select dashboard-level segments
-
Display the dashboard.
-
Open the segment selector at the top of the dashboard and, in Filter by segments, select a segment.
If the segment requires an additional value selection, select it now. -
To add another segment, select Segment. Repeat this step for each segment you want to add.
-
Select Apply to apply the selection and filter data on the dashboard.
- The segment selector now displays the name of the selected segment or, if you select more than one segment, the number of selected segments.
- To change your segment selection, select again, make your changes, and select Apply.
- To manage segments in general (list, create, view, edit, delete), select and then select the Manage segments link.
Tile-level segments
To select tile-level segments
-
Display the dashboard.
-
Select the tile and then select in the tile controls to edit the tile.
-
In the edit panel, turn on Custom segments.
-
In the Custom segments list, select a segment.
If the segment requires an additional value selection, select it now. -
To add another segment, select Segment. Repeat this step for each segment you want to add for the selected tile.
-
Select Apply to apply the selection and filter data on the tile.
- The segment selector now displays the name of the selected segment or, if you select more than one segment, the number of selected segments.
- To change your segment selection, select again, make your changes, and select Apply.
- To manage segments in general (list, create, view, edit, delete), select and then select the Manage segments link.
Add annotations
Annotations allow you to indicate significant events such as deployments, incidents, or configuration changes on a timeseries chart. This helps you correlate metric behavior with what happened in your environment when troubleshooting or reviewing trends.
Annotations are data-driven, so they stay current as your data changes. You can create an annotation in two ways:
- DQL query that returns timestamps and associated metadata.
- Code snippet that returns annotation records.
When you apply an annotation to a chart, the result of the DQL or code are mapped to the chart so you can see what happened and when it happened.
To add an annotation to a dashboard
- Select (Settings) in the upper-right corner of the dashboard.
- Select Annotations.
- Select Create annotation.
- In the Data section, select the annotation type you want to create:
- DQL: enter DQL.
- Code: enter code.
- Select Run.
- In the Data mapping section, map fields:
- Name
- Description
- Time start (and Time end if needed)
- In the Display settings section, configure display settings/references.
For details, see Add annotations to a dashboard.
Dashboard settings
To review or change settings that apply to an entire dashboard
-
Display the dashboard.
-
In the upper-right corner of the dashboard, select Settings.
The Settings panel is displayed.
-
Review or change settings as needed.
Custom timeframe
To set a default timeframe for a dashboard
-
Display the dashboard.
-
In the upper-right corner of the dashboard, select Settings.
-
Turn on Custom timeframe.
-
Select the default timeframe for the selected dashboard.
Changing this setting does not immediately update the timeframe of the current dashboard. The change is applied only to a new session with the dashboard (either for a different user, or for the same user returning to the dashboard for another session).
For details about the dashboard timeframes, see Select the timeframe.
Default segment
To review or change the dashboard default segment
-
Display the dashboard.
-
In the upper-right corner of the dashboard, select Settings.
-
Turn on Default segment.
-
Select the default segment for the selected dashboard.
Changing this setting does not immediately update the segment of the current dashboard. The change is applied only to a new session with the dashboard (either for a different user, or for the same user returning to the dashboard for another session).
For details about dashboard segments, see Select segments.
{$} Variables
To review or change dashboard variables
-
Display the dashboard.
-
In the upper-right corner of the dashboard, select Settings.
The Settings panel is displayed.
-
Select Variables.
For details about dashboard variables, see Add a variable to a dashboard.
Annotations
What is an annotation?
Annotations allow you to indicate significant events such as deployments, incidents, or configuration changes on a timeseries chart. This helps you correlate metric behavior with what happened in your environment when troubleshooting or reviewing trends.
Example point-in-time and range annotationAnnotations are data-driven, so they stay current as your data changes. You can create an annotation in two ways:
- DQL query that returns timestamps and associated metadata.
- Code snippet that returns annotation records.
When you apply an annotation to a chart, the result of the DQL or code are mapped to the chart so you can see what happened and when it happened.
To add an annotation to a dashboard
- Select (Settings) in the upper-right corner of the dashboard.
- Select Annotations.
- Select Create annotation.
- In the Data section, select the annotation type you want to create:
- DQL: enter DQL.
- Code: enter code.
- Select Run.
- In the Data mapping section, map fields:
- Name
- Description
- Time start (and Time end if needed)
- In the Display settings section, configure display settings/references.
For details, see Add annotations to a dashboard.
-
Run a code tile
When you open a document from another user, you may see the following message:
This dashboard contains custom code. It is read-only until you review the code and select “Accept and run”.
When you run a code tile or section written by another person, Dynatrace executes the other person's JavaScript using your user account and your permissions. This is a powerful feature, but it needs to be used correctly and responsibly. The JavaScript code can access external APIs on your behalf (using your account and permissions).
To review code
-
Select Review all code.
The Review code page displays each code tile's code in a separate box.
-
Review the code and decide whether you want to run it.
If you want to run the code, you can approve it just this time or permanently.
- To run the code just this time, select Accept and run. The next time you open this document, you will be asked once again to review the code before running it.
- To permanently accept the code in this document, select Always trust code in this document and then select Accept and run.
Download result
To download (export) the result of the current dashboard tile or notebook section to a local file
-
Select the tile or section.
-
On the command bar, open the menu and select Download result > [format].
The format options available depend on the visualization.
- CSV: The result is downloaded to a local comma-separated values (*.csv) file. This option includes table formatting such as visible columns and unit formatting.
- CSV (raw): The result is downloaded to a local comma-separated values (*.csv) file. This option includes the complete unformatted data.
- JSON: The result is downloaded to a local JSON (*.json) file.
Some visualizations offer no option to download the result.
Possible issue with importing CSV into Excel
When you export results to a CSV file—whether CSV or CSV (raw)—with line breaks in any result column/field, and then open the file with Microsoft Excel or try to convert the file into a table using Excel option Data > Text to Columns, you may encounter an issue in which the line breaks are incorrectly rendered in Excel. This is caused by an Excel limitation.
To avoid this issue, use Excel option Data > From Text/CSV.
Manage dashboards
Add dashboard to Dock
To add a dashboard to the Dock for easy access
-
Display the dashboard.
-
Open the menu next to the dashboard name (in the upper-left corner of the dashboard).
-
Select Add to dock.
If you change the name of the dashboard, it's automatically updated on the Dock.
To remove a dashboard from the Dock
- Hover over the dashboard name in the Dock.
- Select Unpin from dock.
Rename a dashboard
To rename a dashboard from the Dashboards panel
-
Go to
Dashboards.The Last opened by you section lists your most recently accessed dashboards.
-
Hover over the name of the dashboard you want to rename and select > Rename. If the rename option isn't available, you don't have edit rights to that dashboard.
Duplicate a dashboard
To duplicate a dashboard from the Dashboards panel
-
Go to
Dashboards.The Last opened by you section lists your most recently accessed dashboards.
-
Hover over the name of the dashboard you want to duplicate and select > Make a copy.
To make a copy of the current dashboard
-
At the top of the dashboard, open the dashboard menu next to the dashboard name.
-
Select Duplicate from the menu.
A copy is created with the name Copy of + the name of the current dashboard. The copy is now listed in the Dashboards panel.
Share a dashboard
If you own a dashboard or notebook, you can share it.
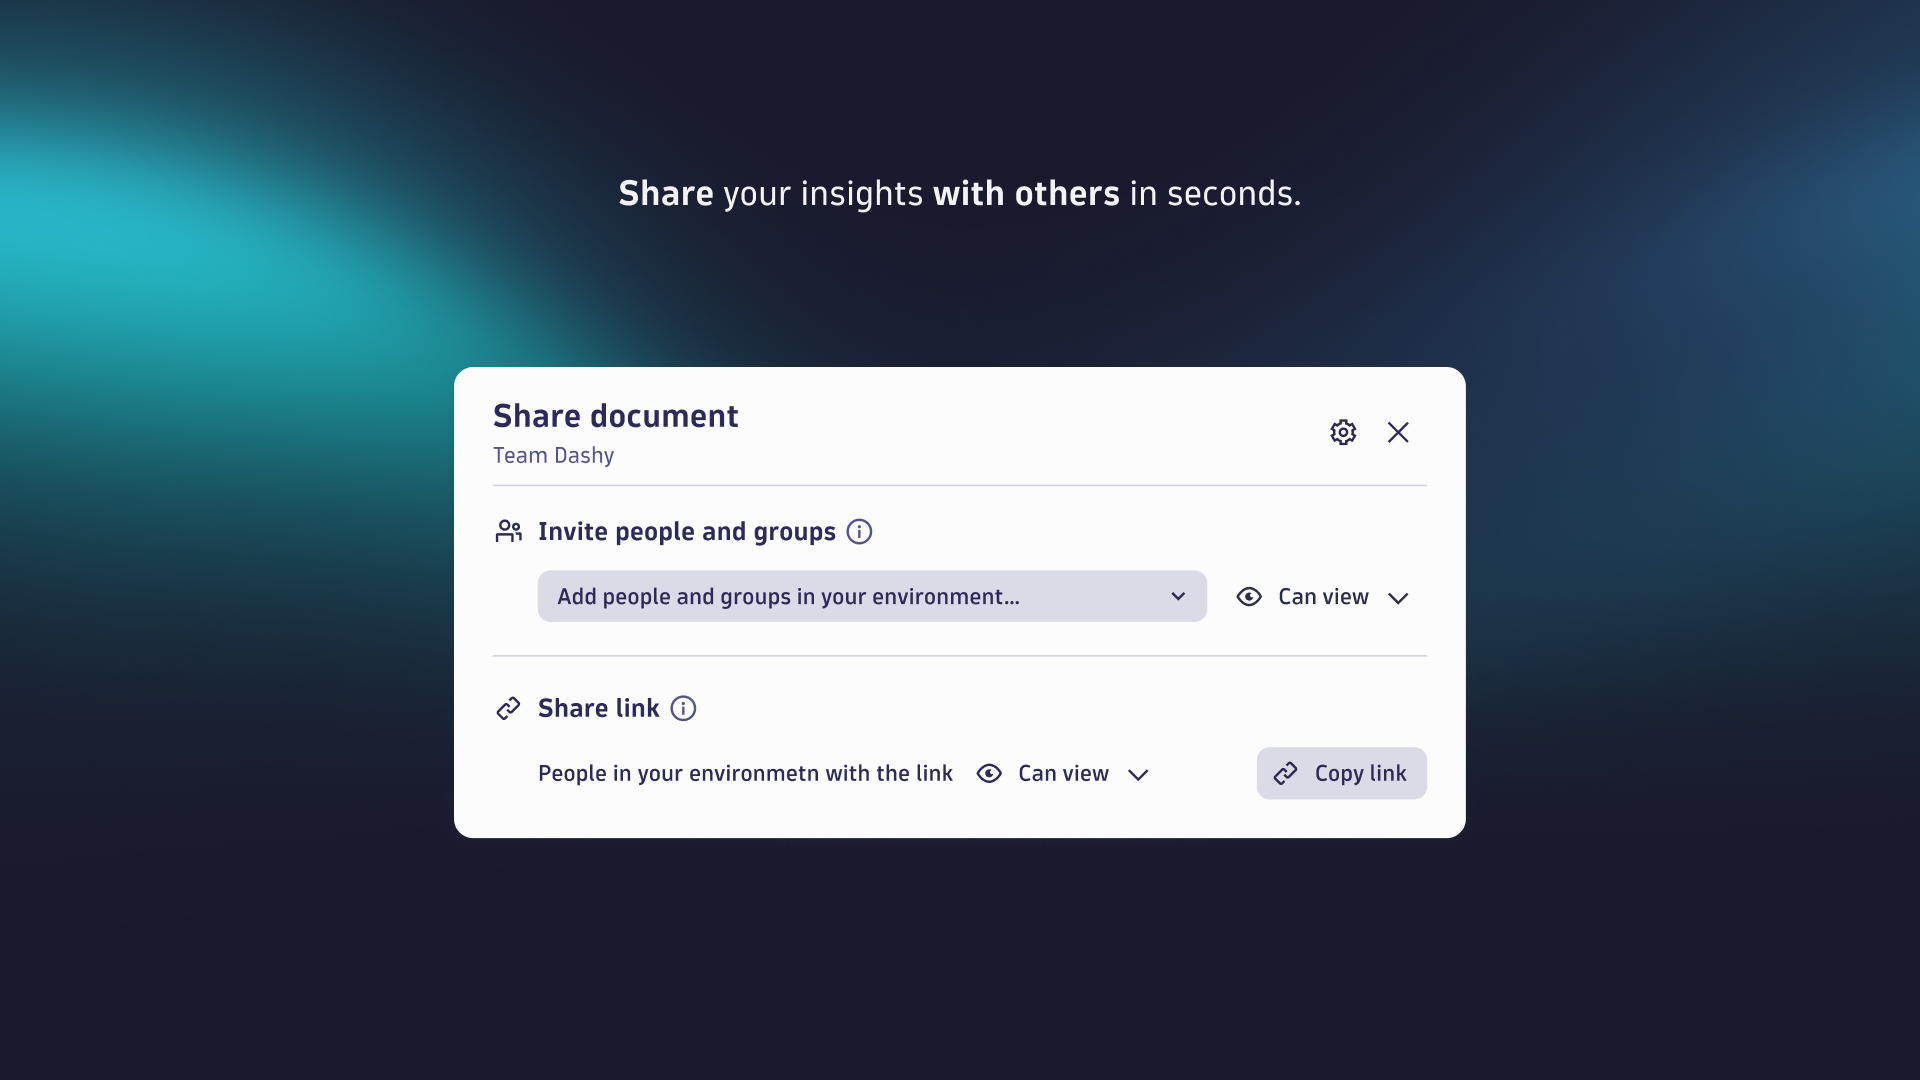
There are three ways to share a document with other Dynatrace users in your company:
- Access for all (view-only): Give view-only access to everyone in your Dynatrace environment.
- Share access: Create and maintain a list of users and user groups with access the document.
- Share links: Create links (URLs) pointing to your document and distribute the links through the channels of your choice (email, for example).
These methods are not mutually exclusive. For example, you can maintain a focused list of users for ongoing access to the document (maybe everyone in a certain group edits the document regularly) and you can create and distribute view-only links for a wider audience as needed.
In any case, you control whether people can edit the document or only view it.
For details on sharing documents, see Share documents.
Manage dashboard versions
Dashboard versions are saved automatically.
- You can access the 50 most recent versions of your dashboard.
- Each dashboard version is available for up to 30 days.
To view and manage dashboard versions
-
Display your dashboard.
-
In the upper-right corner of your dashboard, select
 .
.This displays a menu of the most recent versions of the current dashboard.
- Date
- Time
- Name of the person who created that version
-
From any version entry in the Versions menu, you can select version-specific actions.
 Preview displays a preview of the selected version.
- Restore switches your dashboard to the selected version.
- Make a copy creates a new dashboard from the selected version and displays the new dashboard. The original dashboard remains unchanged.
- Download saves a JSON file of the selected version of the dashboard to your local machine.
- Preview in new tab displays a preview of the selected version on a new browser tab.
- Delete this version deletes the selected version.
-
To list and manage all versions of the dashboard in a separate window, go to the bottom of the Versions menu and select Show all.
For details, see Manage document versions.
Change dashboard owner
When you create a document (dashboard or notebook), you are the owner. To give ownership of the document to another Dynatrace user
-
Open the document menu and select Change owner.
-
Find and select a new owner, and then select Change owner.
When you change the document owner, you immediately lose access to the document.
- Be sure you are ready to transfer ownership before you select this command.
- You can regain access to the document only if the new owner gives you permission.
-
After the transfer is complete, the new owner will receive email about the document ownership transfer.
Download a dashboard
To download (export) the currently displayed dashboard as JSON
-
At the top of the dashboard, open the menu to the right of the dashboard name.
-
Select Download from the menu.
The definition of the current dashboard is downloaded to a local JSON file.
To download (export) a dashboard from the Dashboards side panel
-
Go to
Dashboards. -
In Last opened by you, hover over the name of the dashboard you want to export and select Download from the menu. The dashboard is downloaded to a local JSON file that you can upload.
If your dashboard isn't listed in Last opened by you, select All dashboards to display a table of all dashboards that you can access (your dashboards or dashboards shared with you). From there, you can find the dashboard and select Download from the menu.
Upload a dashboard
To upload (import) the JSON definition of a dashboard from the Dashboards side panel
- Go to Dashboards.
- In the Dashboards panel on the left, select Upload.
- Find and open the dashboard JSON definition file.
To upload (import) the JSON definition of a dashboard from the Dashboards table
-
Go to
Dashboards. -
In the Dashboards panel on the left, select All dashboards.
A Dashboards table displays all dashboards by Name and Last modified date.
-
In the upper-left corner of the page, select Upload.
-
Find and open the dashboard JSON definition file.
An uploaded dashboard is:
-
Opened in Dynatrace.
If you see a message about running custom code when you upload a dashboard, see Run code warnings for more information.
-
Added to your Last opened by you list.
-
Added to the Dashboards page with Last modified set to the upload date and time.
Delete a dashboard
To delete any dashboard on the Dashboards page
-
Go to
Dashboards. -
In the Dashboards panel on the left, select All dashboards.
A table displays all dashboards by Name and Last modified date.
-
On the Dashboards page, select Move to trash for the dashboard you want to delete.
Dashboards via API: best practices
When creating or managing dashboards via API, these best practices can make your life easier.
- To get a solid start, create the dashboard in the Dashboards app and then download the dashboard configuration file.
- To verify changes made via API, upload the file to Dashboards. Does everything still look as expected?
- Be careful with layout changes, as empty vertical spaces cause tiles to shift upwards automatically on document load and cause the Discard changes button to appear.
- To examine changes in detail, select Save as new to download the document and compare it with the original version.
- Don't set the
versionproperty of the config to an arbitrary value. It's an internal property needed for migration purposes.
Create and edit dashboards
Create a dashboard
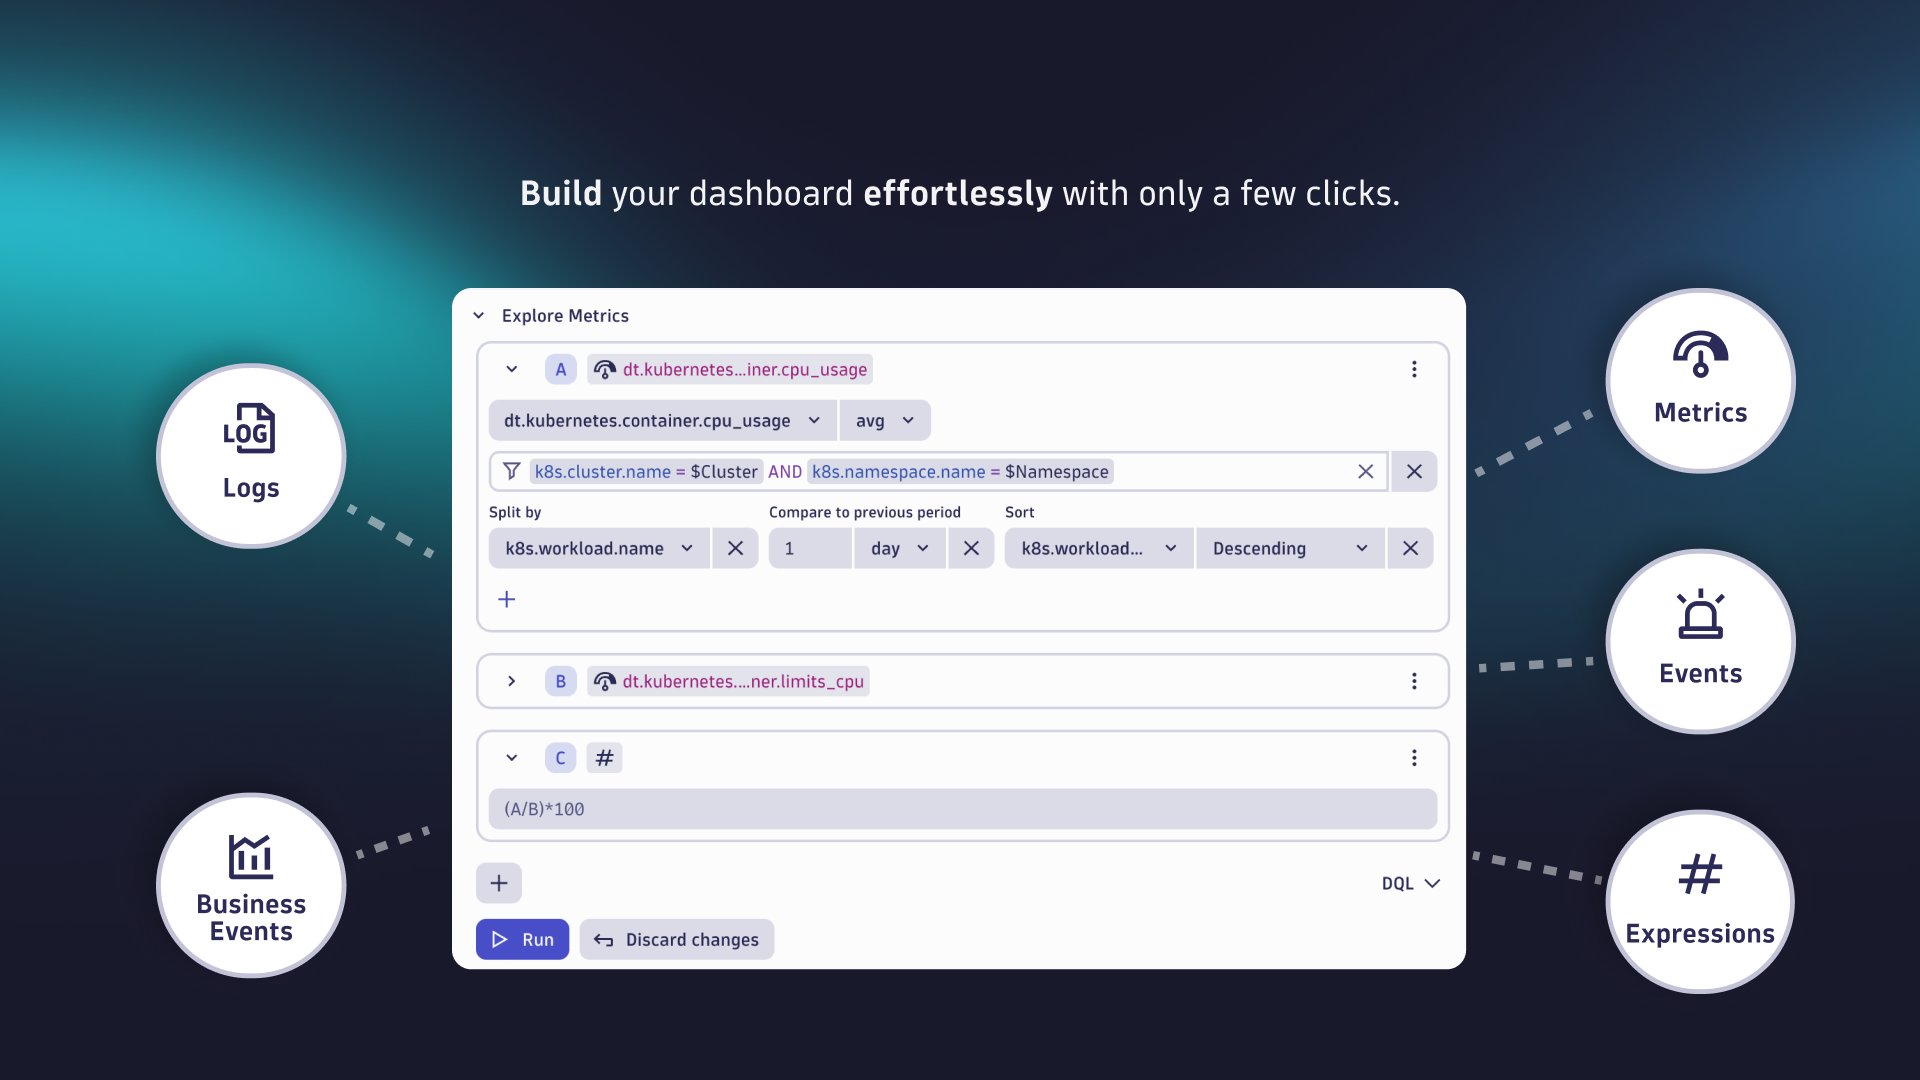
The fastest and easiest way to explore your data is with our new Explore tiles and sections. In a few seconds, you can find and analyze your logs, metrics, or business events. No DQL required!
To create a new dashboard
- Go to Dashboards.
- Select Dashboard.
After you create an empty dashboard, you need to add tiles to it.
Query Grail
To Query Grail
-
In the upper-right of the dashboard, open the (Add) menu and select DQL.
Keyboard shortcut: Shift+D
A configuration side panel opens on the right to display two tabs:
- Data
- Visual
-
On the Data tab, use the Dynatrace Query Language (DQL) to define your query.
-
Select Run to run the query.
-
On the Visual tab, choose a visualization format for your results.
- means the visualization type is unavailable for your query.
-
Under the Visualization selector, expand the options sections to adjust visualization settings as needed.
-
Close the side panel when you're done.
If you want to return to these settings, select your tile to display them.
For details, see Add data to a dashboard.
Add code
To add code to a dashboard
-
In the upper-right of the dashboard, open the (Add) menu and select Code.
Keyboard shortcut: Shift+C
An empty tile is added to the dashboard and an Options side panel opens on the right.
-
Optional In Tile title, enter a title to display at the top of your tile.
-
In the numbered Code box, enter custom JavaScript to fetch external data from any available API. Use the Fetch API to fetch data from external APIs.
To make sure your requests aren't blocked, ask your administrator to allow your external data sources by adding them to the External requests.
External requests enable outbound network connections from your Dynatrace environment to external services. They allow you to control access to public endpoints from the AppEngine with app functions and functions in Dashboards, Notebooks, and Automations.
-
Go to
 Settings > General > External requests.
 -
Select New host pattern.
-
Add the domain names.
-
Select Add.
This way you can granularly control the web services your functions can connect to.
Don't include the address prefix. For example, if the address is
https://www.example.com, add onlywww.example.com. -
For details, see Add code to a dashboard.
Add markdown
To add a markdown tile to a dashboard
-
In the upper-right of the dashboard, open the (Add) menu and select Add markdown.
Keyboard shortcut: Shift+M
An Options side panel opens on the right.
-
In the Options side panel, enter your text.
- Use Markdown to format your text and add links and images.
- The tile is updated as you edit.
- While you're editing text, press Ctrl+Space to see options.
-
Close the Options side panel when you're done.
For details, see Add Markdown to dashboard.
Add variable
Use variables to filter your dashboards, to act as variable values in code tiles, and as placeholders in tile titles and Markdown tile text.
To add a variable to a dashboard
-
In the dashboard header, open the (Add) menu and select Variables.
Keyboard shortcut: Shift+V
The Variable panel is displayed.
-
Define the variable.
-
Name: the name of the variable.
- Only alpha-numerical values are allowed
- Don't start a variable name with
dt_
-
Type: can be one of the following:
- DQL: the value is returned from a query you enter when you define the variable.
- Select Run to test your query.
- Code: the value is returned from code you enter when you define the variable.
- List: a comma-separated values (CSV) list of values.
- To define possible values, enter them (separated by commas) in the box under Data.
- To define a default value, select one from the Default value list.
- To allow multiple values to be selected at the same time, turn on Multi-select.
- Free Text: free text. You can enter a Default value. Your changes are saved automatically.
- DQL: the value is returned from a query you enter when you define the variable.
-
-
Set Display settings.
-
If the variable dropdown should be displayed on the dashboard, turn on Display as filter on dashboard.
Turn it off when you want it hidden, such as when the variable is used as a static value across tiles but should not be displayed to the dashboard user. -
If your dashboard's users should be able to select multiple values at the same time within the variable dropdown, turn on Multi-select.
Turn it off when you want to use only single values of the variable dropdown. -
Select a Default value for the variable dropdown. If you don't enter anything in this field, the first available value is selected.
-
-
When you're finished, select < Variable at the top to go to the Variables panel, or select to dismiss the Variables panel.
Variables in dashboards can be defined to depend on other variables.
-
The value of a variable is recalculated if its definition refers to another variable and the other variable's value changes.
For example, if the value of variable A changes, the value of any variable whose definition refers to variable A is recalculated.
-
Loops aren't allowed.
For example, if the value of variable A depends on the value of variable B, the value of variable B can't depend on the value of variable A.
For details, see Add a variable to a dashboard.
Add a predefined tile
To add a predefined tile to your dashboard
-
In the upper-right of the dashboard, open the (Add) menu.
Keyboard shortcut: Ctrl/Cmd+Shift+Enter
-
Scroll down to the Library section and choose a predefined tile.
SearchUse the search box at the top of the menu to search for a tile by name.
-
After you select a predefined tile, the edit panel displays the tile you added.
-
Edit the query or code and the visualization settings as needed.
-
Select Run to see results.
-
Close the side panel when you're done.
For details, see Add a predefined tile from the library.
Add an image
Open the (Add) menu and select Image, or use the keyboard shortcut Shift+I.
For details, see Add an image to a dashboard.
Analyze data with AI
To analyze data using Dynatrace Intelligence Data Analyzers
-
Explore a timeseries.
Example
In your document (dashboard or notebook)
-
Select to add a new section or tile, and then select Metrics to explore metrics.
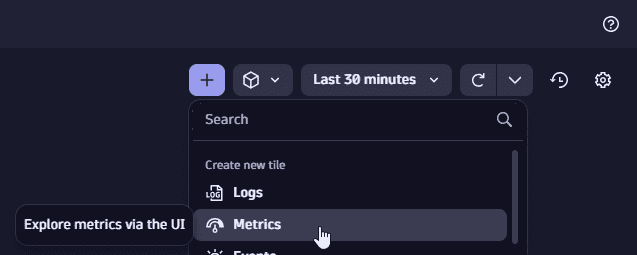 Example: select Add > Metrics
 -
In Select metric, select Infrastructure > CPU > CPU usage %.
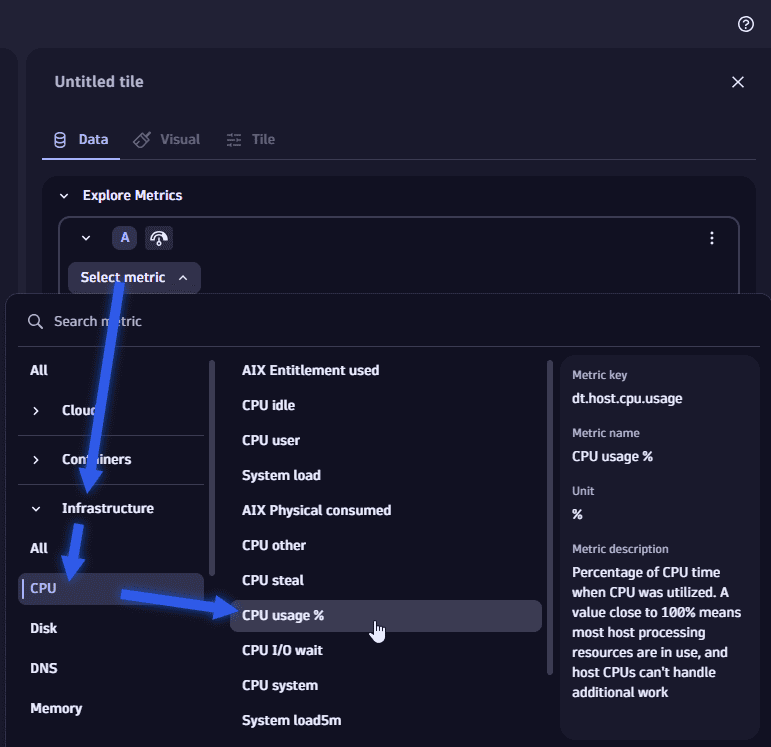 Example: select metric "CPU usage %"
 -
Set Split by to
host.name.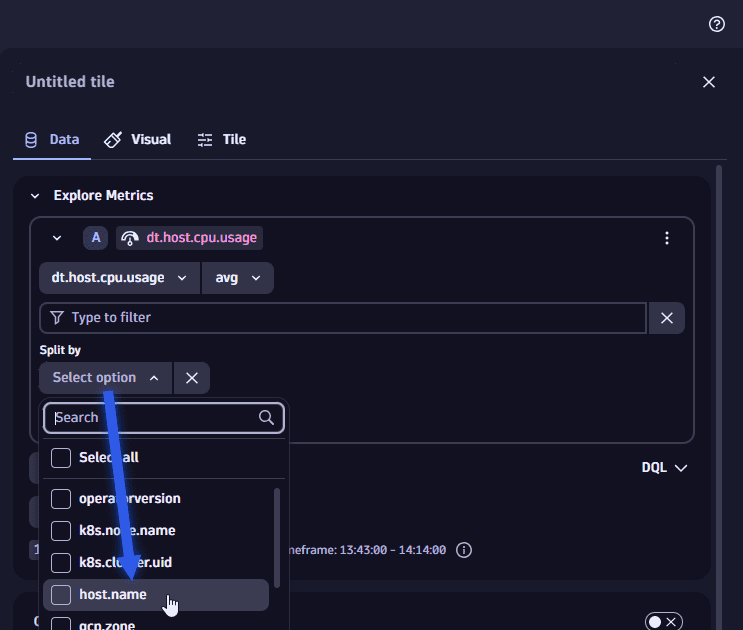 Example: set "Split by" to host.name
 -
Set Limit to the maximum number of series to analyze. Dynatrace Intelligence Data Analyzer currently supports analysis up to 1000 series.
You should get something like this:
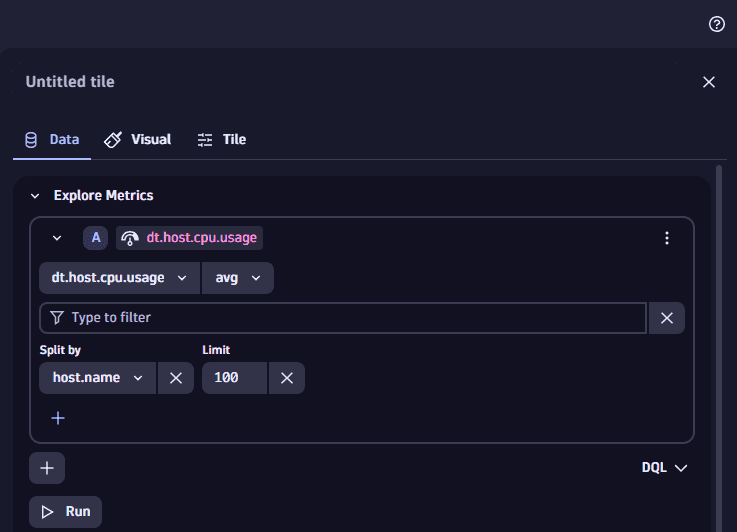 Example: complete query
 -
-
Run the query.
-
In the options panel on the right, scroll down and expand Davis AI.
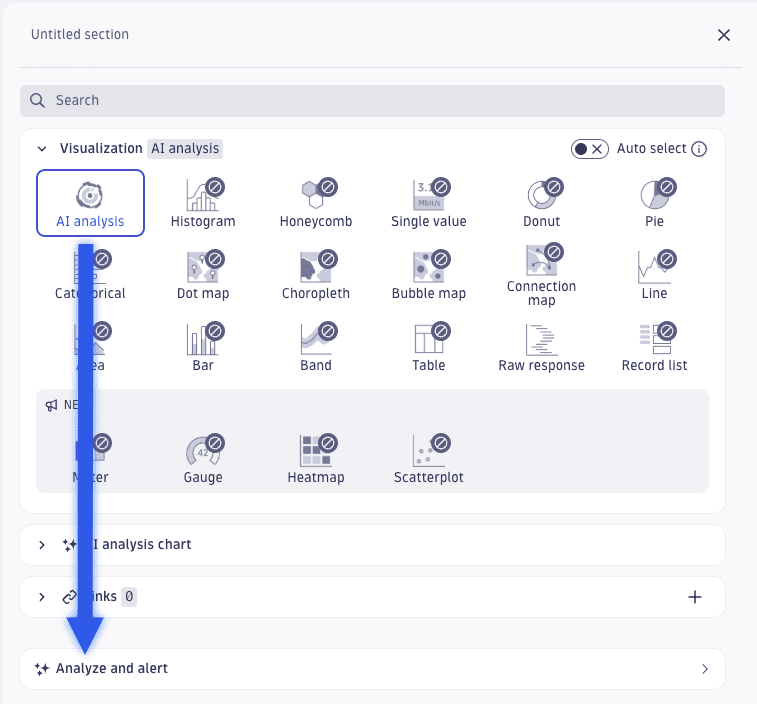
Show me
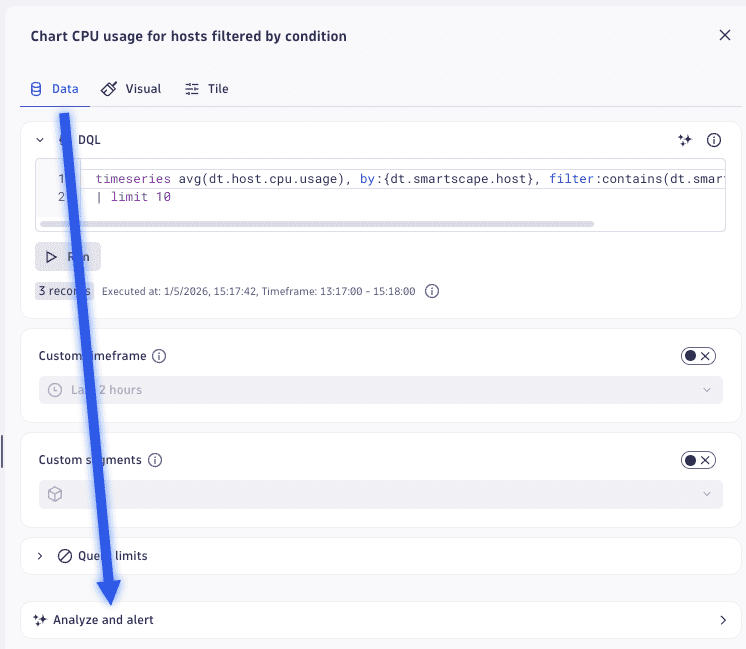 An example of selecting the Analyze and alert settings in the Dashboards app.
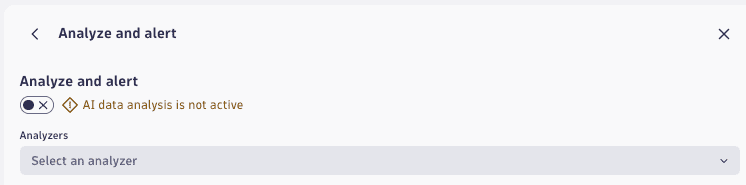 The initial panel for the Analyze and alert settings in the Dashboards app.
 -
On the Davis AI panel, set Analyzers to the analyzer you want to use, and then configure the analyzer.
- For an overview of anomaly detection, see Anomaly detection
- For details on anomaly detection settings, see Anomaly detection configuration
- For details on forecast analyzer settings, Dynatrace Intelligence predictive AI analysis
Anomaly Detection: Auto adaptive threshold anomaly detection
- Number of signal fluctuations—how many times the signal fluctuation is added to the baseline to produce the actual threshold for alerting.
- Alert condition—your selection depends on whether you want to know when the metric is above, below, or outside (above or below) the normal range.
For details, see Anomaly detection configuration.
Anomaly Detection: Seasonal baseline anomaly detection
- Tolerance—the higher the tolerance, the broader the confidence band, leading to fewer triggered events.
- Alert condition—your selection depends on whether you want to know when the metric is above, below, or outside (above or below) the normal range.
For details, see Anomaly detection configuration.
Anomaly Detection: Static threshold anomaly detection
- Threshold—a hard limit that a metric should not violate.
- Unit—the unit of the value.
- Alert condition—your selection depends on whether you want to know when the metric is above or below the threshold value.
- Suggest threshold—Davis AI can help you to find the right threshold based on historical data.
For details, see Anomaly detection configuration.
Prediction: Forecast
- Data points to predict—the total steps the time series is forecasted. More steps generally results in less reliable forecasts and longer analyzer runtimes.
- Forecast offset—an offset for the start of the forecast. For example, if the offset is set to
2, the last two data points are ignored and a forecast for these points is returned as well.
For details, see Dynatrace Intelligence predictive AI analysis.
Advanced settings (for anomaly detection)
You can use the default values or turn on Show advanced properties to fine-tune these settings.
- Alert on missing data—alert if no data is detected within the sliding window.
- Violating samples—number of samples in the sliding window that must violate to trigger an event.
- Sliding window—number of samples that form the sliding window.
- Dealerting samples—number of samples in the sliding window that must go back to normal to close the event.
-
By default, the analyzer is not enabled. To enable it, turn on the switch at the top of the edit panel (switch from AI data analysis is not active to AI data analysis is active).
-
To view the results, select the Davis AI analysis visualization and expand the Davis AI analysis chart section to review or change the visualization-specific settings:
Show me
 Example of selecting "AI analysis" visualization and displaying visualization-specific settings in the Notebooks app.
The Davis AI analysis visualization has two sections: chart and visualization. You can use the Visible sections setting to display either or both of them.
- All—show a chart and a table. The chart reflects your table selections.
- Table—show only a table. You can sort columns that display a sort icon in the header. Select the column header to toggle the sort order up or down .
- Chart—show only a chart. Use the table to select entries you want to show on the chart.
Example: anomalous CPU usage percent
To detect when CPU usage percent exceeds 70 percent, in your document (dashboard or notebook)
-
Select to add a new section or tile, and then select Metrics to explore metrics.
Show me
Example: select Add > Metrics -
In Select metric, select Infrastructure > CPU > CPU usage %.
Show me
Example: select metric "CPU usage %" -
Set Split by to
host.name.Show me
Example: set "Split by" to host.name -
Set Limit to the maximum number of series to analyze. Davis analyzer currently supports analysis up to 1000 series.
Show me
Example: complete query -
Select Run.
-
In the edit panel, expand Davis AI.
Show me
An example of selecting the Analyze and alert settings in the Dashboards app.The initial panel for the Analyze and alert settings in the Dashboards app. -
In the Analyzers list, select Static threshold anomaly detection.
Show me
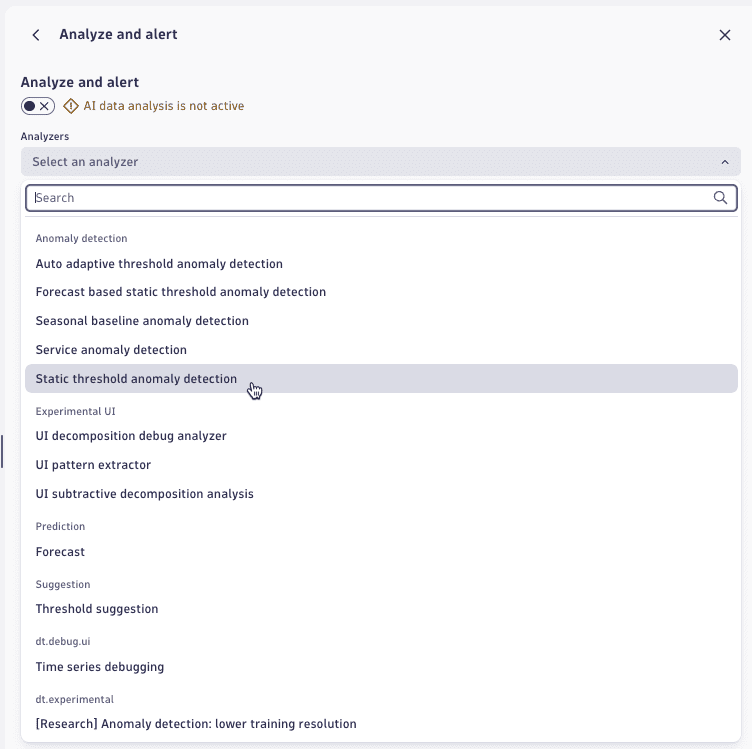 Selecting the "Static threshold anomaly detection" analyzer in the Analyze and alert settings of the Dashboards app.
 -
Set Threshold to
70(enter a value) and Alert condition to Alert if metric is above (default).Show me
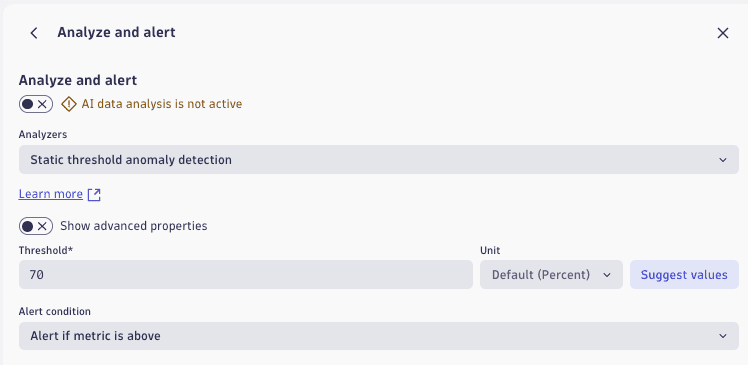 Configuring settings for the "Static threshold anomaly detection" analyzer in the Dashboards app.
 -
Activate the analyzer: at the top of the edit panel, switch from AI data analysis is not active to AI data analysis is active.
-
To view the results, select the Davis AI analysis visualization. Expand the Davis AI analysis chart section to see visualization-specifc settings.
Show me
Example of selecting "AI analysis" visualization and displaying visualization-specific settings in the Notebooks app. -
In the Davis AI analysis chart section, set Visible sections to All.
-
Review the results.
In this example, we selected the hosts that exceeded the threshold.
- The chart shows a line for the selected metric (
CPU usage %) for each selected host. - A red bar across the top of the visualization indicates where the threshold for that metric was exceeded.
- The table under the chart has those hosts selected.
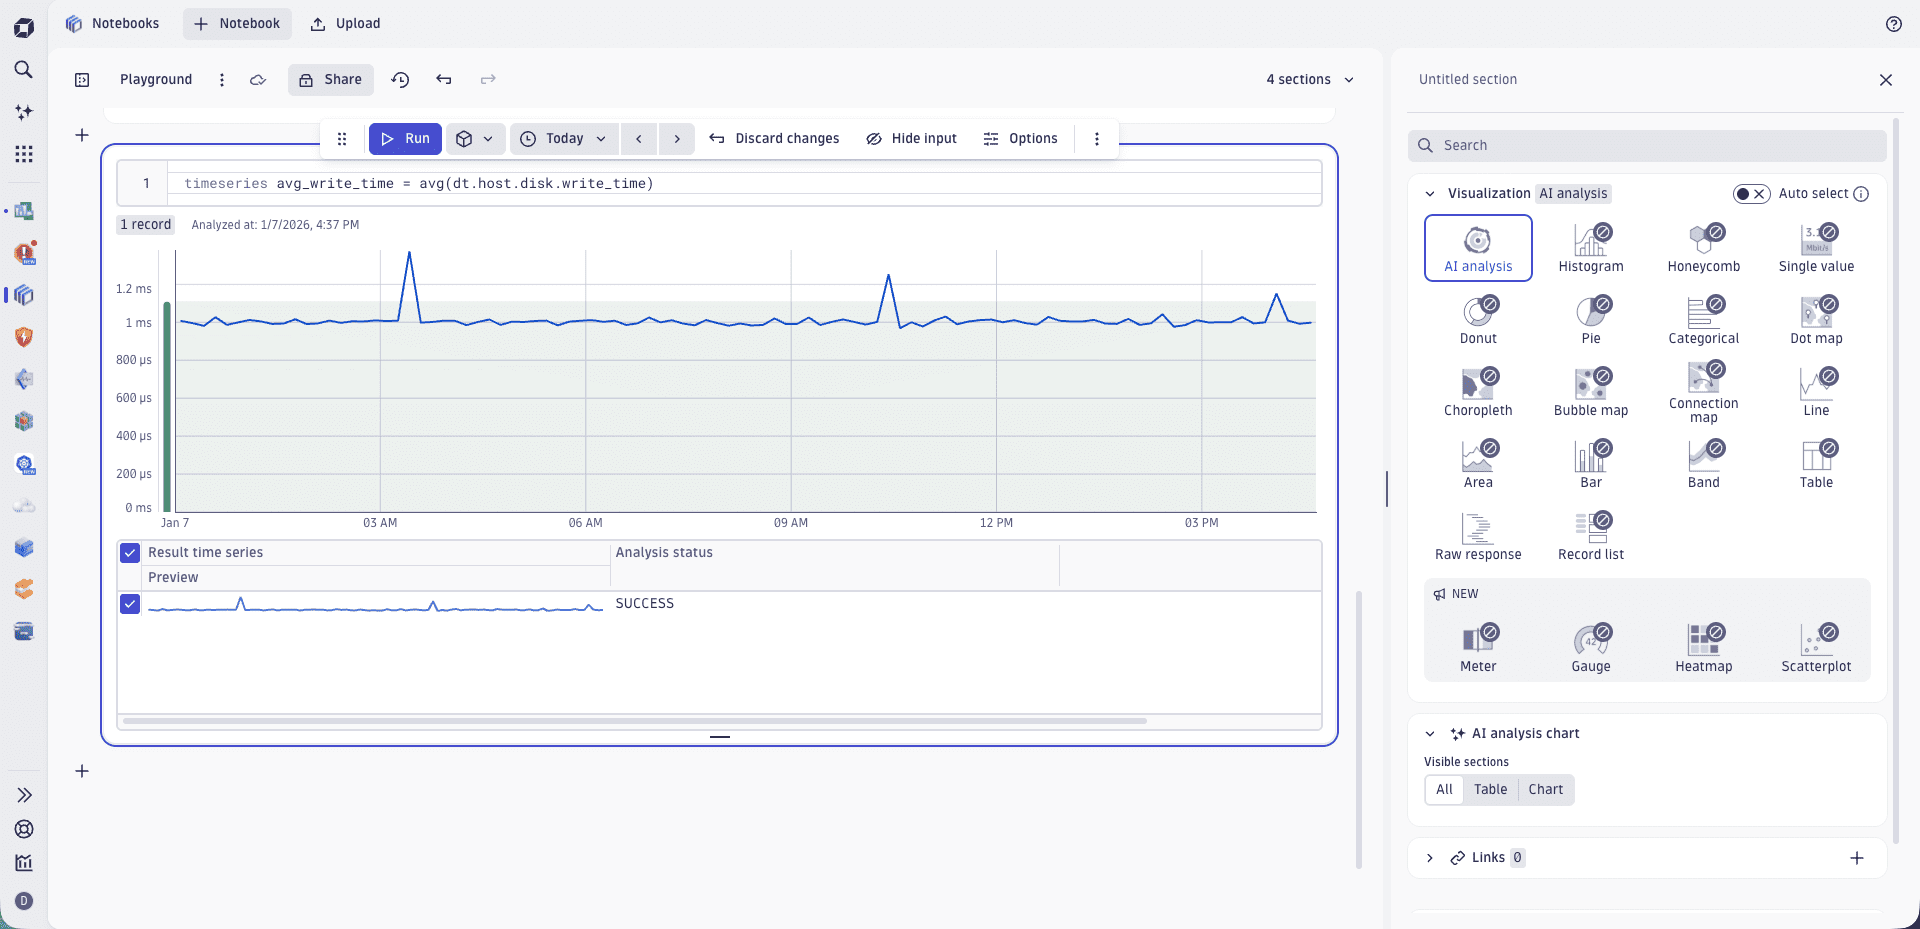 Example analyzer results with "AI analysis" visualization in the Notebooks app.
 - The chart shows a line for the selected metric (
Change variable values
If a dashboard has one or more variables, they are listed by name along the upper-left of the dashboard, under the dashboard name. When you change variable values, the dashboard contents are recalculated and displayed according to the new values.
To change the value of a variable
-
In the upper-left of the dashboard, locate the variable name.
-
Use the menu or edit box under the variable name to change the value.
- If the variable allows just one selection (value) at a time, select the value that you want to apply to the dashboard.
- If the variable allows multiple selections (values) at a time, select the checkbox for each value you want to apply to the dashboard. The menu name for that variable shows how many values are selected.
- For a Free Text variable, you can edit the text in the box under the variable name.
Copy to another document
You can copy a dashboard tile to another document (such as a different dashboard or a notebook).
For example, an easy way to start a new notebook is to copy reusable tiles from existing dashboards to a new notebook and then edit the copied sections as part of the new notebook.
To copy a dashboard tile to a notebook (as a notebook section)
-
In the dashboard, select the tile that you want to copy to a notebook.
-
Open the menu and select
 Add to notebook.
 -
In Select destination:
- If you want to create a new notebook with the selected dashboard tile as a section, select New notebook.
- If you want to add the selected dashboard tile as another section in an existing notebook, select the existing notebook from the list and then select Confirm.
The notebook opens with the selected tile copied into it as a notebook section.
To copy a dashboard tile to a different app (not Notebooks), open the menu and select Open with, and then select the target app.
For details, see Drilldowns and navigation.
Edit a tile
To edit a tile
-
Select the tile to display the tile-specific commands.
-
Select Edit.
An Options panel opens on the right to display the tile or section configuration.
-
Select and drag the expander control left or right as needed to resize the Options panel for a better look at the code.
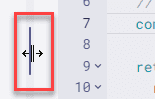 Resize options panel
Add or edit a tile title
You can add a title to any dashboard tile (except for a Markdown tile).
Regardless of the title setting, a title bar is automatically created as needed to display tile indicators such as for a warning or to indicate a custom tile timeframe.
-
Select the tile and edit it.
- The title is displayed in the box at the top of the tile edit panel.
- If the tile has no title, the box displays
Untitled tile.
-
Edit the title. Your edits are displayed as you type.
A title can include emojis (such as 😃 and 🌍 and ❤️) and variables.
Example:
- In your dashboard, define variables called
StatusandEmoji. - Set the title to
Current $Emoji status is $Status. - Set variable
StatustoGood. - Set variable
Emojito🌍.
The title will be displayed as
Current 🌍 status is Good, and it will update automatically when the variable values change. - In your dashboard, define variables called
To remove a tile title, select the tile and edit it, and then clear the title box.
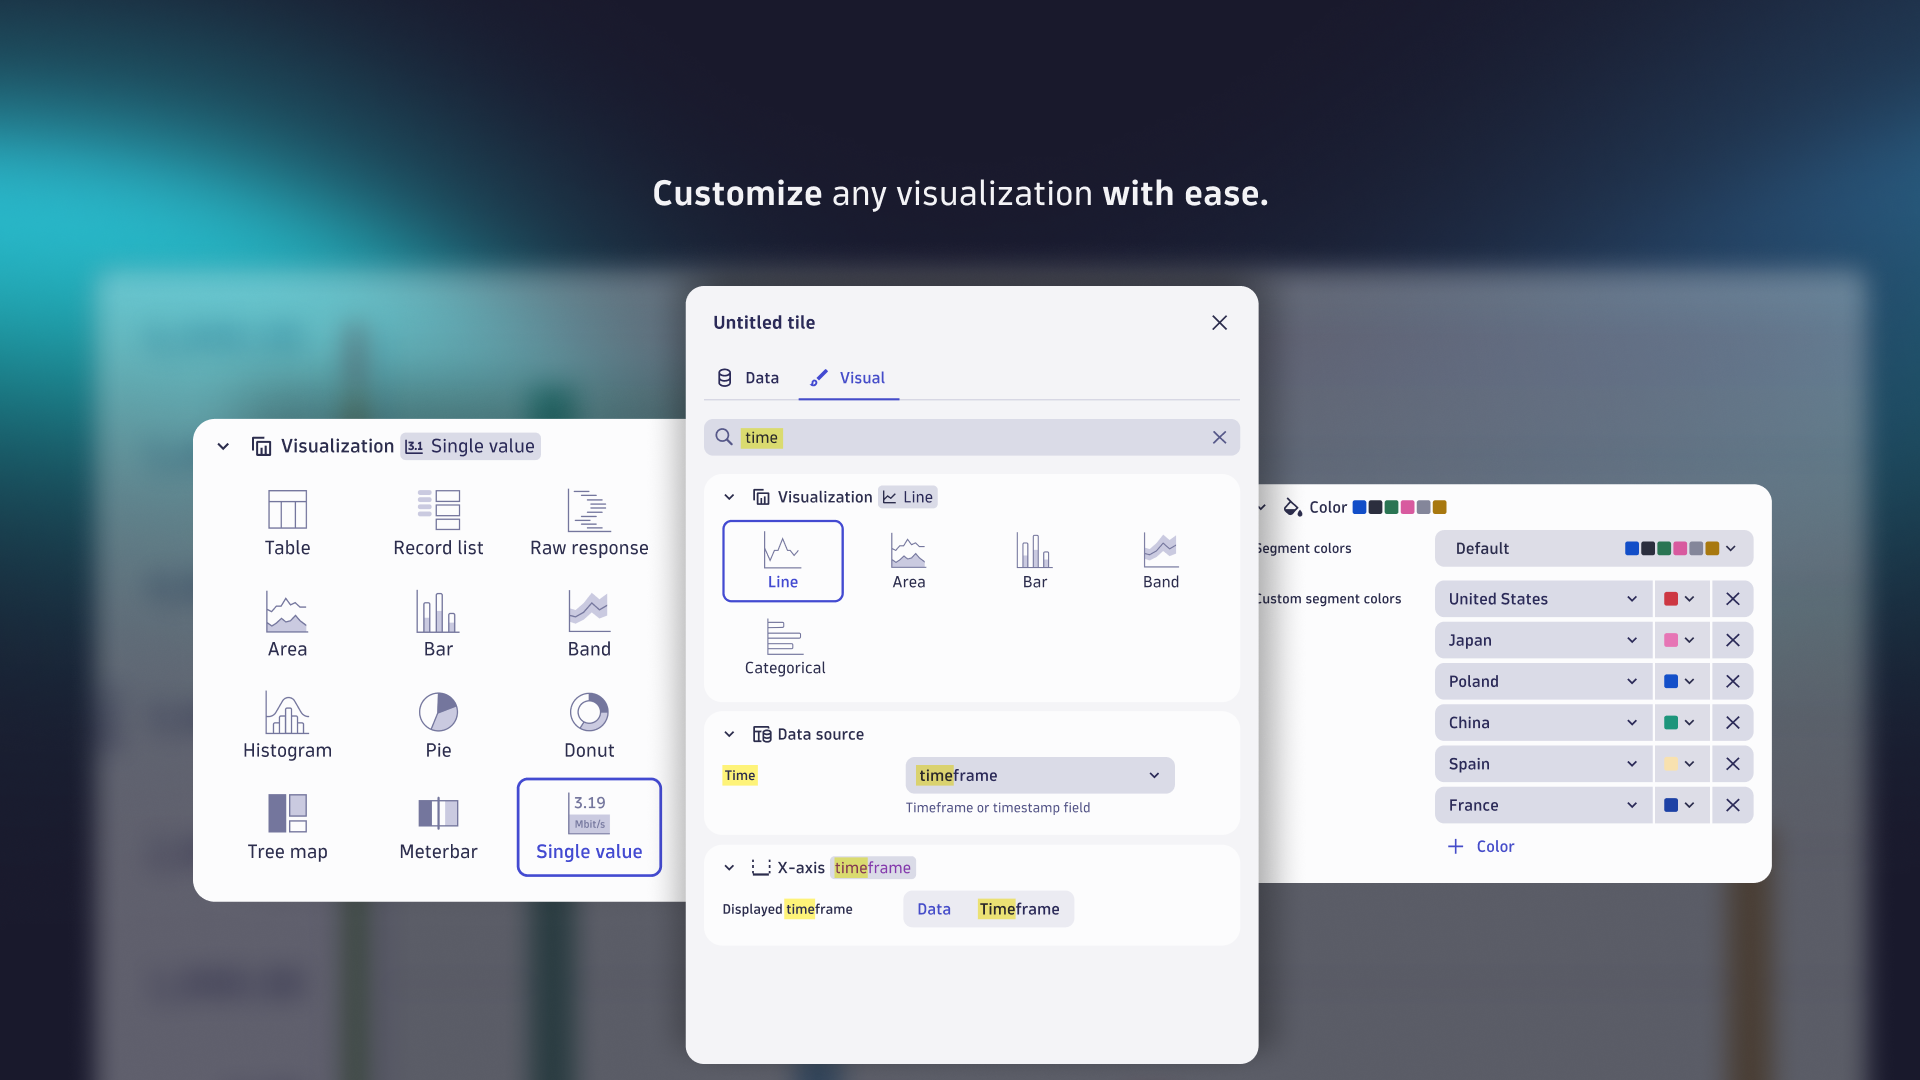
Configure a tile visualization
Each visualization has visualization-specific settings.
To edit a tile visualization, see the visualization instructions.
Edit dashboard JSON
You can edit the underlying JSON of a dashboard directly in Dashboards. This lets you reorder tiles, make bulk changes, or copy JSON partials between dashboards and environments, all without API calls.
To edit dashboard JSON
-
Display the dashboard.
-
Open the menu next to the dashboard name (in the upper-left corner of the dashboard).
-
Select Edit JSON.
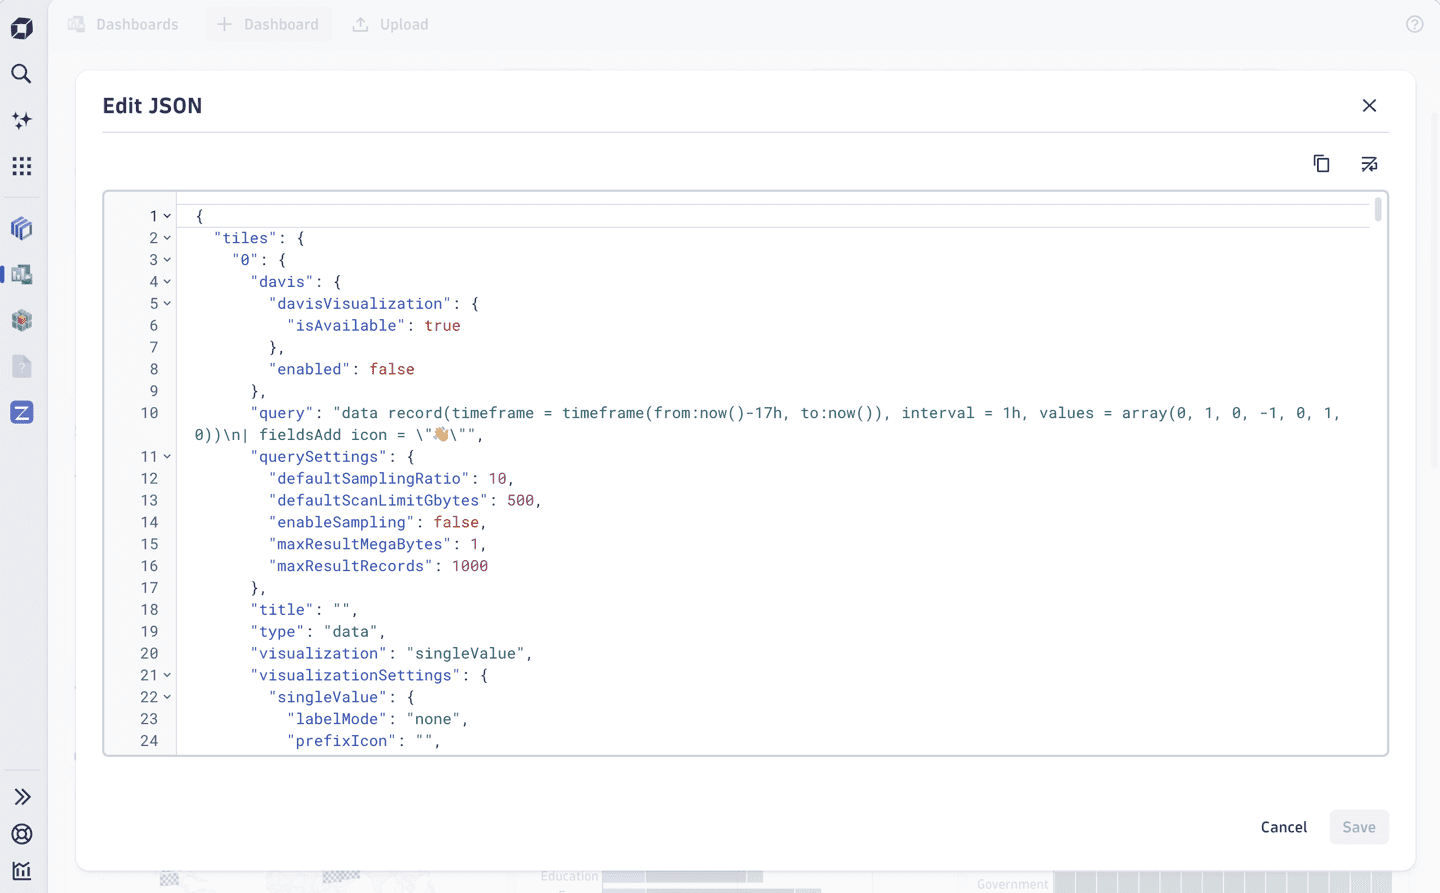 Edit JSON editor
 -
Make your changes.
-
Select Save. The editor closes, and your changes are reflected in the dashboard.
To use a different editing environment, select Copy JSON in the upper-right corner of the editor. After making your changes in another editor, paste the edited JSON back and select Save.
If your dashboard has validation errors, you need to fix them before you can save.
For details, see Dashboard validation.
Layout
Resize a tile
To resize one tile
-
Hover over the tile.
-
Select and drag the resize controls (for example, ) in the lower corners of the tile to change the dimensions of the tile.
To help you select a specific size and position:
- The tile size is displayed on the tile command bar.
- The grid is displayed in the background.
To resize multiple tiles at the same time
- Ctrl-click the tiles you want to resize.
- Select and drag the resize controls (for example, ) in the lower corners of the selected tiles to change the dimensions of the selected tiles.
Move a tile
You can move one tile at a time or select and move multiple tiles simultaneously.
To move a tile, drag the tile to a new position.
-
If the tile has a title, select and drag the title bar to move the tile.
-
If the tile has no title, select the tile to display the tile-specific commands, and then select and drag on the tile command bar to drag the selected tile to a new location.
To help you align tiles, a background grid is displayed when you're moving a tile.
To move multiple tiles simultaneously
- Ctrl-click the tiles that you want to move.
- Each selected tile is highlighted.
- The total number of selected tiles is displayed on the tile command bar.
- Select and drag Move to drag all of the selected tiles to a new location.
Copy and paste a tile
You can copy and paste tiles to the same dashboard or another dashboard.
To copy and paste one tile
-
Select the tile to display the tile-specific commands.
-
On the tile command bar, select Copy to clipboard.
The selected tile is copied to your clipboard.
-
Paste the tile (Ctrl-V).
- You can paste the copied tile to the current dashboard, in which case it's the equivalent of Duplicate.
- You can switch to another dashboard and paste the copied tile there.
To copy and paste multiple tiles simultaneously
-
Ctrl-click the tiles that you want to copy and paste.
- Each selected tile is highlighted.
- The total number of selected tiles is displayed on the tile command bar.
-
On the tile command bar, select Copy to clipboard (or use keyboard shortcut Ctrl-C).
The selected tiles are copied to your clipboard.
-
Paste the tiles (Ctrl-V) to the same dashboard or switch to another dashboard and paste them there.
Duplicate a tile
You can duplicate one tile at a time or duplicate multiple tiles simultaneously.
To duplicate one tile
-
Select the tile to display the tile-specific commands.
-
Select Duplicate.
Depending on the availability of space on your dashboard, a duplicate tile is placed next to or under the original tile, or the original tile's space is halved to make room for the original plus the duplicate. If the automatic tile placement isn't what you want, you can, of course, move your duplicate tiles manually.
Select a tile and hover over the Duplicate button to see where the duplicate would be placed.
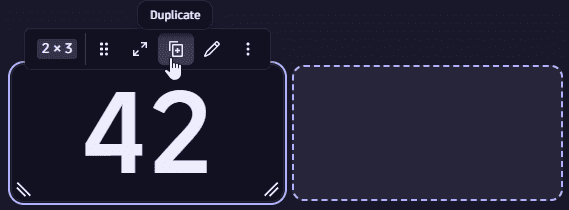 Duplicate one tile
To duplicate multiple tiles simultaneously
- Ctrl-click the tiles that you want to duplicate.
- Each selected tile is highlighted.
- The total number of selected tiles is displayed on the tile command bar.
- On the tile command bar, select Duplicate.
Split tile space to insert new tile
When laying out a dashboard, you can split the space that a tile uses on the grid, and insert a second tile next to the first tile within the same space.
- The first tile is unaffected other than that it now uses half the width or height it used before you split the space.
- The second (new) tile uses the other half of that layout space.
- This is available only when you select a single tile that is big enough to split. It's not available when you select multiple tiles, or if the size of the selected tile is too small to split.
For example, let's select a tile and add another tile to its right, so that the two tiles share the space originally used by the first tile.
-
Select the tile.
-
Hover over the tile to see the split controls—left, right, and bottom—to indicate where you split that space and insert a new tile.
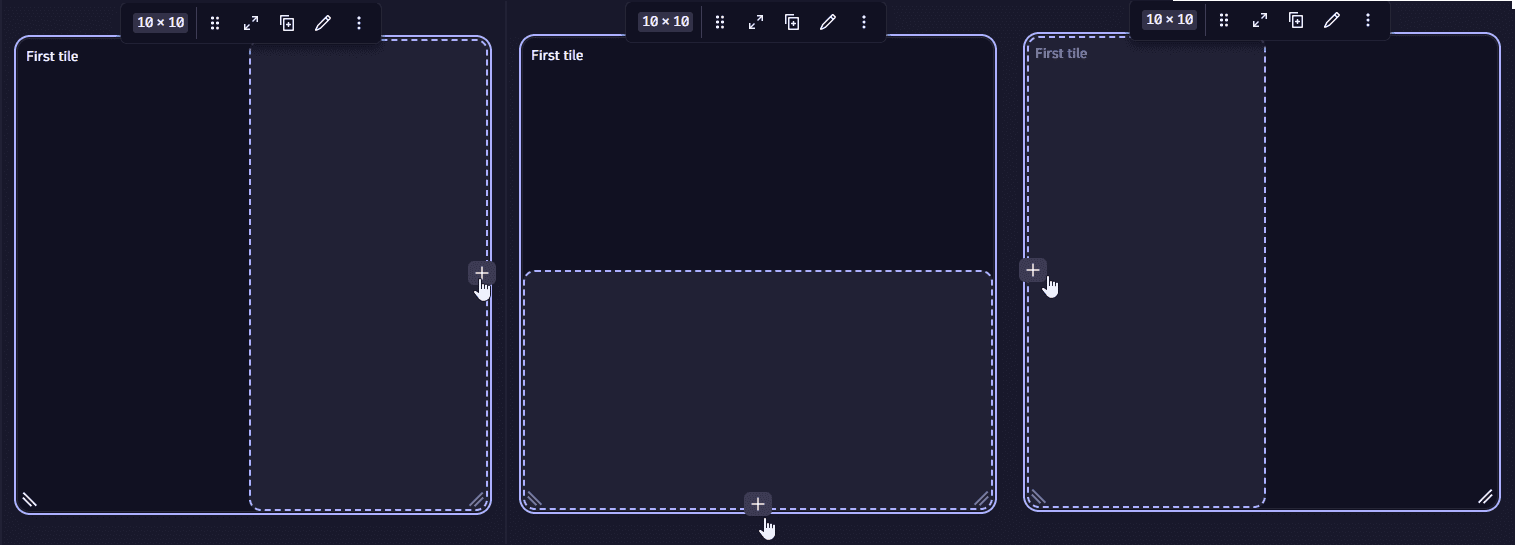 Split a dashboard tile to insert another tile within the same space
 -
In this example, select the control on the right. It opens a menu similar to the menu you would otherwise use to add a tile to the dashboard.
-
Select the tile type you want to add.
-
Edit the definition of the new tile and close the edit panel to see the changed layout.
- The original tile is unchanged except that it now uses only the left half of the space it used before.
- The new tile uses the right half of that space.
- You can still adjust the tile sizes and positions manually.
Delete a tile
You can delete one tile at a time or select and delete multiple tiles simultaneously.
To delete one tile
- Select the tile to display the tile-specific commands.
- On the tile command bar, select More actions > Delete.
To delete multiple tiles simultaneously
- Ctrl-click the tiles that you want to delete.
- Each selected tile is highlighted.
- The total number of selected tiles is displayed on the tile command bar.
- On the tile command bar, select Delete.
Dashboards