Adaptive Traffic Management with Dynatrace classic license
- Latest Dynatrace
- Explanation
Adaptive Traffic Management manages the sampling rate dynamically and targets a specific peak trace data volume. This volume scales with the number of active host units in your Dynatrace Full-Stack classic license.
Before you begin
Prerequisites
- Dynatrace OneAgent
- Dynatrace classic license with Full-Stack Monitoring mode or earlier version of Dynatrace Platform Subscription
Key terms
- Full-service call
A server-side call that starts a distributed trace, a service call at a deep monitored tier, or a custom service call. A single distributed trace can contain multiple full-service calls. Full-service calls include all requests for web request services and web services (except for external ones), RMI services, messaging services, and custom services. External requests (such as database calls, external web requests, or generally any opaque service call) are not full-service calls, and so aren't counted against your traffic limit. The minimum number of full-service calls per minute in a given environment is 5,000 (the equivalent of 20 host units). Each process can start between 50 and 50,000 full-service calls per minute.
- Active host units
Host units currently in use and connected to the environment (not the host units assigned to the environment).
- Assigned host units
Host units currently assigned and connected to the environment, but not necessarily in use.
How does Adaptive Traffic Management work?
Dynatrace Full-Stack Monitoring packages a variety of features, including fully automatic distributed tracing. Each monitored application or microservice is constantly monitored and the Dynatrace code module collects distributed traces, containing code-level and business insights, that are sent to Dynatrace.
Full-Stack Monitoring includes a trace data volume. Depending on the number of application transactions, OneAgent captures end-to-end traces up to a peak trace volume, which is defined per environment by your license. When the volume of transactions is high, the amount of traces that can be captured by OneAgent might exceed the peak trace volume available in your environment, or in other words, there are not enough active host units connected to your environment to capture all traces.
When this happens, OneAgent starts sampling new incoming traces that have a trace root span. It samples incoming traces in the most effective way possible, via the intelligent mechanism of Adaptive Traffic Management, stopping overages and consequentially saving a lot of network bandwidth.
The resulting capture rate is defined as the OneAgent capture rate. While not all possible traces might be captured, any trace that is captured represents a full end-to-end transaction.
Dynatrace provides the Configuring trace sampling rules for HTTP and RPC requests configuration option to control which requests are captured when Adaptive Traffic Management is sampling. If a process monitored by OneAgent has a capture rate below 100%, you can prioritize specific HTTP or RPC requests to be captured more or less often relative to other request types. For details, see Adjust trace sampling for HTTP or RPC requests.
Differences from other sampling mechanisms
-
Environment-wide allocation vs per-service rates
Many sampling approaches, such as fixed head-based sampling configured in individual SDKs or agents, make sampling decisions independently per service or host. With Adaptive Traffic Management, the peak trace volume defined by your classic Full-Stack Monitoring license is shared dynamically across all monitored applications in the environment, so low-volume applications effectively share unused capacity with high-volume applications that need more traces.
-
Adaptive vs static configuration
Traditional sampling is often configured as a static percentage per service or via hand-maintained rules. Adaptive Traffic Management continuously adjusts the number of traces that OneAgent starts based on the current transaction volume and the peak trace volume available to your environment, while still allowing you to steer specific requests via HTTP- and RPC-based trace sampling rules.
-
Cost and volume predictability
With fixed sampling rates, the total amount of captured trace data still scales with transaction volume, so trace ingest and storage costs follow traffic spikes. With Adaptive Traffic Management, the captured trace data is kept roughly within the trace volume included with your Full-Stack Monitoring classic license, which makes trace ingest and cost more predictable.
Capturing logic
We recognize that the distribution of requests and their relevance to your observability goals is not even. It's rather a combination of: a large number of unique URLs, a medium number of important requests, and, finally, a few kinds of requests that make up the majority of the traffic (for example, image requests or status checks).
OneAgent first calculates a list of top requests starting each minute, from which it then captures:
- Most traces of unique and rare requests.
- A significant but lower volume of highly frequent requests.
This ensures that you use your trace volume most effectively. Because the sampling is not random, important data is captured while maintaining a statistically valid sample set.
Example
The following table represents a top-request calculation example, along with the respective capture rates.
| Request | Number of requests processed by the application (per minute) | Capture factor | Captured distributed traces (per minute) |
|---|---|---|---|
URI A | 900 | 1/2 | 450 |
URI B | 440 | 1/2 | 220 |
URI C | 250 | 1 | 250 |
URI D | 60 | 1 | 60 |
…50 other URIs | 100 | 1 | 100 |
Total: | 1500 | 1080 |
In this example, OneAgent can capture a bit more than 1,000 requests per minute, according to the amount of active host units connected to the license. Adaptive Traffic Management adjusts the capture rate for each URI to meet the target. Depending on the capture factor, URIs are captured each time the application processes them (URIs C, D, and 50 other URIs) or half of the time (URIs A and B). In both cases the requests are captured end-to-end.
Peak trace volume calculation
The peak trace volume is measured in full-service calls per minute and is calculated based on the number of active host units in your environment.
Each environment processes a minimum trace volume. For each active host unit, the environment peak trace volume is increased by a fixed value.
Every 15 minutes, the peak trace volume is calculated and automatically adjusted based on the current number of active host units.
To learn more about the trace included volume of Full-Stack, see Application and Infrastructure Monitoring.
Effects
If OneAgent is sampling and not all requests are captured, then captured traces point out that similar requests have not been captured with the message [number of traces] similar trace. You can see it by expanding the trace in  Distributed Traces Classic list.
Adjust trace sampling for HTTP or RPC requests
When you increase or decrease the sampling frequency of HTTP or RPC requests, these requests are captured more or less often relative to other request types.
- OneAgent version 1.331+ Reduction rules are always applied independent of the current OneAgent capture rate or adaptive trace sampling rate. This approach reduces trace volume more effectively, making it available for higher‑priority requests.
- OneAgent version 1.329 and earlier Reduction rules generally affect sampling only when the OneAgent module initiating the distributed trace captures less than 100% of traces.
Effect of tracing deactivation on capture rate
Modifying trace sampling for HTTP or RPC requests does not change the overall capture rate for the process or the overall ingested trace data volume. However, if you deactivate tracing for specific HTTP and RPC requests, the capture rate is increased.
In all environments, there are transactions for which traces are of lower value. You can turn off tracing for specific HTTP and RPC requests completely at any time, freeing up trace volume for more important requests. This feature removes those traces completely from the capture rate calculation (they are no longer considered when computing the capture rate) and therefore leads to an overall increase in capture rate.
Prerequisites
- For HTTP request trace sampling: OneAgent version 1.281+
- For RPC request trace sampling: OneAgent version 1.307+
Available configuration scopes
You can configure web request trace sampling for the following configuration scopes: environment, host group, process group, Kubernetes cluster, and Kubernetes namespace.
-
Any Dynatrace version For all traces in your environment.
-
Dynatrace version 1.312+ For traces started within a particular host group, process group, Kubernetes cluster, or Kubernetes namespace. This is useful if you don't have environment permissions or want to modify trace sampling for a particular part of your environment.
1. Navigate to trace sampling configuration page
Navigate to the trace sampling configuration page depending on the entity for which you want to modify the sampling frequency of HTTP or RPC requests.
Environment
-
Go to the trace sampling configuration page.
- Latest Dynatrace: Go to
 Settings > Collect and capture > Distributed tracing > Trace sampling for HTTP requests or Trace sampling for RPC requests.
 - Dynatrace Classic: Go to Settings > Server-side service monitoring > Trace sampling for HTTP requests or Trace sampling for RPC requests.
- Latest Dynatrace: Go to
Host group
-
Go to
 Deployment Status > OneAgents.
 -
On the OneAgent deployment page, turn off Show new OneAgent deployments.
-
In the Filter by field, enter Host group, and then select the host group you want to configure from the dropdown list.
The host list is now filtered by the selected host group. Each listed host has a Host group:
<group name>link, where<group name>is the name of the host group that you want to configure.The Host group property is not displayed when the selected host doesn't belong to any host group.
-
Select the host group name in any row.
As you have filtered by host group, all displayed hosts go to the same host group.
-
Navigate to the trace sampling configuration page.
- Latest Dynatrace: Close the host group settings overlay, and go to Collect and capture > Distributed tracing > Trace sampling for HTTP requests or Trace sampling for RPC requests.
- Dynatrace Classic: From the navigation menu on the left, select Trace sampling for HTTP requests or Trace sampling for RPC requests.
Process group
Dynatrace Classic and Latest Dynatrace
-
Go to
 Technologies & Processes Classic and choose a technology.
Alternatively, go to
 Hosts Classic and choose a host.
 -
Find and select the required process group.
-
In the upper-right corner of the process group overview page, select Settings.
-
Select Trace sampling for HTTP requests or Trace sampling for RPC requests.
Kubernetes cluster or namespace
Latest Dynatrace
- Go to
") Kubernetes.
Kubernetes. - Select Clusters or Namespaces.
- Find and select the required Kubernetes cluster or namespace.
- In the upper-right corner of the cluster or namespace pane, select (Actions menu) > Service detection settings.
- Go to Collect and capture > Distributed tracing > Trace sampling for HTTP requests or Trace sampling for RPC requests.
Dynatrace Classic and Latest Dynatrace
- Go to
 Kubernetes Classic.
 - Find and select the required Kubernetes cluster.
- Go to the cluster or namespace settings page.
- Cluster: In the upper-right corner of the cluster overview page, select More (…) > Settings.
- Namespace: Find and select the required namespace, and then select More (…) > Settings in the upper-right corner of the namespace overview page.
- Select Trace sampling for HTTP requests or Trace sampling for RPC requests.
2. Modify trace sampling
Adjust the trace sampling for your HTTP or RPC requests.
HTTP request
-
Select Add URL.
-
Choose how to adjust the trace sampling.
- To never capture traces for the URL, regardless of the available trace volume, turn on Disable tracing for matching HTTP requests.
- To increase or reduce the frequency of trace capture for the specific URL, set Importance of a specific URL to the required scaling factor.
-
To match the HTTP request, do one or a combination of the following:
-
Enter the URL path and select the comparison condition.
Use wildcards (
**) for URL paths with similar segments.For example, in
/api/product/**/detail, all values between slashes are ignored; the path applies to both/api/product/1/detailand/api/product/2/detail. -
Use the query parameters.
- Under Query parameters, select Add item.
- Enter a query parameter name.
- Enter the query parameter value, or turn on Query parameter value is undefined.
-
-
Optional To apply the scaling factor to specific HTTP methods, turn off Any HTTP method, and select the required HTTP methods.
-
Select Save changes.
RPC request
-
Select Add RPC.
-
Choose how to adjust the trace sampling.
- To never capture traces for the RPC, regardless of the available trace volume, turn on Disable tracing for matching RPC requests.
- To increase or reduce the frequency of trace capture for the specific RPC, set Importance of a specific RPC to the required scaling factor.
-
Specify the Protocol.
-
To match the RPC request, enter the name and the comparison condition of one or a combination of the following parameters:
- Remote operation name
- Remote service name
- Endpoint name
-
Select Save changes.
Use case examples
Check the examples below to understand how to properly adjust the trace sampling for your HTTP or RPC requests.
Example 1: Reduce capturing of a frequently executed health check request that provides values less than 60 times/minute
The following rule reduces the importance (by a factor of four) of requests that start with _healthz.
- Navigate to the Trace sampling for HTTP requests page for your environment.
- Select Add URL.
- From Importance of a specific URL, select Reduce capturing by factor 4.
- Enter
/_healthzfor the URL path. - From Path comparison condition, select Starts with.
- Turn on Any HTTP method.
- Select Save changes.
Example 2: Never capture an HTTP OPTIONS request on web servers for a process group
The following rule ignores all requests (starting with /) that use OPTIONS as an HTTP method for a selected process group.
- Navigate to the Trace sampling for HTTP requests page for your process group.
- Select Add URL.
- Turn on Ignore a specific URL.
- Enter
/for the URL path. - From Path comparison condition, select Starts with.
- Turn off Any HTTP method.
- From the HTTP method list, turn on OPTIONS.
- Select Save changes.
- Optional Create a new rule for each process group that you want to target.
Monitor Adaptive Traffic Management and trace data ingest
To monitor your environment trace capture rate and volume ingress, go to  Dashboards Classic and select the OneAgent Traces - Adaptive Traffic Management (Classic License) preset dashboard.
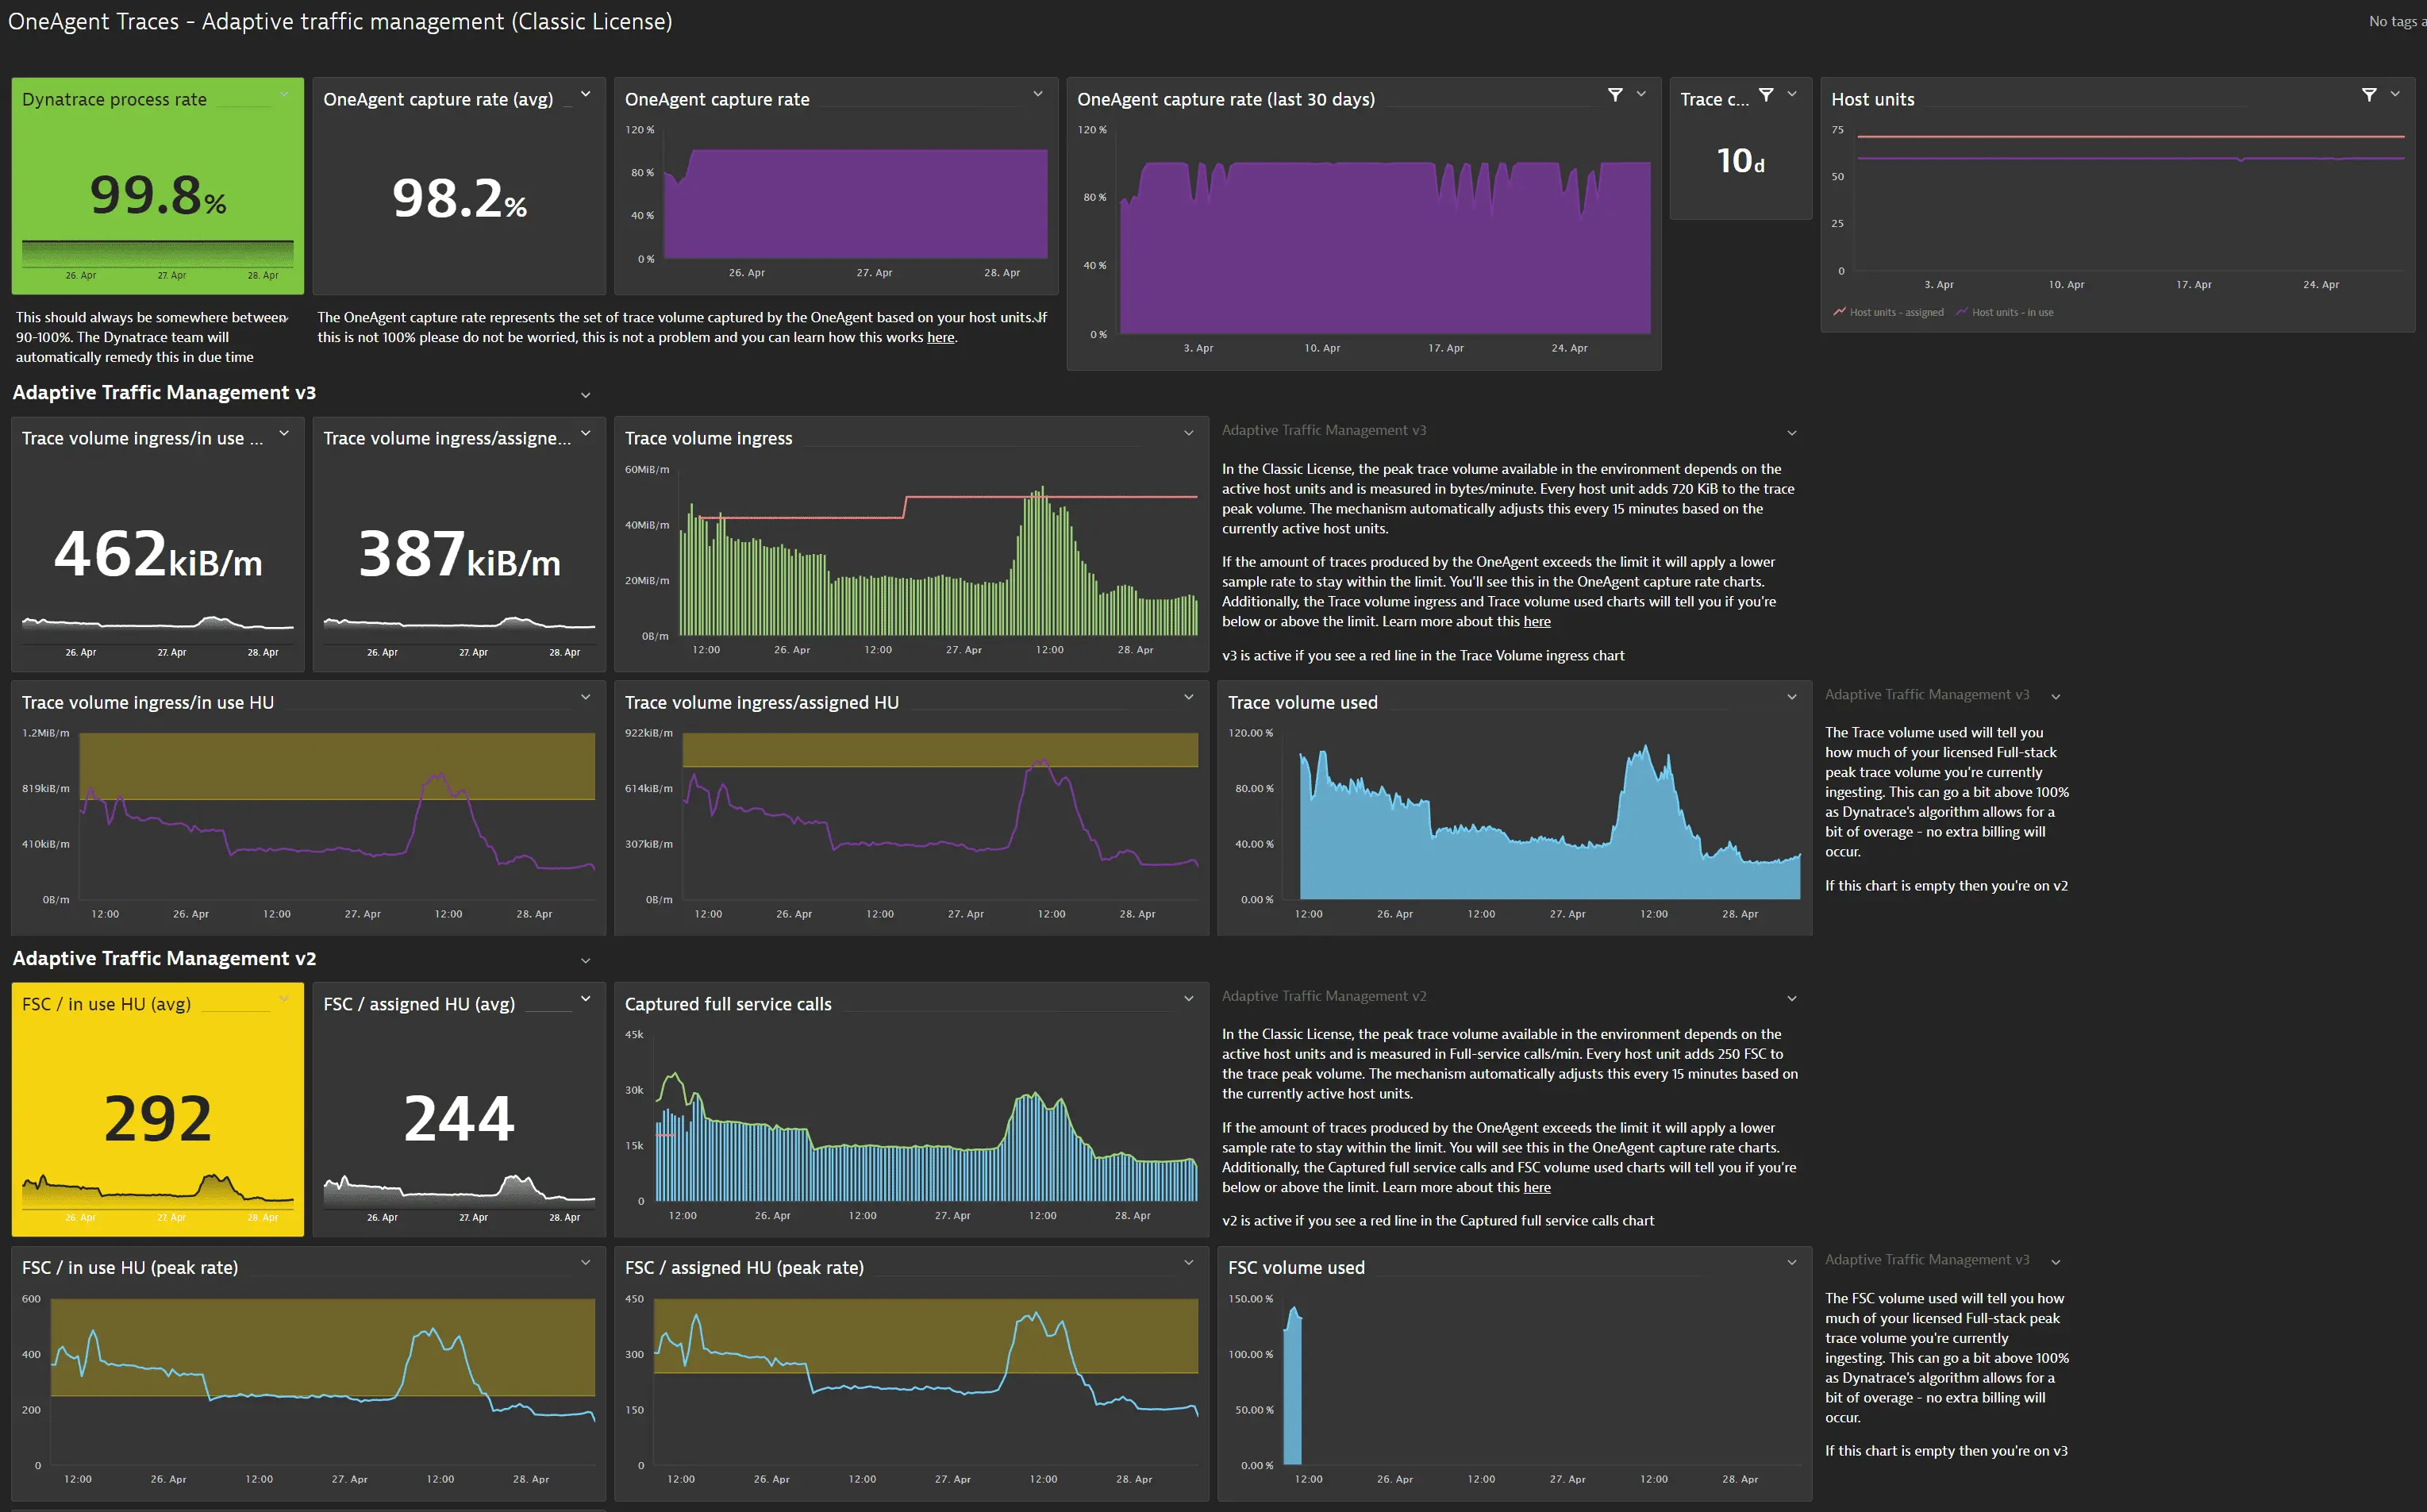
The different dashboard tiles are described in the table below.
| Tile | Description |
|---|---|
Dynatrace process rate | Percent of full-service calls processed by OneAgent over all full-service calls received by the environment. It represents the environment's health. If the value is continuously below 90%, Please contact a Dynatrace product expert via live chat within your environment. |
OneAgent capture rate | Percent of traces captured end-to-end by OneAgent over all traces received by the environment. Values below 100% indicate sampling was applied to reduce trace volume down to within licensed limits. |
Trace capture rate | Captured traces, as a percentage of the total number of observed end-to-end transactions processed by OneAgent monitored application or host. Note that the trace capture rate might be lower than the request capture rate because a single trace might consist of multiple requests. |
Captured full service calls | Indicates the amount of received full-service calls (blue), the peak trace volume (red), and the overall potentially traceable service calls (green) processed by the OneAgent over time1. |
Size of full-service calls | Amount of data per service call2 over time. Typical values are around 2-3 KiB per environment. |
FSC/in use HU | Number of full-service calls per active host unit that the environment is using. Typical values are around 250. |
FSC/assigned HU | Number of full-service calls per assigned host unit (not necessarly in use). |
Values above the licensed limit indicate overages, for which sampling is triggered. After sampling is applied, values return to within licensed limits and the OneAgent capture rate will be below 100%.
Service call data includes request attributes, span attributes, HTTP headers, and bind variables.
FAQ
How does Adaptive Traffic Management affect charts, baselining, and alerting?
Usually not at all.
The shaping of traffic is accounted for transparently and done in a way that ensures statistical validity while capturing rare requests with high probability. All charts and analysis options show the total number of requests that your application processes with high statistical accuracy. You will not see a difference in charts or service call analysis data unless you're looking at a single distributed trace.
Does Adaptive Traffic Management affect service settings or (global) request monitoring settings?
No, Adaptive Traffic Management focuses only on the number of traces. Neither service settings nor (global) request settings are modified by Adaptive Traffic Management. Depending on the capture rate and sampling, a low-volume or unique request might not be captured. Service settings such as request naming rules and key request settings will apply only to captured traces.
Does Adaptive Traffic Management affect service metrics?
Yes, in a few cases, as service monitoring metrics are based on captured traces. The following are some known effects.
- For low-frequency requests in high-volume environments, sampling and a low capture rate can impact the accuracy of metrics. Due to the low frequency of the requests, traces might be captured in a lower volume or not be captured at all. Consequentially some metrics values can't be collected. Note that this is reflected in service metric calculations to avoid distortions in charts.
- Because every single request is accounted for in charts with high resolution and in short timeframes, for high-volume services, sampling and a low capture rate might impact the accuracy of metrics such as request count or error count. Conversely, the accuracy will statistically be better in charts with low resolutions and long timeframes.
Dynatrace is not using all available host units. What can I do?
The calculation of peak trace volume is based on the currently active host units. To use all the host units that are assigned to the environment, contact a Dynatrace product expert via live chat and provide a rationale.
This is an environment-wide change, so you need Dynatrace administrator permissions to turn this feature on.
What can I do to increase the OneAgent capture rate?
If OneAgent capture rate is below 100%, sampling has been applied because the amount of traces that can be captured by OneAgent has exceeded the Full-Stack included trace volume. There are several things you can do to increase the capture rate:
-
Verify what is currently being captured and reduce the rate for traces and requests of lower relevance. Start by looking at the following:
-
Excessive custom services
Custom services with poor configurations can lead to a high number of full-service calls and increase the trace ingress volume. If custom services are consuming a considerable amount of the trace volume, revisit the configuration to reduce the amount of capture custom-service calls.
-
Background activity services
In certain environments, background activity produces a lot of service calls but adds little value. To disable this feature on an environment-wide level, go to Settings > OneAgent features and turn off BBackground Requests for Services (HTTP/GRPC) and Background Requests for Services (Messaging).
-
High number of low-value traces
In all environments, there are transactions for which traces are of lower value. You can exclude the following transactions from capture:
-
Specific transactions such as ping and health check traces. To disable tracing for specific traces, go to Settings > Server-side service monitoring > Deep monitoring.
-
- Entire processes (such as log forwarders) that are written in a runtime for which deep monitoring by OneAgent is available. To disable tracing for entire processes, go to the process-level Settings > Deep monitoring.
-
-