Adaptive Traffic Management with Dynatrace Platform Subscription (DPS)
- Latest Dynatrace
- Explanation
- 9-min read
Adaptive Traffic Management (ATM) is an intelligent trace sampling mechanism Dynatrace uses for Full-Stack Monitoring.
OneAgent automatically manages the volume of ingested trace data via Adaptive Traffic Management and continuously adjusts the adaptive trace sampling rate to keep the ingested trace data volume roughly within your total licensed Full-Stack trace volume.
By default, the total licensed Full-Stack trace volume equals the Full-Stack included trace volume. If you extend the amount of trace data ingested with OneAgent, the total licensed Full-Stack trace volume becomes the sum of the included and extended volumes.
With Dynatrace Platform Subscription (DPS), Adaptive Traffic Management applies this behavior to all full-stack monitored hosts and applications and can be further controlled via trace ingest control and trace sampling settings.
Before you begin
Prerequisites
If you have a Dynatrace Platform Subscription (DPS) license that was signed prior to April 26, 2023, refer to Adaptive Traffic Management with Dynatrace classic license. For these licenses, Adaptive Traffic Management consumption is calculated the same way as with Dynatrace classic licenses.
Adaptive Traffic Management overview
Adaptive Traffic Management continuously monitors the ingested trace data volume from full-stack monitored hosts and applications. If the ingested trace data volume exceeds your total licensed Full-Stack trace volume, Adaptive Traffic Management lowers the adaptive trace sampling rate on OneAgent. This reduces the trace capture rate and therefore the ingested trace data volume while keeping it roughly within the total licensed Full-Stack trace volume.
In a dynamic cloud environment, the amount of traffic and contributing memory can change frequently. Adaptive Traffic Management automatically adjusts the sampling rate of trace data collection in 15-minute intervals so that the collected trace data doesn't exceed your total licensed Full-Stack trace volume without your explicit consent.
In many cases, this results in a trace capture rate of 100% of all possible traces. However, depending on the monitored applications and the configuration of certain features in your environment, your capture rate might be lower.
If the OneAgent capture rate is below 100%, it means the adaptive trace sampling rate is lower than needed to capture all possible distributed traces. You can control which traces are captured by adjusting the adaptive trace sampling rate for full-stack monitored hosts and applications and by configuring trace sampling rules for specific HTTP and RPC requests.
Adaptive Traffic Management sampling decisions are made locally (on OneAgent, or on Envoy when using the Dynatrace sampler) before any Dynatrace backend infrastructure including OpenPipeline is involved. OpenPipeline processing cannot be used as an alternative to ATM configuration for controlling trace volume.
Where sampling rules take effect
Trace sampling for full-stack monitored hosts and applications is head-based: the decision to capture a trace is made once by the OneAgent that starts the trace and is then propagated to every service the trace passes through via the trace context header.
Therefore, a sampling rule takes effect on the scope where traces are initiated—that is, on root spans. A rule configured for a scope that only continues traces started elsewhere doesn't change how often those traces are captured, as the decision was already made upstream.
When you adjust the adaptive trace sampling rate or configure fixed-rate sampling, select the scope that contains the entry point of the traces you want to control. For example, if all external requests enter your cluster through a service in the ingress namespace, a rule set for the checkout namespace doesn't affect those traces. Instead, configure either the ingress namespace or a scope that contains this namespace. The rule set for the checkout namespace still applies to traces that start there, such as background jobs or scheduled tasks.
Options used to control trace volume usage and capture rate
Dynatrace provides the following configuration options to control trace volume usage and capture rate:
-
Configuring adaptive sampling rules
Adjust the multiplier used to calculate the sampling threshold at the deployment level. This lets you control the usage of the usable adaptive trace volume much more closely to where you need it. For details, see Adjust adaptive trace sampling rate. -
Reducing the usable adaptive trace volume provided to Adaptive Traffic Management
Reduce adaptive usage when it's not needed. This allows you to allocate part of the Full-Stack included trace volume to fixed-rate sampled spans from OpenTelemetry or OneAgent, or to better self-service your trace volume after requesting extended ingest. For details, see Reduce usable adaptive trace volume. -
Configuring trace sampling rules for HTTP and RPC requests
If a process monitored by OneAgent has a capture rate below 100%, you can prioritize specific HTTP or RPC requests to be captured more or less often relative to other request types. For details, see Adjust trace sampling for HTTP or RPC requests. -
Configuring fixed-rate sampling
Capture traces initiated within a scope at a configured rate, regardless of the current adaptive trace sampling rate or ingested trace data volume. This is useful when you need a guaranteed or predictable capture rate for regulatory, auditing, fraud detection, business, or supportability reasons. For details, see Configure fixed-rate sampling.
Differences from other sampling mechanisms
-
Environment-wide allocation vs per-service rates
Many sampling approaches, such as fixed-rate head-based sampling configured in individual SDKs or agents make sampling decisions independently per service or host, at a static rate. Adaptive Traffic Management also samples at the start of a trace (head-based sampling), but distributes the usable adaptive trace volume across all OneAgents in an environment, so low-volume services effectively share unused capacity with high-volume services that need more traces.
-
Adaptive vs static configuration
Traditional sampling is often configured as a static percentage per service or via hand-maintained rules. Adaptive Traffic Management continuously adjusts the adaptive trace sampling rate based on the actually ingested trace data volume and your total licensed Full-Stack trace volume, while still allowing you to control specific requests via HTTP- and RPC-based trace sampling rules.
-
Cost and volume predictability
With fixed sampling rates, the total amount of captured trace data still scales with transaction volume, so trace ingest and storage costs follow traffic spikes. Adaptive Traffic Management keeps ingested trace data from full-stack monitored hosts and applications roughly within your total licensed Full-Stack trace volume or a configured percentage of it, making trace ingest and cost more predictable.
Trace volume calculation
The Full-Stack included trace volume is measured in bytes per minute. It is calculated based on your Full-stack gibibyte-hours.
Each environment can process a minimum trace volume. For each contributing gibibyte, the environment peak trace volume is increased by 200 KiB per minute, for a total included volume of 3,000 KiB per contributing gibibyte in each 15-minute interval.
Every 15 minutes, the peak trace volume is calculated and automatically adjusted based on the average of contributing gibibytes in the previous 15-minute interval.
With Dynatrace Platform Subscription (DPS), all features—especially data-heavy ones like bind variables capture—are available.
To learn more about the Full-Stack included trace volume, see Traces included with Full-Stack Monitoring.
Effects
If OneAgent applies Adaptive Traffic Management and not all requests are captured, the individual spans have the sampling.threshold attribute with a non-zero value. This attribute represents the effective sampling threshold used when the trace was created, and it's visible in  Distributed Tracing and the single trace perspective metadata. You can use the
 sampling.threshold attribute to derive the effective trace capture rate for a process.
Volume and billing scenario
The following scenario demonstrates how each configuration lever affects trace capture rates, ingested volumes, and billing.
The example environment consists of four Kubernetes namespaces (Namespace A through Namespace D), each generating 40 GiB of potential trace traffic per month (160 GiB total), with a 100 GiB Full-Stack included trace volume. Trace data from full-stack monitored sources that exceeds the included volume is billed via Traces – Ingest & Process.
The volumes in this scenario are idealized monthly averages. In practice, ATM adjusts the per-agent rate limit every 15 minutes, so ingest can briefly overshoot before being corrected. Over a full billing period, actual adaptive ingest converges toward—and might slightly exceed—the usable adaptive trace volume.
Each of the following steps builds on the previous one to demonstrate a possible real-world example of how the volume and billing react to sampling configurations.
Step 1: Default - no configuration changes
All namespaces use adaptive sampling at the default rate factor of 1x. No extended ingest or fixed-rate sampling is configured. ATM distributes the 100 GiB of usable adaptive trace volume equally, giving each namespace ~25 GiB (~62.5% capture rate). The total ingested volume exactly matches the included volume.
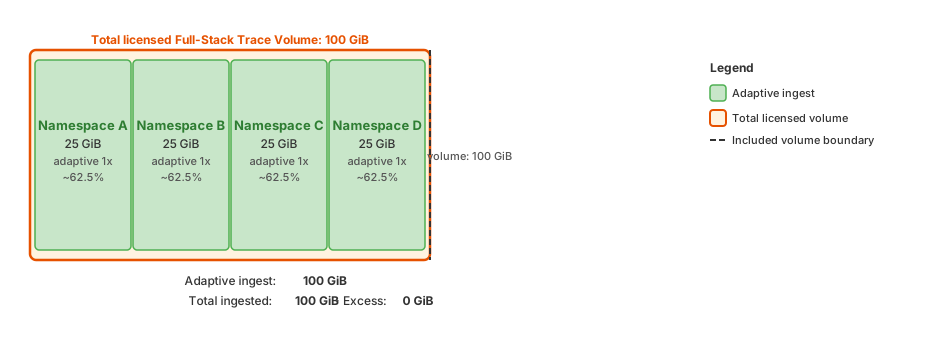
Detailed breakdown
Per-namespace impact:
- Namespace A: Rate factor 1x, capture rate ~62.5%, ingested 25 GiB
- Namespace B: Rate factor 1x, capture rate ~62.5%, ingested 25 GiB
- Namespace C: Rate factor 1x, capture rate ~62.5%, ingested 25 GiB
- Namespace D: Rate factor 1x, capture rate ~62.5%, ingested 25 GiB
Billing summary:
- Total ingested: 100 GiB
- Full-Stack included trace volume: 100 GiB
- Excess billed to Traces – Ingest & Process: 0 GiB
Step 2: Extend ingest by 1.2x
The extended ingest factor increases the total licensed Full-Stack trace volume to 120 GiB. All namespaces benefit equally, each capturing 30 GiB (~75% capture rate). The 20 GiB above the 100 GiB of the included trace volume is billed as the fullstack-adaptive licensing type via Traces – Ingest & Process.
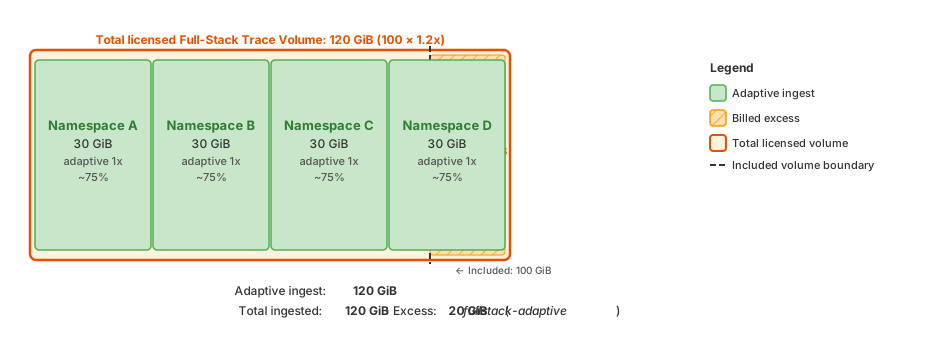
Detailed breakdown
Per-namespace impact:
- Namespace A: Rate factor 1x, capture rate ~75%, ingested 30 GiB
- Namespace B: Rate factor 1x, capture rate ~75%, ingested 30 GiB
- Namespace C: Rate factor 1x, capture rate ~75%, ingested 30 GiB
- Namespace D: Rate factor 1x, capture rate ~75%, ingested 30 GiB
Billing summary:
- Total ingested: 120 GiB
- Full-Stack included trace volume: 100 GiB
- Excess billed to Traces – Ingest & Process: 20 GiB (
fullstack-adaptivelicensing type)
Step 3: Set adaptive rate factor to 20x for Namespace A
Namespace A now receives a much larger share of the adaptive budget and saturates at its full 40 GiB potential (~100% capture rate). The remaining 80 GiB is distributed among Namespace B, C, and D, each capturing ~66.7% (~26.7 GiB). The total ingested volume stays at 120 GiB, so the excess remains 20 GiB.
The adaptive rate factor is a relative weight for dividing the usable adaptive trace volume, not a target capture rate, and it can never claim more traces than a scope actually produces. So any factor above the point where Namespace A reaches 100% capture produces the same result. Setting it generously has no downside and keeps Namespace A prioritized when the adaptive volume or the set of competing scopes changes, as Step 5 demonstrates.
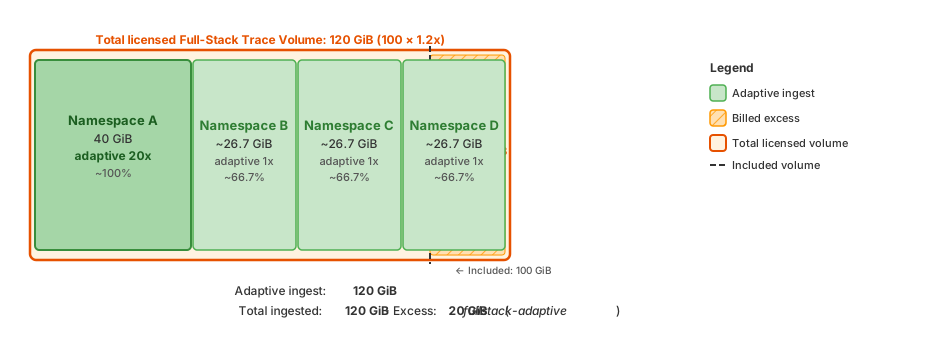
Detailed breakdown
Per-namespace impact:
- Namespace A: Rate factor 20x, capture rate ~100%, ingested 40 GiB
- Namespace B: Rate factor 1x, capture rate ~66.7%, ingested ~26.7 GiB
- Namespace C: Rate factor 1x, capture rate ~66.7%, ingested ~26.7 GiB
- Namespace D: Rate factor 1x, capture rate ~66.7%, ingested ~26.7 GiB
Billing summary:
- Total ingested: 120 GiB
- Full-Stack included trace volume: 100 GiB
- Excess billed to Traces – Ingest & Process: 20 GiB (
fullstack-adaptivelicensing type)
Step 4: Set 100% fixed-rate sampling for Namespace B
Namespace B hosts the most business-critical applications, where 100% trace capture is required regardless of the current adaptive trace sampling rate. With fixed-rate sampling activated, Namespace B captures every trace it initiates (40 GiB). ATM redistributes the 120 GiB adaptive budget among the remaining three namespaces. With Namespace A saturating at 40 GiB, the remaining 80 GiB covers Namespace C and D exactly (~100% each). Total ingest rises to 160 GiB. The 60 GiB above the included volume is split proportionally: 45 GiB as the fullstack-adaptive licensing type and 15 GiB as the fullstack-fixed-rate licensing type.
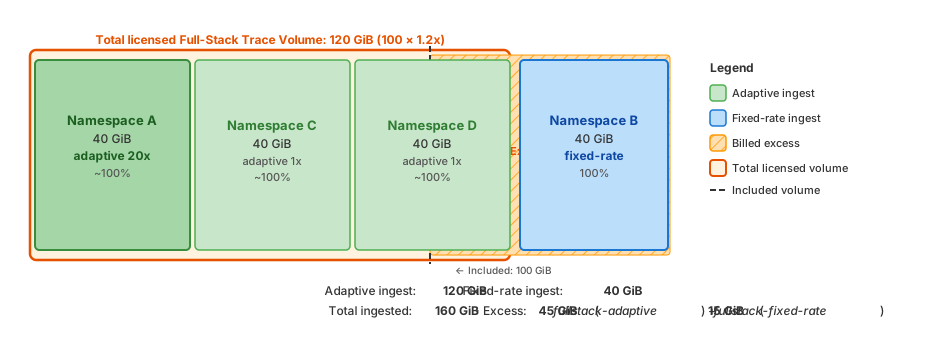
Detailed breakdown
Per-namespace impact:
- Namespace A: Rate factor 20x, capture rate ~100%, ingested 40 GiB (adaptive)
- Namespace B: Fixed rate 100%, capture rate 100%, ingested 40 GiB (fixed-rate)
- Namespace C: Rate factor 1x, capture rate ~100%, ingested 40 GiB (adaptive)
- Namespace D: Rate factor 1x, capture rate ~100%, ingested 40 GiB (adaptive)
Billing summary:
- Ingested adaptive trace volume: 120 GiB (Namespace A/C/D)
- Ingested fixed-rate trace volume: 40 GiB (Namespace B)
- Total ingested: 160 GiB
- Full-Stack included trace volume: 100 GiB
- Excess billed to Traces – Ingest & Process: 60 GiB
- 45 GiB as
fullstack-adaptivelicensing type (120/160 × 60) - 15 GiB as
fullstack-fixed-ratelicensing type (40/160 × 60)
- 45 GiB as
Step 5: Reduce usable adaptive trace volume to 50%
Full visibility is now guaranteed for the business-critical applications in Namespace B, at a cost of 60 GiB above the Full-Stack included trace volume. To keep that visibility while returning to the included volume, reduce the usable adaptive trace volume to 50%. The adaptive budget drops from 120 GiB to 60 GiB. Namespace A still saturates at 40 GiB, leaving 10 GiB each for Namespace C and D (25% capture rate). Namespace B remains at 100% fixed-rate (40 GiB). The total ingest is 100 GiB (60 GiB + 40 GiB), matching the included trace volume exactly, with no excess billing.
Note that the extended ingest factor (1.2x) is still configured, so the total licensed volume remains at 120 GiB. This is a transitional state, and you may still want to keep it active for peak traffic periods. After observing stable billing, review your extended ingest, adaptive, and fixed-rate ingest configuration to find the right balance.
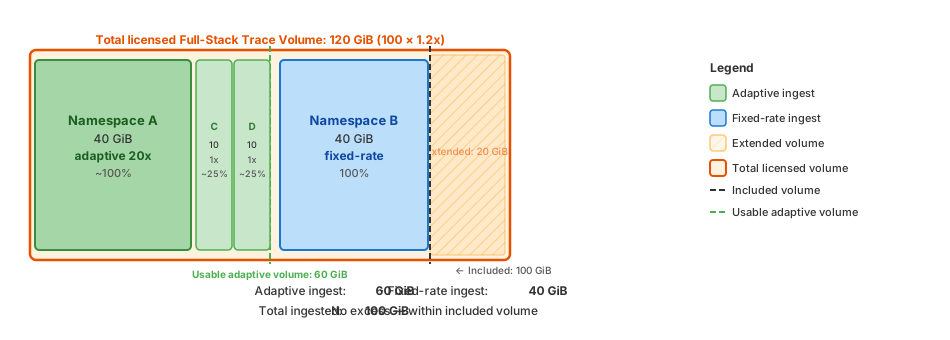
Detailed breakdown
Per-namespace impact:
- Namespace A: Rate factor 20x, capture rate ~100%, ingested 40 GiB (adaptive)
- Namespace B: Fixed rate 100%, capture rate 100%, ingested 40 GiB (fixed-rate)
- Namespace C: Rate factor 1x, capture rate 25%, ingested 10 GiB (adaptive)
- Namespace D: Rate factor 1x, capture rate 25%, ingested 10 GiB (adaptive)
Billing summary:
- Ingested adaptive trace volume: 60 GiB (Namespace A/C/D)
- Ingested fixed-rate trace volume: 40 GiB (Namespace B)
- Total ingested: 100 GiB
- Full-Stack included trace volume: 100 GiB
- Total licensed Full-Stack trace volume: 120 GiB (extended ingest still active)
- Excess billed to Traces – Ingest & Process: 0 GiB
Adjust adaptive trace sampling rate
Use this feature to adjust the adaptive trace sampling rate at the following scopes: environment, host group, Kubernetes cluster, Kubernetes namespace, Kubernetes deployment, or process group. This allows you to control the usage of the Full-Stack included trace volume at a settings scope level. The rate factor affects traces that are initiated within the selected scope. For details, see Where sampling rules take effect. The setting applies to processes monitored by OneAgent; trace ingestion via Envoy or Istio doesn't account for it yet.
- Typically, Adaptive Traffic Management distributes the usable adaptive trace volume equally to all OneAgents. It achieves this by adjusting the adaptive trace sampling rate every 15 minutes, ensuring that the overall ingested trace data volume remains roughly within the usable adaptive trace volume.
- With trace ingest control, you can adjust the adaptive trace sampling rate of OneAgents so that they capture traces at a higher or lower rate than normal. This results in a higher trace capture rate for targeted parts of your system. Consequently, Adaptive Traffic Management might lower the adaptive trace sampling rate overall on average, ensuring that the overall ingested trace data volume remains roughly within the usable adaptive trace volume.
This control is available via the Settings API. It will also soon be available directly in  Settings.
To adjust the adaptive trace sampling rate, use the Trace ingest control schema provided by the Settings API. The following is the general guidance for this setting.
- Set
schemaIdtobuiltin:trace.ingest.control. - Set
scopeto the meaningful value, for example, to theHOST_GROUP-1A2B3C4D5E6F7G8Hentity ID. - Use the Settings API - GET objects endpoint to find or create
objectIdfor the settings object. - Set
adaptiveSamplingSwitchtotrue. - Set
adaptiveTraceIngestRateFactorto a factor between0.01and100to indicate that you want the trace capture rate to be 1/100th of normal (0.01) or 100x of normal (100) rate.
adaptiveTraceIngestRateFactor is only evaluated when adaptiveSamplingSwitch is true. When adaptiveSamplingSwitch is false, the scope uses fixed-rate sampling and only fixedSamplingRate is evaluated.
For step-by-step details on using the Settings API, see Example 3 and Example 4 in the use cases section.
Reduce usable adaptive trace volume
Dynatrace enables you to control how much of your total licensed Full-Stack trace volume is allocated to Adaptive Traffic Management as usable adaptive trace volume.
This self-service capability lets you reduce the usable adaptive trace volume when full capacity isn't needed. Common use cases include lowering adaptive usage, extending the amount of trace data for major events, reserving part of the licensed Full-Stack trace volume for fixed-rate sampled spans from OpenTelemetry or OneAgent, or better self-servicing your trace volume after requesting extended ingest.
Overall, this control gives you greater flexibility to manage ingested trace data effectively.
This control is available via the Settings API from Dynatrace version 1.332+. It will also soon be available directly in Settings. Note that the Dynatrace version (the platform/cluster version) and the OneAgent version (the agent build number) are independently versioned. Verify each against the respective version in your environment.
To adjust the usable adaptive trace volume, use the Global trace ingest rate control schema provided by the Settings API. The following is the general guidance for this setting.
- Set
schemaIdtobuiltin:global.trace.ingest.control. - Set
scopetoenvironment, as this is an environment-wide setting only. - Set
usableAdaptiveTraceVolumePercentageto a value between1and100.
For the instructions on using the Settings API, see Example 5 and Example 6 in the use cases section.
Configure fixed-rate sampling Early Access
With fixed-rate sampling, you can set a fixed trace capture rate for a scope, bypassing Adaptive Traffic Management for traces initiated within that scope—that is, for root spans. OneAgents monitoring services that participate in a trace started outside the scope continue to follow the original sampling decision, so configure the scope to match the entry point of the traces you want to control. For details, see Where sampling rules take effect. This is useful when you need a guaranteed or predictable capture rate, for example, for regulatory, auditing, fraud detection, or supportability requirements.
Fixed-rate sampling requires OneAgent version 1.339+ across the environment and is highly recommended to ensure consistent billing. Fixed-rate sampling applies to processes monitored by OneAgent. Trace ingest via Envoy or Istio doesn't take it into account yet.
Currently, you can configure fixed-rate sampling via the Settings API. Soon, it will also be available directly in Settings.
Configuring fixed-rate sampling on the environment scope isn't available for all environments. Because a fixed rate applied environment-wide can produce high trace ingest volumes, fixed-rate sampling is automatically activated only for environments that ingest less than 2 TiB of trace data per day. If you need to set fixed-rate sampling on the environment scope and don't see the corresponding option, contact your Dynatrace representative.
When fixed-rate sampling is activated for a scope, OneAgents within that scope independently sample each trace at the configured rate. The sampling decision is propagated to all downstream OneAgents via the trace context header, ensuring that the entire distributed trace follows the fixed sampling decision regardless of where it continues.
Trace volume and billing impact
Fixed-rate sampled spans still consume your Full-Stack included trace volume. Only the portion of the ingested trace volume that exceeds the included volume is billed as Traces – Ingest & Process, with the fullstack-fixed-rate licensing type.
Fixed-rate sampled spans are not counted against the usable adaptive trace volume, and Adaptive Traffic Management ignores them when adjusting the adaptive trace sampling rate. Therefore, activating fixed-rate sampling for one scope doesn't lower the capture rate of scopes that rely on adaptive capture.
To manage your trace budget when activating fixed-rate sampling for a high-traffic scope, consider reducing the usable adaptive trace volume to reserve more of the Full-Stack included trace volume for fixed-rate sampled spans.
Configure fixed-rate sampling via API
To configure fixed-rate sampling for a scope, use the Trace ingest control schema provided by the Settings API:
- Set
schemaIdtobuiltin:trace.ingest.control. - Set
scopeto the relevant entity ID (for example,CLOUD_APPLICATION_NAMESPACE-1A2B3C4D5E6F7G8Hfor a Kubernetes namespace, orHOST_GROUP-1A2B3C4D5E6F7G8Hfor a host group). - Set
adaptiveSamplingSwitchtofalseto deactivate Adaptive Traffic Management for this scope. - Set
fixedSamplingRateto a value from0(100% capture) through7(~0.78% capture). Each increment halves the capture rate (for example,0= 100%,1= 50%,2= 25%).
For configuration walkthroughs, see Example 7 and Example 8.
Adjust trace sampling for HTTP or RPC requests
HTTP and gRPC sampling rules apply to OneAgent-monitored processes only. Envoy traces that participate in Adaptive Traffic Management via the Dynatrace sampler are subject to the environment-wide adaptive trace sampling rate but are not affected by these per-request rules.
When you increase or decrease the sampling frequency of HTTP or RPC requests, these requests are captured more or less often relative to other request types.
- OneAgent version 1.331+ Reduction rules are always applied independent of the current OneAgent capture rate or adaptive trace sampling rate. This approach reduces trace volume more effectively, making it available for higher‑priority requests.
- OneAgent version 1.329 and earlier Reduction rules generally affect sampling only when the OneAgent module initiating the distributed trace captures less than 100% of traces.
Effect of tracing deactivation on capture rate
Modifying trace sampling for HTTP or RPC requests does not change the overall capture rate for the process or the overall ingested trace data volume. However, if you deactivate tracing for specific HTTP and RPC requests, the capture rate is increased.
In all environments, there are transactions for which traces are of lower value. You can turn off tracing for specific HTTP and RPC requests completely at any time, freeing up trace volume for more important requests. This feature removes those traces completely from the capture rate calculation (they are no longer considered when computing the capture rate) and therefore leads to an overall increase in capture rate. Deactivation rules always take effect regardless of the current OneAgent capture rate.
OneAgent trace selection logic
Adaptive Traffic Management assigns each process the adaptive trace sampling rate. When this sampling rate is lower than needed for a 100% trace capture rate, OneAgent decides which traces to capture while staying within the configured rate and the usable adaptive trace volume.
To do this, OneAgent groups requests by signature (for example, URI or RPC endpoint) and computes a list of top requests for each process every minute. Based on that list and on any HTTP and RPC trace sampling rules you configure, OneAgent applies capture factors so that:
- Most traces of unique and rare requests are captured.
- Highly frequent or lower-importance requests are captured at a proportionally lower rate.
This ensures that you use your trace volume most effectively. As the sampling is not random, important data is captured while maintaining a statistically valid sample set.
Example
The following table illustrates how different URIs can be captured at different rates while respecting the overall capture rate for a process.
| Request | Number of requests processed by the application, per minute | Capture factor | Captured end-to-end distributed traces, per minute |
|---|---|---|---|
URI A | 900 | 1/2 | 450 |
URI B | 440 | 1/2 | 220 |
URI C | 250 | 1 | 250 |
URI D | 60 | 1 | 60 |
…50 other URIs | 100 | 1 | 100 |
Total | 1750 | 1080 |
In this example, OneAgent observes 1,750 HTTP requests per minute but captures traces for about 1,080 of them. Lower-volume URIs (C, D, and the other URIs) are fully captured, while the most frequent URIs (A and B) are captured at half the rate. The total number of captured traces still respects the capture rate that Adaptive Traffic Management has assigned to the process.
Prerequisites
- For HTTP request trace sampling: OneAgent version 1.281+
- For RPC request trace sampling: OneAgent version 1.307+
Available configuration scopes
You can configure web request trace sampling for the following configuration scopes: environment, host group, process group, Kubernetes cluster, and Kubernetes namespace.
-
Any Dynatrace version For all traces in your environment.
-
Dynatrace version 1.312+ For traces started within a particular host group, process group, Kubernetes cluster, or Kubernetes namespace. This is useful if you don't have environment permissions or want to modify trace sampling for a particular part of your environment.
1. Navigate to trace sampling configuration page
Navigate to the trace sampling configuration page depending on the entity for which you want to modify the sampling frequency of HTTP or RPC requests.
Environment
-
Go to the trace sampling configuration page.
- Latest Dynatrace: Go to Settings > Collect and capture > Distributed tracing > Trace sampling for HTTP requests or Trace sampling for RPC requests.
- Dynatrace Classic: Go to Settings > Server-side service monitoring > Trace sampling for HTTP requests or Trace sampling for RPC requests.
- Latest Dynatrace: Go to
Host group
-
Go to
 Deployment Status > OneAgents.
 -
On the OneAgent deployment page, turn off Show new OneAgent deployments.
-
In the Filter by field, enter Host group, and then select the host group you want to configure from the dropdown list.
The host list is now filtered by the selected host group. Each listed host has a Host group:
<group name>link, where<group name>is the name of the host group that you want to configure.The Host group property is not displayed when the selected host doesn't belong to any host group.
-
Select the host group name in any row.
As you have filtered by host group, all displayed hosts go to the same host group.
-
Navigate to the trace sampling configuration page.
- Latest Dynatrace: Close the host group settings overlay, and go to Collect and capture > Distributed tracing > Trace sampling for HTTP requests or Trace sampling for RPC requests.
- Dynatrace Classic: From the navigation menu on the left, select Trace sampling for HTTP requests or Trace sampling for RPC requests.
Process group
Dynatrace Classic and Latest Dynatrace
-
Go to
 Technologies & Processes Classic and choose a technology.
Alternatively, go to
 Hosts Classic and choose a host.
 -
Find and select the required process group.
-
In the upper-right corner of the process group overview page, select Settings.
-
Select Trace sampling for HTTP requests or Trace sampling for RPC requests.
Kubernetes cluster or namespace
Latest Dynatrace
- Go to
 Kubernetes.
 - Select Clusters or Namespaces.
- Find and select the required Kubernetes cluster or namespace.
- In the upper-right corner of the cluster or namespace pane, select (Actions menu) > Service detection settings.
- Go to Collect and capture > Distributed tracing > Trace sampling for HTTP requests or Trace sampling for RPC requests.
Dynatrace Classic and Latest Dynatrace
- Go to
 Kubernetes Classic.
 - Find and select the required Kubernetes cluster.
- Go to the cluster or namespace settings page.
- Cluster: In the upper-right corner of the cluster overview page, select More (…) > Settings.
- Namespace: Find and select the required namespace, and then select More (…) > Settings in the upper-right corner of the namespace overview page.
- Select Trace sampling for HTTP requests or Trace sampling for RPC requests.
1. Modify trace sampling
Adjust the trace sampling for your HTTP or RPC requests.
HTTP request
-
Select Add URL.
-
Choose how to adjust the trace sampling.
- To never capture traces for the URL, regardless of the available trace volume, turn on Disable tracing for matching HTTP requests.
- To increase or reduce the frequency of trace capture for the specific URL, set Importance of a specific URL to the required scaling factor.
-
To match the HTTP request, do one or a combination of the following:
-
Enter the URL path and select the comparison condition.
Use wildcards (
**) for URL paths with similar segments.For example, in
/api/product/**/detail, all values between slashes are ignored; the path applies to both/api/product/1/detailand/api/product/2/detail. -
Use the query parameters.
- Under Query parameters, select Add item.
- Enter a query parameter name.
- Enter the query parameter value, or turn on Query parameter value is undefined.
-
-
Optional To apply the scaling factor to specific HTTP methods, turn off Any HTTP method, and select the required HTTP methods.
-
Select Save changes.
RPC request
-
Select Add RPC.
-
Choose how to adjust the trace sampling.
- To never capture traces for the RPC, regardless of the available trace volume, turn on Disable tracing for matching RPC requests.
- To increase or reduce the frequency of trace capture for the specific RPC, set Importance of a specific RPC to the required scaling factor.
-
Specify the Protocol.
-
To match the RPC request, enter the name and the comparison condition of one or a combination of the following parameters:
- Remote operation name
- Remote service name
- Endpoint name
-
Select Save changes.
Use case examples
Check the examples below to understand how to properly adjust the trace sampling for your HTTP or RPC requests.
Example 1: Reduce capturing of a frequently executed health check request that provides values less than 60 times/minute
The following rule reduces the importance (by a factor of four) of requests that start with _healthz.
- Navigate to the Trace sampling for HTTP requests page for your environment.
- Select Add URL.
- From Importance of a specific URL, select Reduce capturing by factor 4.
- Enter
/_healthzfor the URL path. - From Path comparison condition, select Starts with.
- Turn on Any HTTP method.
- Select Save changes.
Example 2: Never capture an HTTP OPTIONS request on web servers for a process group
The following rule ignores all requests (starting with /) that use OPTIONS as an HTTP method for a selected process group.
- Navigate to the Trace sampling for HTTP requests page for your process group.
- Select Add URL.
- Turn on Ignore a specific URL.
- Enter
/for the URL path. - From Path comparison condition, select Starts with.
- Turn off Any HTTP method.
- From the HTTP method list, turn on OPTIONS.
- Select Save changes.
- Optional Create a new rule for each process group that you want to target.
Example 3: Increase the ingest for a crucial Kubernetes cluster to allow a higher capture rate
-
Navigate to the cluster settings page.
Latest Dynatrace
- Go to Kubernetes.
- Select Clusters, and then find and select the required Kubernetes cluster.
- In the upper-right corner of the cluster pane, select (Actions menu) > Service detection settings.
Dynatrace Classic and Latest Dynatrace
- Go to Kubernetes Classic.
- Find and select the required Kubernetes cluster.
- In the upper-right corner of the cluster overview page, select More (…) > Settings.
- Go to
-
Copy the cluster ID (entity ID) from the settings page URL, for example,
KUBERNETES_CLUSTER-1A2B3C4D5E6F7G8H. -
Use the Settings API - POST an object endpoint to create a new settings object according to the following.
- Set
adaptiveTraceIngestRateFactorto50.
This increases the default trace ingest rate limit 50 times the default, which results in a higher capture rate while the overall trace ingest volume stays within the defined bounds. - Set
adaptiveSamplingSwitchtotrue.
This enables the new control.
[{"schemaId": "builtin:trace.ingest.control","scope": "KUBERNETES_CLUSTER-1A2B3C4D5E6F7G8H","value": {"adaptiveSamplingSwitch": true,"adaptiveTraceIngestRateFactor": 50}}]You should receive a successful response that contains
objectId. - Set
-
Optional Use the Settings API - GET effective values endpoint to verify the settings change.
Example 4: Further decrease the ingest for a less crucial Kubernetes cluster
-
Navigate to the cluster settings page.
Latest Dynatrace
- Go to Kubernetes.
- Select Clusters, and then find and select the required Kubernetes cluster.
- In the upper-right corner of the cluster pane, select (Actions menu) > Service detection settings.
Dynatrace Classic and Latest Dynatrace
- Go to Kubernetes Classic.
- Find and select the required Kubernetes cluster.
- In the upper-right corner of the cluster overview page, select More (…) > Settings.
- Go to
-
Copy the cluster ID (entity ID) from the settings page URL, for example,
KUBERNETES_CLUSTER-H8G7F6E5D4C3B2A1. -
Use the Settings API - GET effective values endpoint to check the value of
adaptiveTraceIngestRateFactor, which is the currently effective adaptive trace ingest rate factor for this scope.The response shows that the adaptive trace ingest rate factor (
adaptiveTraceIngestRateFactor) is already reduced to0.8for this Kubernetes cluster:{"items": [{"origin": "KUBERNETES_CLUSTER-H8G7F6E5D4C3B2A1","value": {"adaptiveSamplingSwitch": true,"adaptiveTraceIngestRateFactor": 0.8}}],"totalCount": 1,"pageSize": 100} -
Use the Settings API - GET objects endpoint to find the settings
objectIdfor your Kubernetes cluster.Add
scopeto thefieldsquery parameter. -
Use the Settings API - PUT an object endpoint to update the existing settings object according to the following.
- Set
adaptiveTraceIngestRateFactorto0.01.
This decreases the trace ingest rate limit to one percent of the default, resulting in a very low capture rate while the overall trace ingest volume stays within the defined bounds. - Set
adaptiveSamplingSwitchtotrue.
This enables the control.
{"value": {"adaptiveSamplingSwitch": true,"adaptiveTraceIngestRateFactor": 0.01}}You should receive a successful response that contains
objectId. - Set
-
Optional Use the Settings API - GET effective values endpoint to verify the updated value of
adaptiveTraceIngestRateFactor.
Example 5: Reduce adaptive usage back to the original volume after requesting 5x extended ingest for major events
-
Use the Settings API - POST an object endpoint to create a new settings object. Use the following configuration:
- Set
usableAdaptiveTraceVolumePercentageto20.
After extending your licensed volume by 5x for major events, reducing the usable adaptive trace volume to 20% afterwards brings it back to the original Full-Stack included trace volume. - Set
scopetoenvironment, as this is an environment-wide setting.
[{"schemaId": "builtin:global.trace.ingest.control","scope": "environment","value": {"usableAdaptiveTraceVolumePercentage": 20}}]You should receive a successful response.
- Set
-
Optional Use the Settings API - GET effective values endpoint to verify the settings change.
Example 6: Reserve volume for fixed-rate sampled spans from OpenTelemetry
-
Use the Settings API - POST an object endpoint to create a new settings object. Use the following configuration:
- Set
usableAdaptiveTraceVolumePercentageto50.
This effectively allows half of your licensed volume for adaptive usage while reserving the other half for fixed-rate sampled spans from OpenTelemetry. - Set
scopetoenvironment, as this is an environment-wide setting.
[{"schemaId": "builtin:global.trace.ingest.control","scope": "environment","value": {"usableAdaptiveTraceVolumePercentage": 50}}]You should receive a successful response.
- Set
-
Optional Use the Settings API - GET effective values endpoint to verify the settings change.
Example 7: Set 100% capture rate for a critical Kubernetes namespace
-
Find the entity ID of the Kubernetes namespace you want to capture at 100%.
Go to the namespace in
Kubernetes and copy the entity ID from the URL or settings page, for example, CLOUD_APPLICATION_NAMESPACE-1A2B3C4D5E6F7G8H. -
Use the Settings API – POST an object endpoint to create a new settings object. Use the following configuration.
- Set
adaptiveSamplingSwitchtofalse. This deactivates Adaptive Traffic Management for traces initiated in this namespace. - Set
fixedSamplingRateto0. This sets the capture rate to 100%, meaning every trace initiated in this namespace is captured.
[{"schemaId": "builtin:trace.ingest.control","scope": "CLOUD_APPLICATION_NAMESPACE-1A2B3C4D5E6F7G8H","value": {"adaptiveSamplingSwitch": false,"fixedSamplingRate": "0"}}]You should receive a successful response that contains
objectId. - Set
-
Optional Use the Settings API – GET effective values endpoint to verify the settings change.
-
Optional Monitor the effect by querying the
trace.capture.reasonsattribute on spans from this namespace. Spans captured via fixed-rate sampling reportfixedas the first value in the array.fetch spans| filter k8s.namespace.name == "my-namespace"| filter isNotNull(trace.capture.reasons)| fields timestamp, trace.capture.reasons, traceid| limit 20
Example 8: Set 25% capture rate for a Kubernetes namespace
-
Find the entity ID of the Kubernetes namespace you want to capture at 25%.
Go to the namespace in
Kubernetes and copy the entity ID from the URL or settings page, for example, CLOUD_APPLICATION_NAMESPACE-1A2B3C4D5E6F7G8H. -
Use the Settings API – POST an object endpoint to create a new settings object. Use the following configuration:
- Set
adaptiveSamplingSwitchtofalse. This disables Adaptive Traffic Management for traces initiated in this namespace. - Set
fixedSamplingRateto2. This sets the capture rate to 25%, meaning every fourth trace initiated in this namespace is captured.
[{"schemaId": "builtin:trace.ingest.control","scope": "CLOUD_APPLICATION_NAMESPACE-1A2B3C4D5E6F7G8H","value": {"adaptiveSamplingSwitch": false,"fixedSamplingRate": "2"}}]You should receive a successful response that contains
objectId. - Set
-
Optional Use the Settings API – GET effective values endpoint to verify the settings change.
Monitor Adaptive Traffic Management and trace data ingest
To monitor your environment trace capture rate and volume ingress, use the Full-Stack Adaptive Traffic Management and trace capture ready-made dashboard.
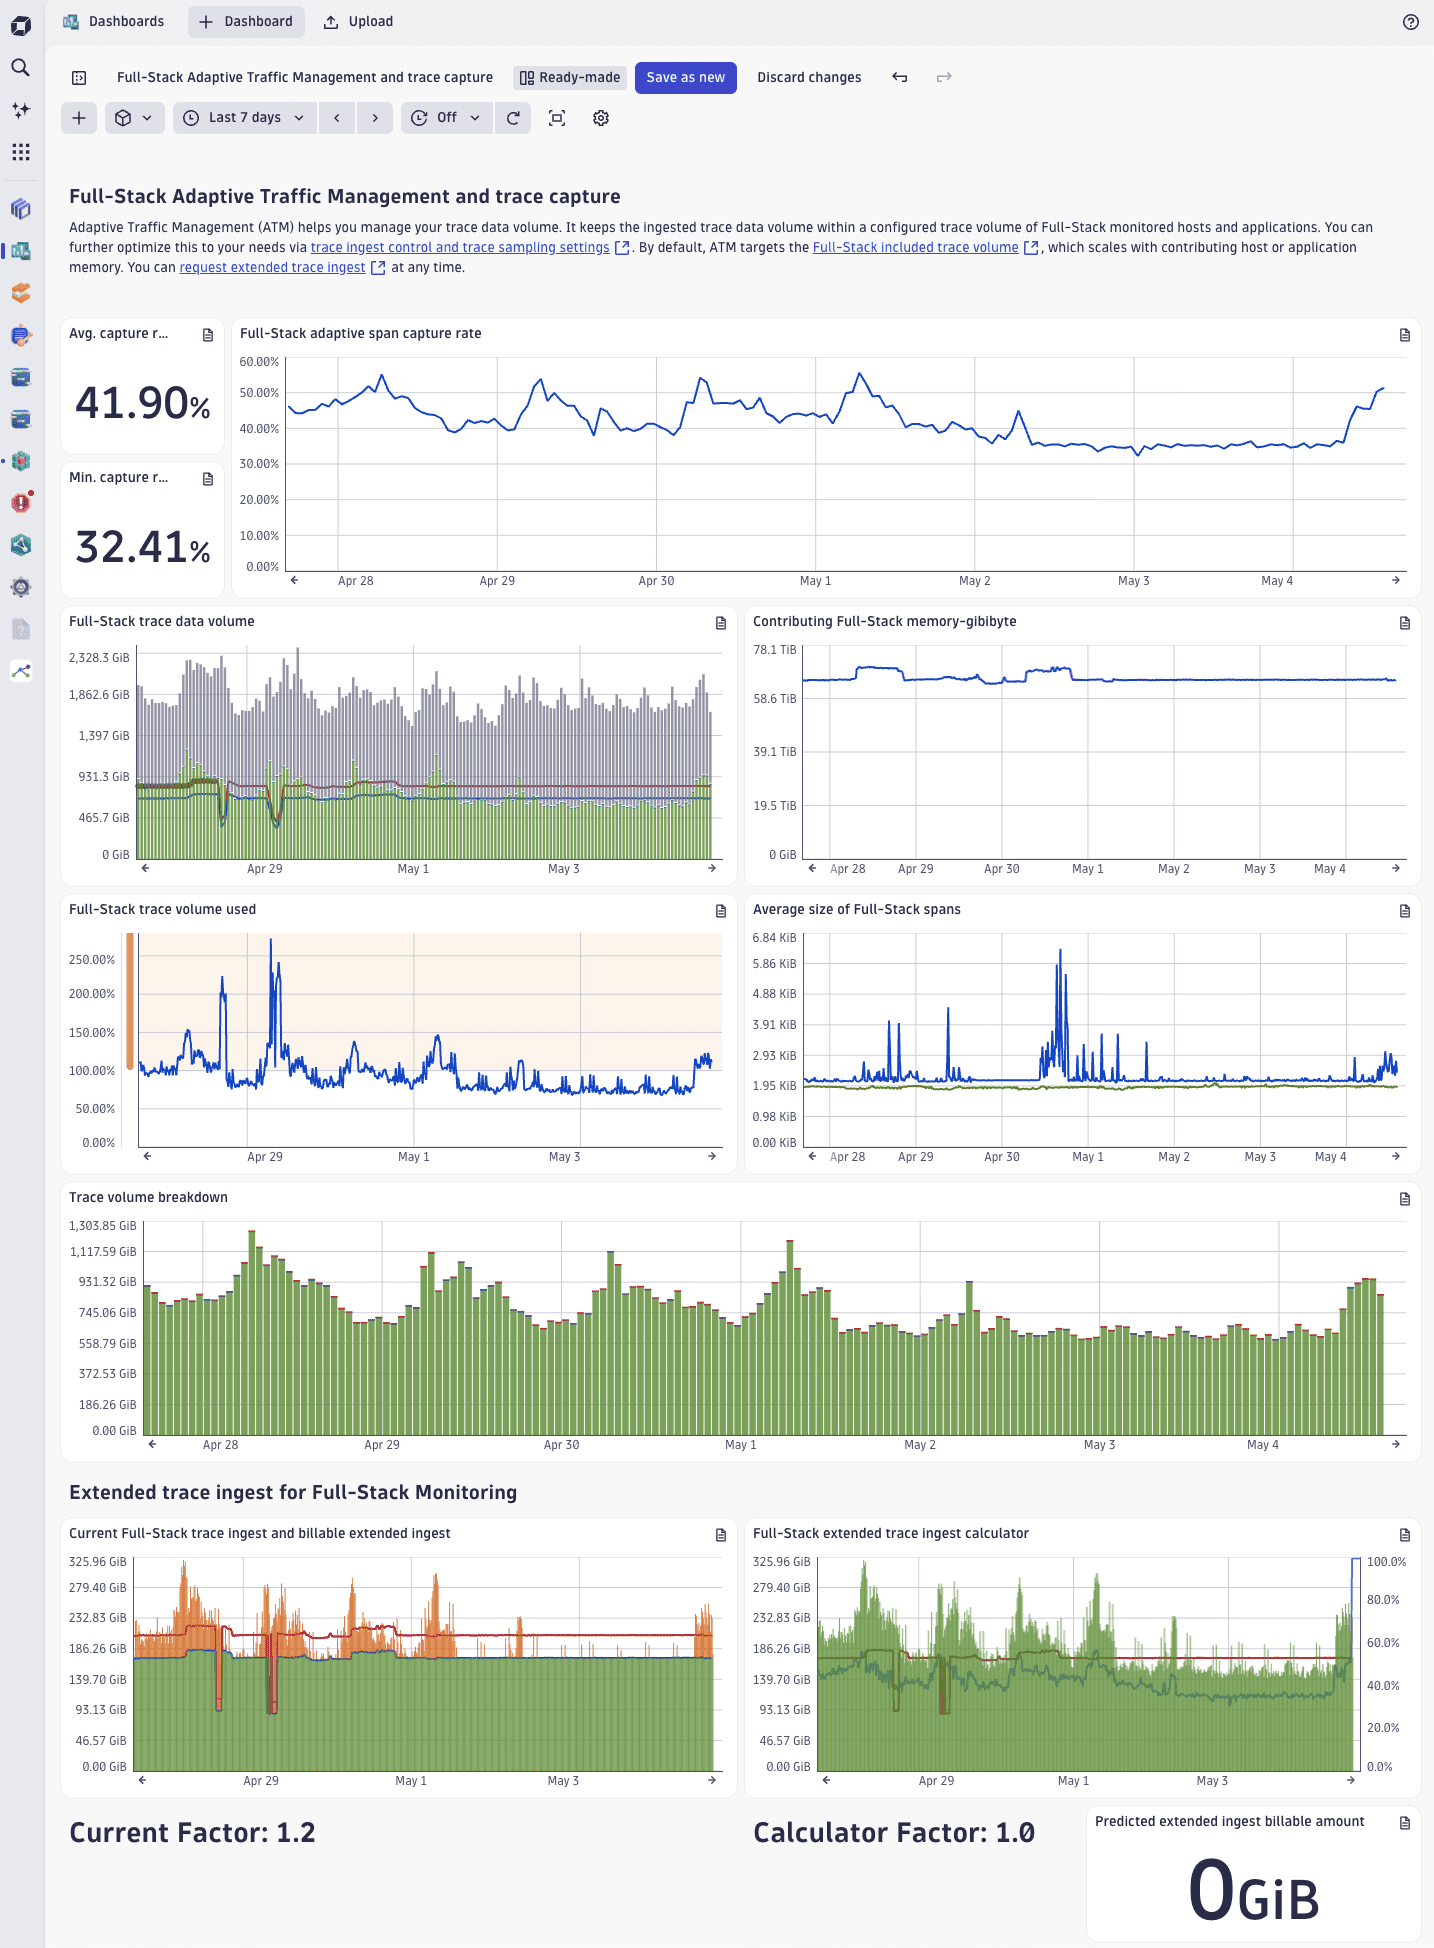
The different dashboard tiles are described in the table below.
| Tile | Description |
|---|---|
Request capture rate | Captured requests, as a percentage of the total number of transactions processed by OneAgent monitored application or host. |
Trace capture rate | Captured traces, as a percentage of the total number of observed end-to-end transactions processed by OneAgent monitored application or host. Note that the trace capture rate might be lower than the request capture rate because a single trace might consist of multiple requests. |
Full-Stack trace data volume | Amount of trace data ingested from full-stack monitored applications or hosts. The chart includes
|
Full-Stack trace volume used | Ingested trace volume, as a percentage of your licensed Full-Stack included trace volume. Adaptive Traffic Management keeps it around the Full-Stack included limit. The algorithm used in Dynatrace accounts for a degree of fluctuation, allowing the used trace volume to exceed 100% without extra charges, unless you opted for Extended trace ingest for Full-Stack Monitoring. |
Average size of Full-Stack spans | Average size of spans ingested from full-stack monitored applications or hosts. Typical values are in the 1.5-2 KiB range; if the span size is larger and the used trace volume is high (or the trace capture rate is low), you might be capturing a lot of data per span. |
Adaptive trace volume per contributing memory-gibibytes per minute | Average trace volume every 15 minutes ( |
Full-Stack trace ingest and billable extended ingest | The relationship between the amount of ingested trace data ( If you opted for Extended trace ingest for Full-Stack Monitoring:
|
FAQ
How does Adaptive Traffic Management affect charts, baselining, and alerting?
Usually not at all.
The shaping of traffic is accounted for transparently and done in a way that ensures statistical validity while capturing rare requests with high probability. All charts and analysis options show the total number of requests that your application processes with high statistical accuracy. You will not see a difference in charts or service call analysis data unless you're looking at a single distributed trace.
Does Adaptive Traffic Management affect service settings or (global) request monitoring settings?
No, Adaptive Traffic Management focuses only on the number of traces. Neither service settings nor (global) request settings are modified by Adaptive Traffic Management. Depending on the capture rate and sampling, a low-volume or unique request might not be captured. Service settings such as request naming rules and key request settings will apply only to captured traces.
Does Adaptive Traffic Management affect service metrics?
Yes, in a few cases, as service monitoring metrics are based on captured traces. The following are some known effects.
- For low-frequency requests in high-volume environments, sampling and a low capture rate can impact the accuracy of metrics. Due to the low frequency of the requests, traces might be captured in a lower volume or not be captured at all. Consequentially some metrics values can't be collected. Note that this is reflected in service metric calculations to avoid distortions in charts.
- Because every single request is accounted for in charts with high resolution and in short timeframes, for high-volume services, sampling and a low capture rate might impact the accuracy of metrics such as request count or error count. Conversely, the accuracy will statistically be better in charts with low resolutions and long timeframes.
What can I do to increase the OneAgent capture rate?
If the OneAgent capture rate is below 100%, sampling has been applied because the number of traces that can be captured by OneAgent has exceeded the Full-Stack included trace volume. There are several things you can do to increase the capture rate:
-
Verify what is currently being captured and reduce the rate for traces and requests of lower relevance. Start by looking at the following:
-
Excessive custom services
Custom services with poor configurations can lead to a high number of requests and increase the trace ingress volume. If custom services are consuming a considerable amount of the trace volume, revisit the configuration to reduce the number of captured custom service calls.
-
Background activity services
In certain environments, background activity produces a lot of service calls but adds little value. To disable this feature on an environment-wide level:
- Latest Dynatrace: Go to Settings > Collect and capture > OneAgent features, and turn off Background Requests for Services (HTTP/GRPC) and Background Requests for Services (Messaging).
- Dynatrace Classic: Go to Settings > OneAgent features, and turn off Background Requests for Services (HTTP/GRPC) and Background Requests for Services (Messaging).
- Latest Dynatrace: Go to
-
High number of low-value traces
In all environments, there are transactions for which traces are of lower value. You can exclude them from capture:
-
Specific transactions, such as ping and health check traces. To disable tracing for specific traces, see Adjust trace sampling for HTTP or RPC requests.
-
Entire processes, such as log forwarders written in a runtime for which deep monitoring by OneAgent is available. To disable tracing for specific traces:
- Latest Dynatrace: Go to Settings > Collect and capture > Distributed tracing > Deep monitoring.
- Dynatrace Classic: Go to Settings > Server-side service monitoring > Deep monitoring.
- Latest Dynatrace: Go to
-
-
Data-heavy features
Data-heavy features can reduce the capture rate. You can:
- Disable bind variables
- Reduce the span size by reducing the number of request attributes or adjusting trace sampling for HTTP or RPC requests to reduce or completely exclude capture of certain transactions.
-
-
Extend the trace ingest as a billed option on top of Full-Stack Monitoring. To learn more, see Extended trace ingest for Full-Stack Monitoring.