Detect problems with Logs
- Latest Dynatrace
- Tutorial
- 8-min read
- Published Oct 08, 2024
Quickly detecting and solving the problems in your environment is crucial to retaining a stable revenue and ensuring the trust of your customers. However, manually analyzing older application or third-party applications where you don't have access to the source code can be time-consuming.
Resolving a problem with Dynatrace drastically accelerates your Mean-time-to-Identify (MTTI) for critical issues, and increases your speed in fixing them before impacting customer experience, thus minimizing impact to your business from outages. By having a single observability platform for all signals, you reduce the risk for human errors from manual correlation of problem details.
Using Dynatrace allows you to avoid looking through all the existing records by showing you only the log lines directly related to the detected problem. This method also allows you to quickly inspect the error details such as message, status, and line of code (LOC) where the error has occurred.
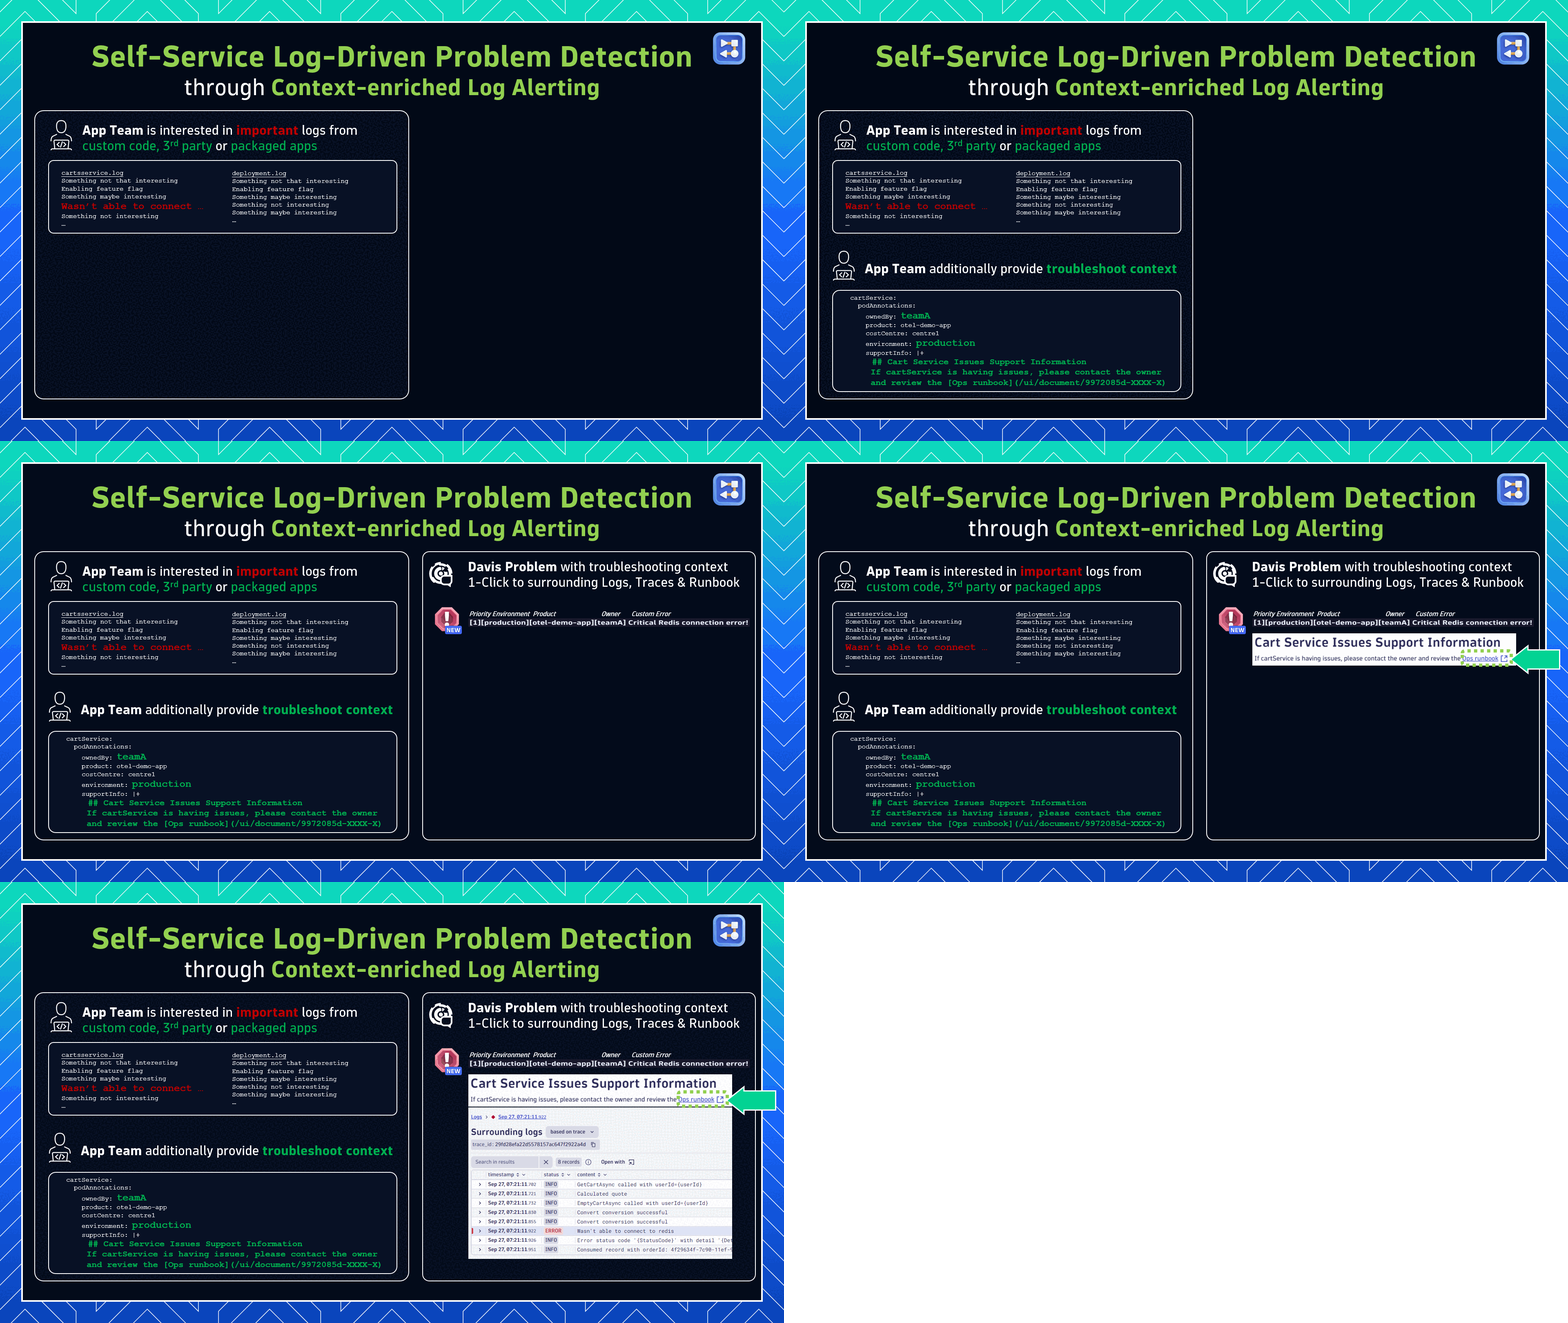
What you will learn
This tutorial will guide you through the process of extracting relevant information from logs through OpenPipeline and accessing logs through the Problems app. It'll show you how to use DQL queries to find information relevant to your problem and get a deeper, more contextual view on the issue with traces.
By the end, you'll know how to
- Enrich logs with additional context as they are collected via OneAgent or OpenTelemetry
- Configure OpenPipeline to extract relevant information from logs and convert it to an event
- Use the Problems app to access relevant log lines
- Find the root cause with the help of logs
The example used in this guideline is taken from Dynatrace Observability Lab: Problem Detection with Logs. For the full experience, you can follow this hands-on demo. It explains the process of problem creation and test environment setup.
Before you begin
Prerequisites
- Access to a Dynatrace SaaS environment
- Access to OpenTelemetry demo or OneAgent
- Installed Problems app
- Set up OpenPipeline ingestion
- Configured OpenPipeline
Steps
This tutorial assumes that you're already monitoring your environment with Dynatrace.

Create a new pipeline for data extraction

Add a dynamic route for the pipeline

Access problems through the Problems app

View Logs through the problem records

View details in Distributed Traces
 Create a new pipeline for data extraction
OpenPipeline is the Dynatrace data handling solution for data processing and ingestion. You can configure OpenPipeline to extract specific information relevant for your case and convert it into an event that can be alerted on. For more information on OpenPipeline processing capabilities, see Processing in OpenPipeline.
To create a new pipeline
-
In Dynatrace, select or press
Ctrl+Kto find and select OpenPipeline. -
Go to Logs, select the Pipelines tab, and select Pipeline.
-
Select and change the pipeline name to
Log Errors. -
Select to save your changes.
-
On the Data extraction tab, select Processor and choose Davis event. This creates a new processor.
-
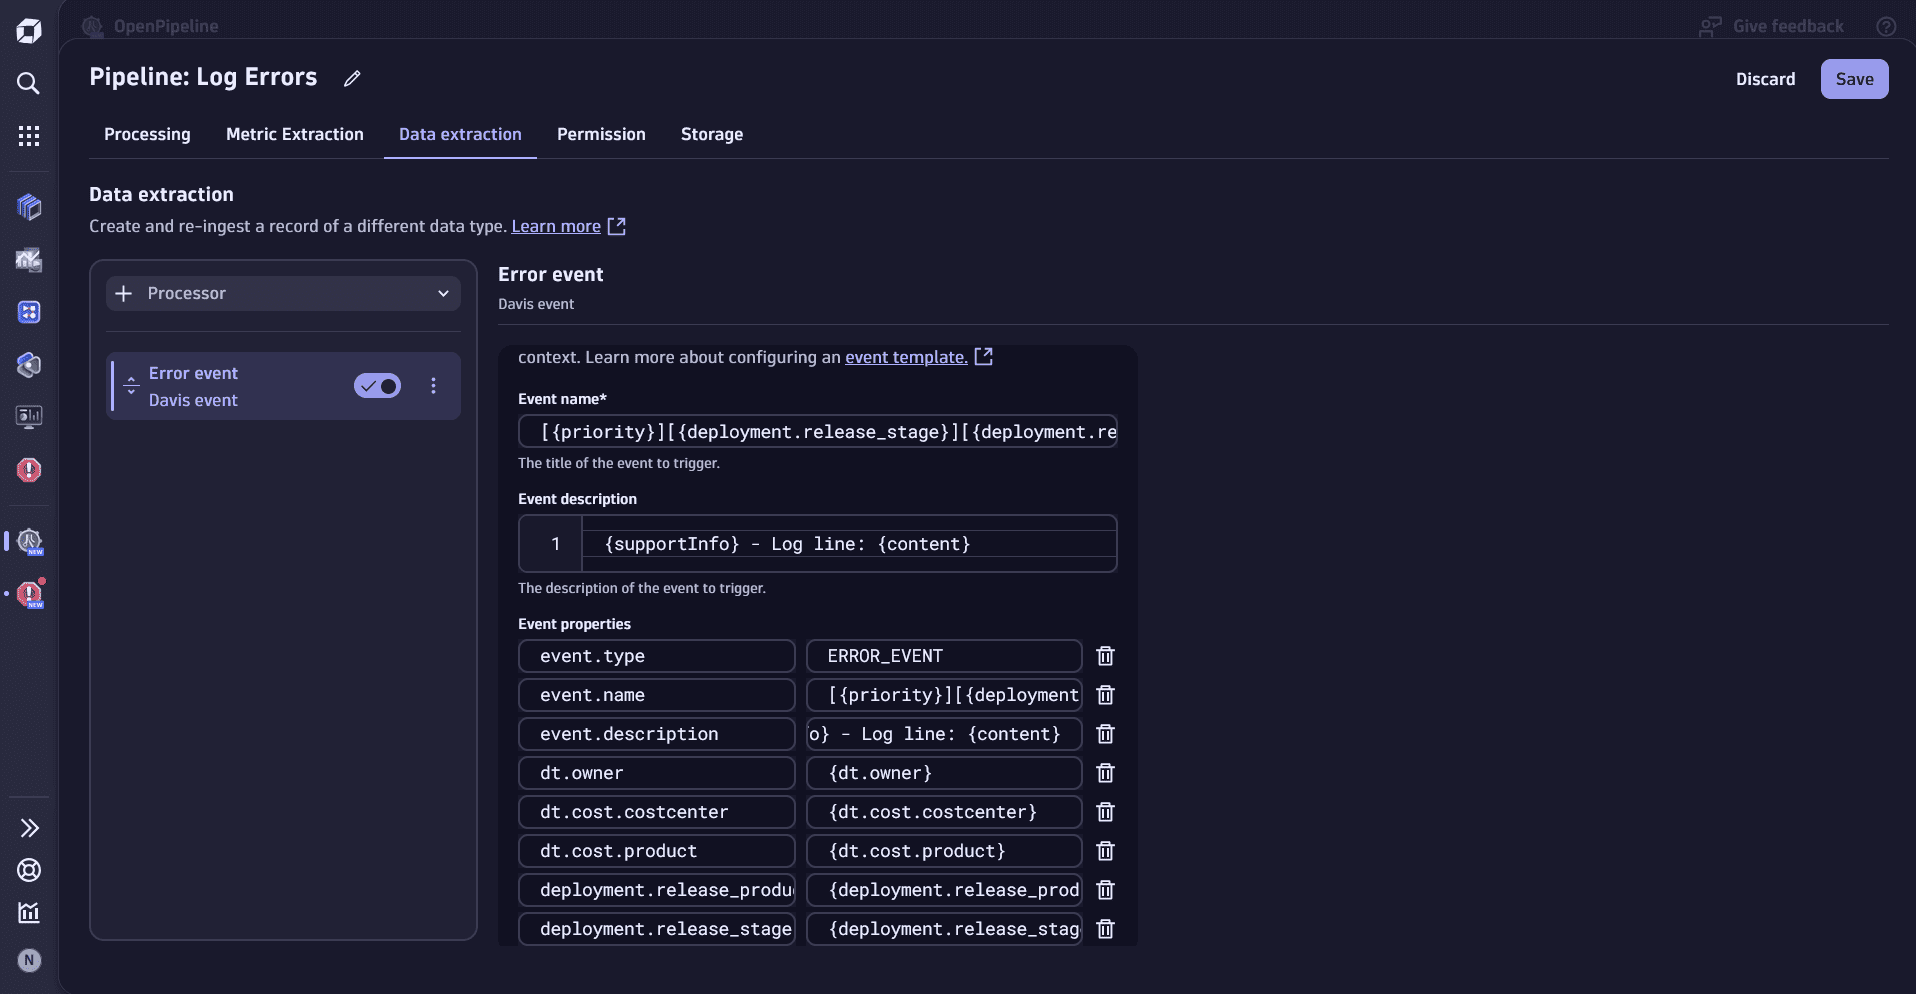
Fill in the required fields. The result should be similar to the example that follows this procedure.
- Set Name to any name you like
- Matching condition should be set to
true - Set Event name to the following:
[{priority}][{deployment.release_stage}][{deployment.release_product}][{dt.owner}] {alertmessage}
- Set Event description to
{supportInfo} - Log line: {content}
-
Set the following Event properties:
Event property Value event.type
ERROR_EVENTdt.owner
{dt.owner}dt.cost.costcenter
{dt.cost.costcenter}dt.cost.product
{dt.cost.product}deployment.release_product
{deployment.release_product}deployment.release_stage
{deployment.release_stage} -
Select Save to save your pipeline.
An example of creating a new Log Error pipeline
 Add a dynamic route for the pipeline
Ingested and extracted data needs to be directed to the pipeline before it's processed. Creating a route is necessary to make sure that your data is directed to the right pipeline, especially in cases where you have multiple pipelines. For more information, see Routing.
To add new dynamic routing
- Go to Logs, select the Dynamic routing tab, and select Dynamic route.
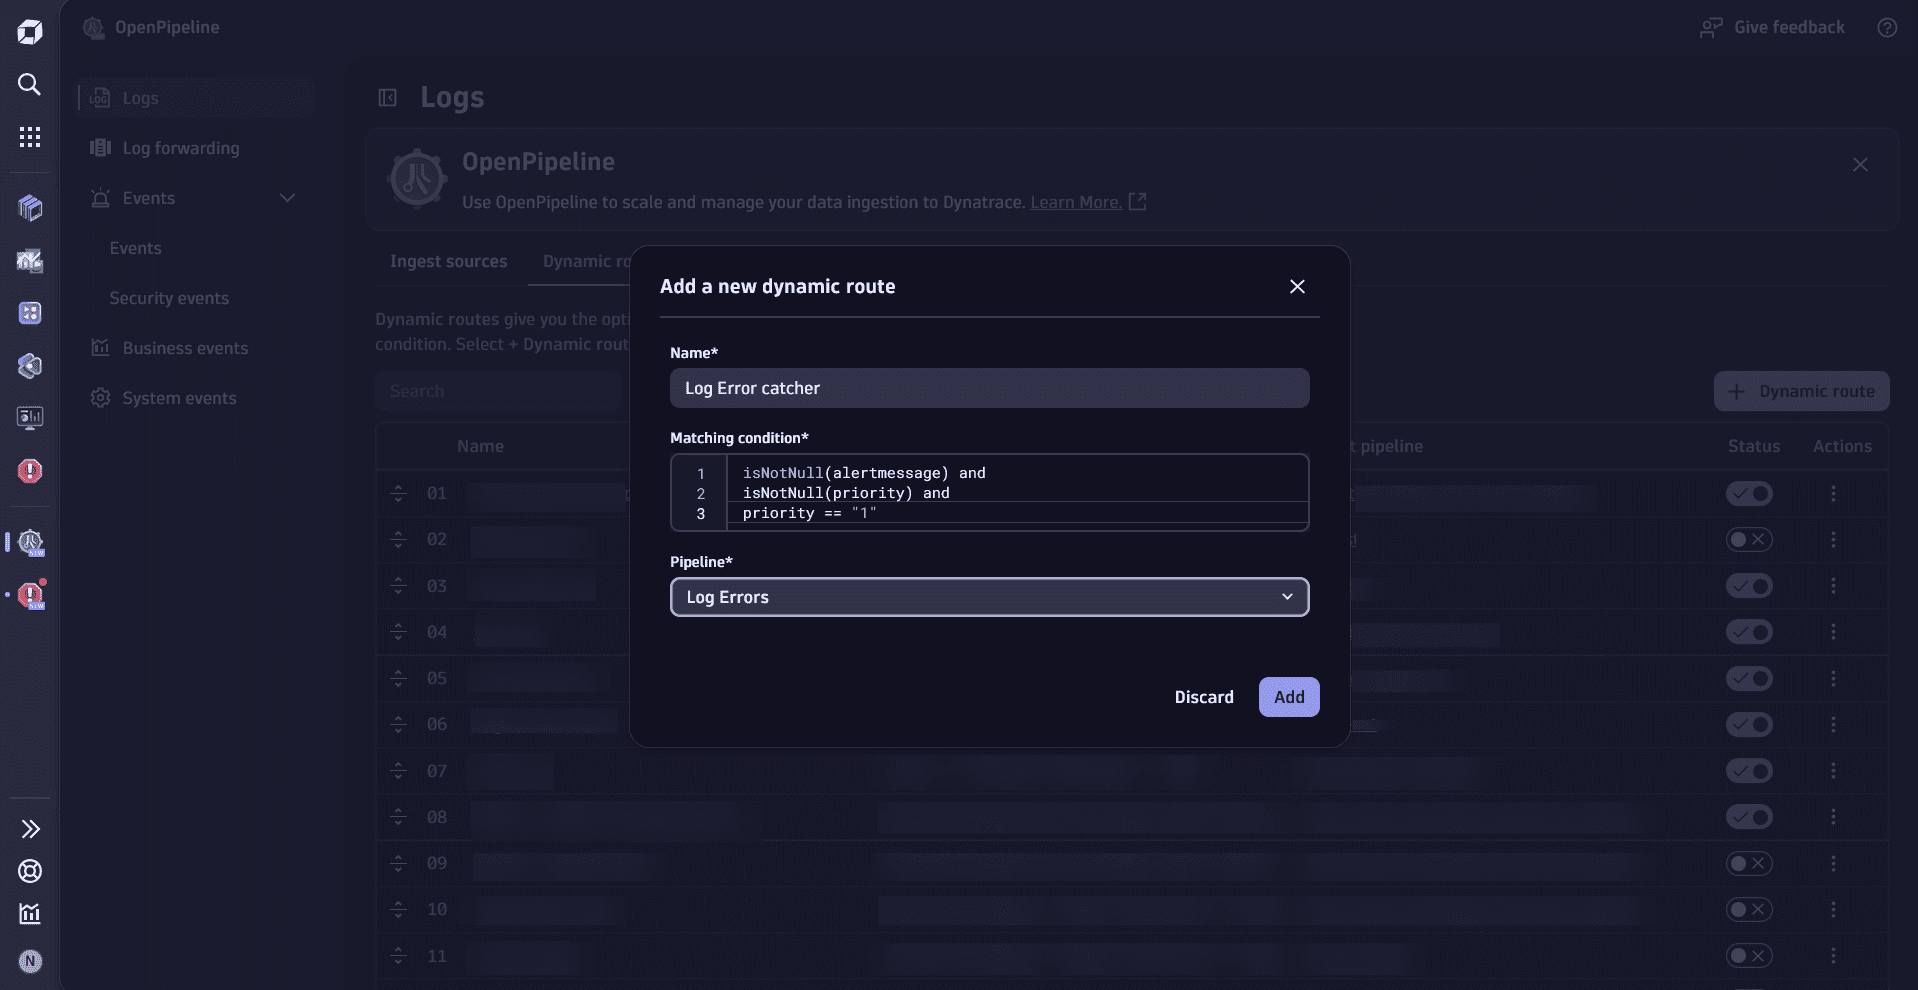
- Fill in the required fields:
- Set Name to any name you like
- Matching condition should be set to
isNotNull(alertmessage) andisNotNull(priority) andpriority == "1"
- Select Add to create a new dynamic route.
An example of creating a new dynamic route for Log Errors pipeline
 Access problems through the Problems app
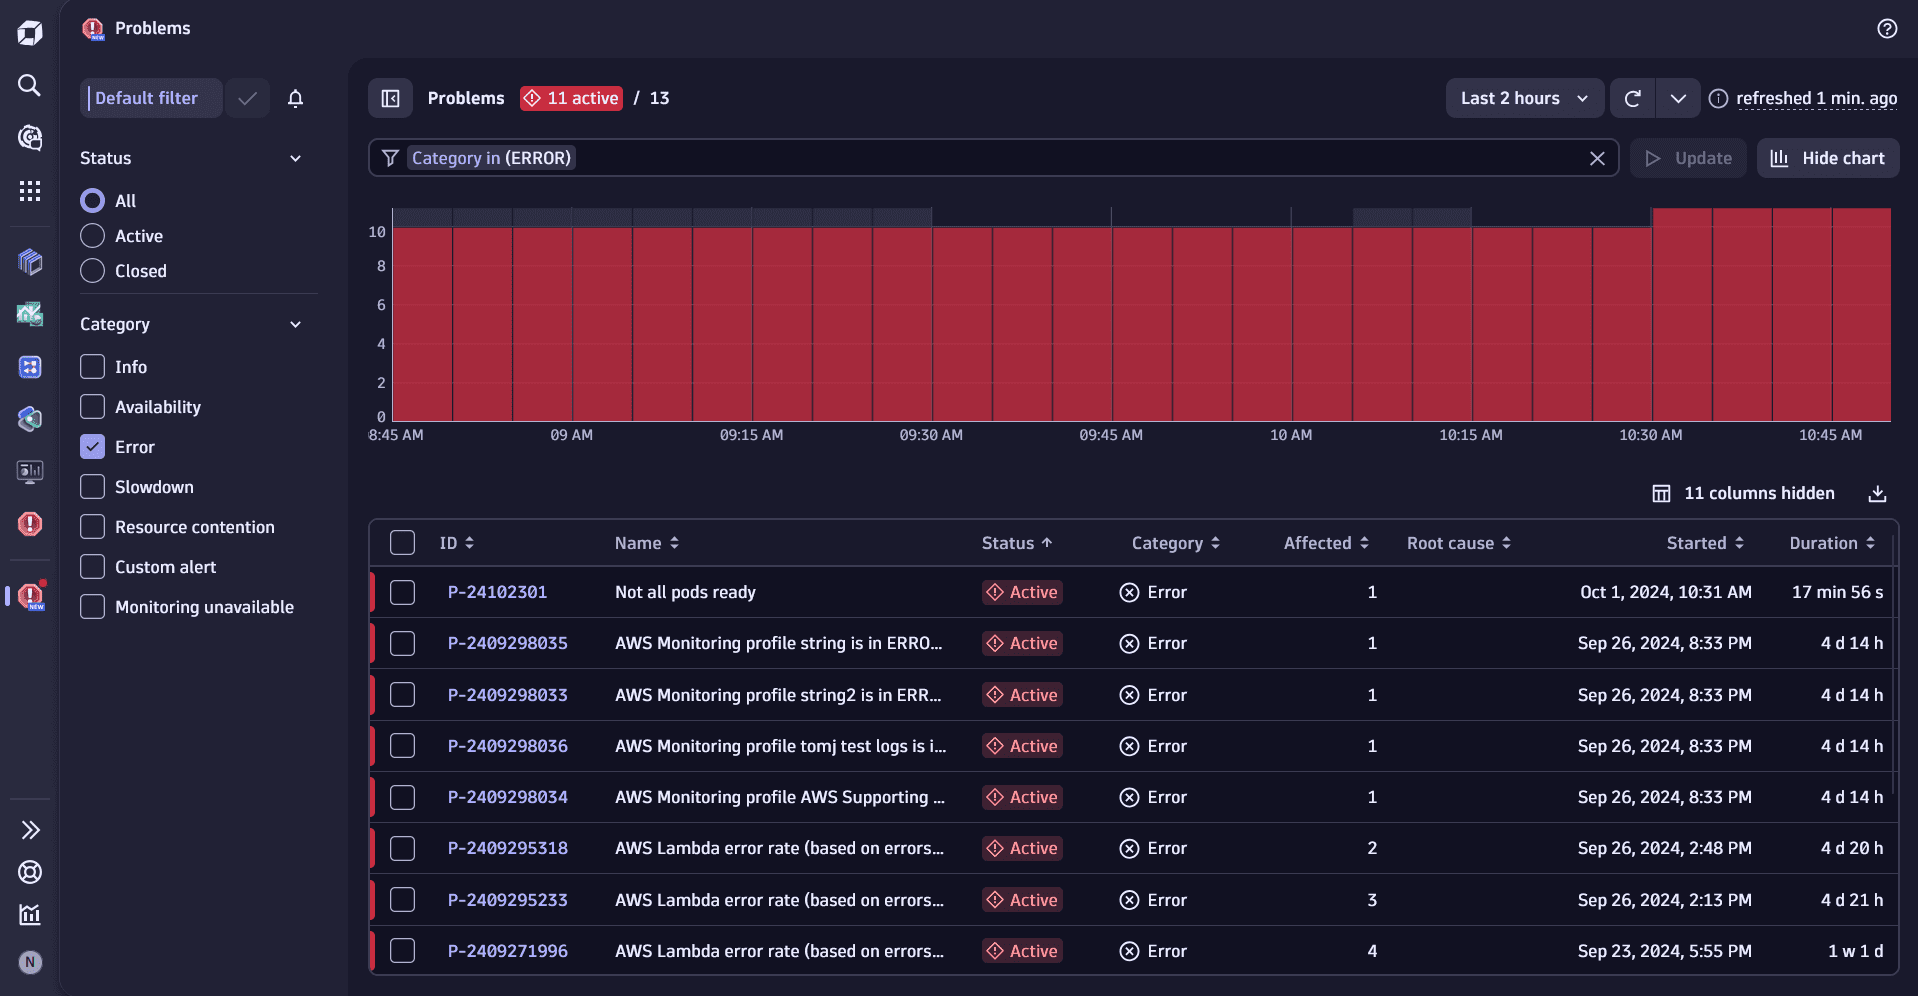
Once the problem is detected and recorded in logs, you can check its status in the Problems app.
The Problems app is a tool designed to help operational and site reliability teams reduce the mean time to repair (MTTR) by presenting every aspect of the incident. For more information, see Problems app.
To access the Problems app
- In Dynatrace, select or press
Ctrl+Kto find and select the Problems app. - Select the open problem ID to see the record. Open problems are listed with a Status of
Active.
 View logs through the problem records
A problem record shows you the number of events, SLOs, affected users, and affected entities. By default, the record shows you the affected deployment and a chart illustrating the problem. You can switch between Chart and Properties, as well as display Deployment, Events, or Logs connected to the problem.
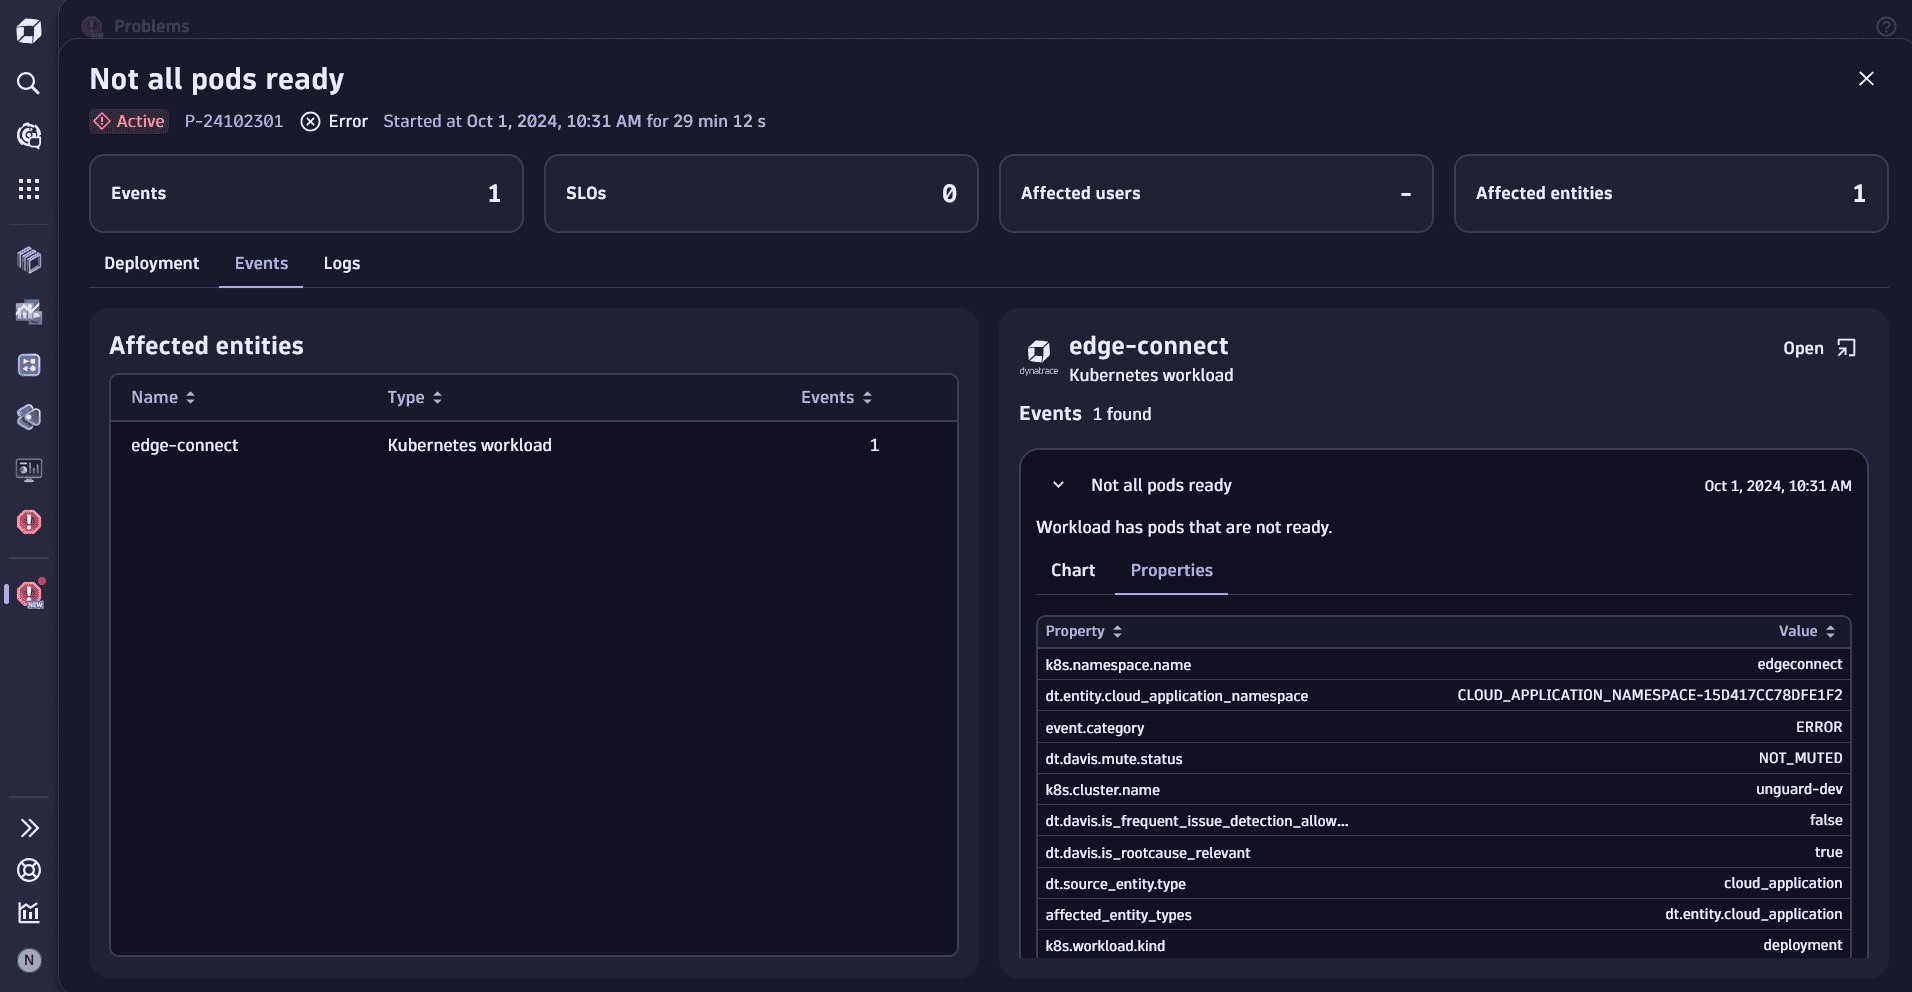
- Select Logs to access logs from the problem record. On the Logs tab, you will see a chart of ingested records and a list of recommended queries that will help you analyze the problem faster.
- Select Run query for
Show x errorswherexis the number of errors recorded for your problem. - Select a log entry you want to expand. An expanded entry provides you with useful metadata like
- Timestamp of the log line
host.namecorresponding to the container nameloglevel(for example,ERROR)- OpenTelemetry or OneAgent
span_idandtrace_id dt.owner, the owner of the componentdt.cost.productanddt.cost.costcentercorresponding to the cost information
Expanded log entry example

- Select Show surrounding logs to see the logs connected to the problem.
Surrounding logs view example
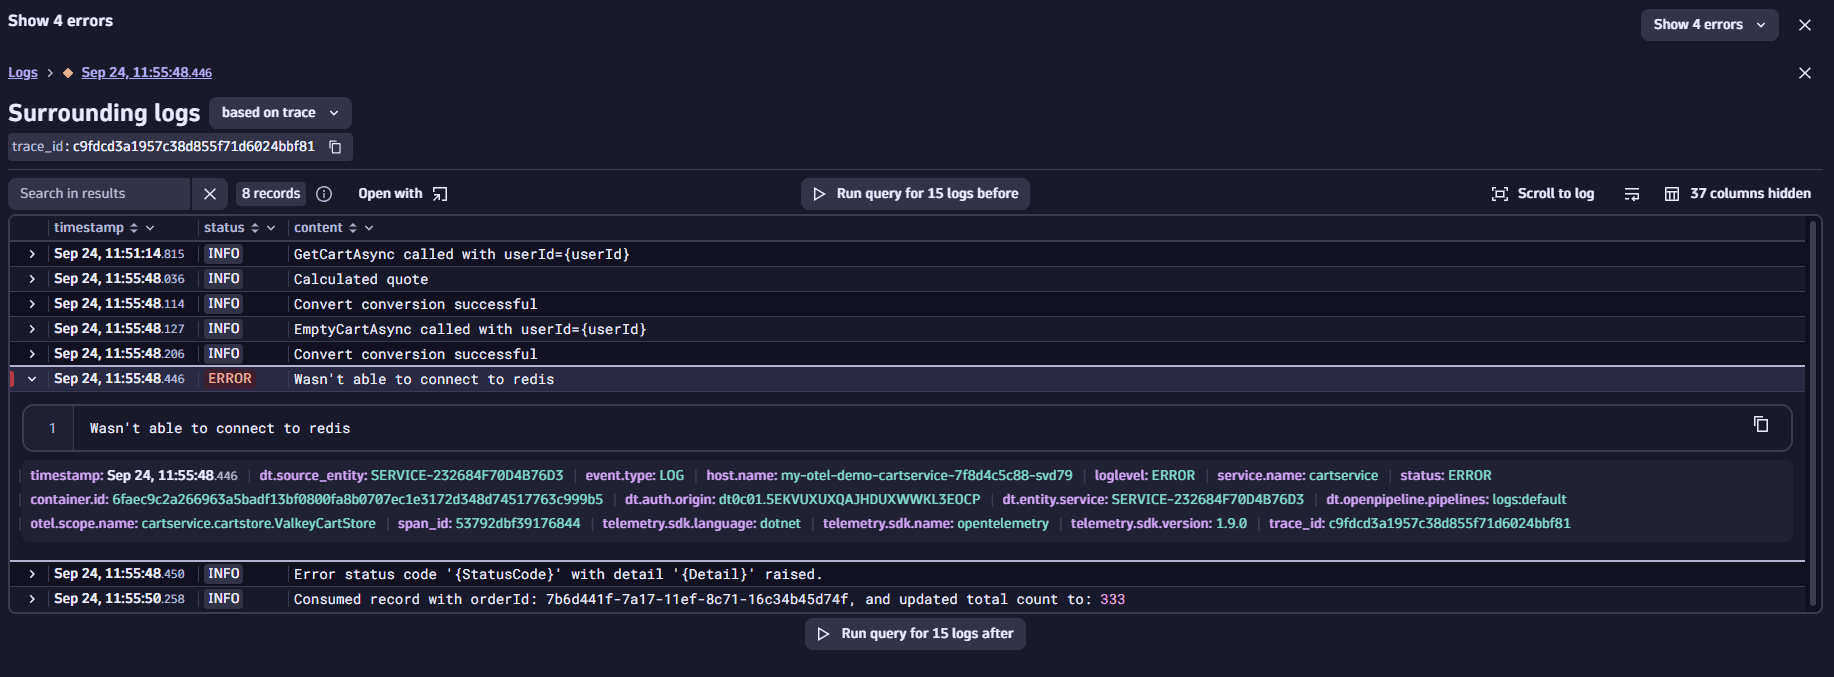
- Choose a filter for surrounding logs:
- based on trace (default): display all logs with the same
trace_id. - based on topology: show the error in the context of all logs for the failing service at the time of the error.
- based on trace (default): display all logs with the same
Logs related to the error, such as info events, may contain additional information that will help you in locating the root cause. Examples of additional information include:
statuscodecontains the error status code. For example,FailedPrecondition.detailcontains the error message and the line of code where the error has occurred.
Related event additional information example

 View details in Distributed Traces
Traces provide you with a deeper view and additional context for the information available in logs. To be able to access traces through logs, you need to connect log data to traces via OpenTelemetry or OneAgent. To learn more about enriching logs with traces, see Understand and fix multiple problems via logs and traces.
To access traces through logs
- Select the
trace_idwhile you're in the expanded log view. - Go to Explore, select Open field with, and select Distributed Traces in the pop-up window.
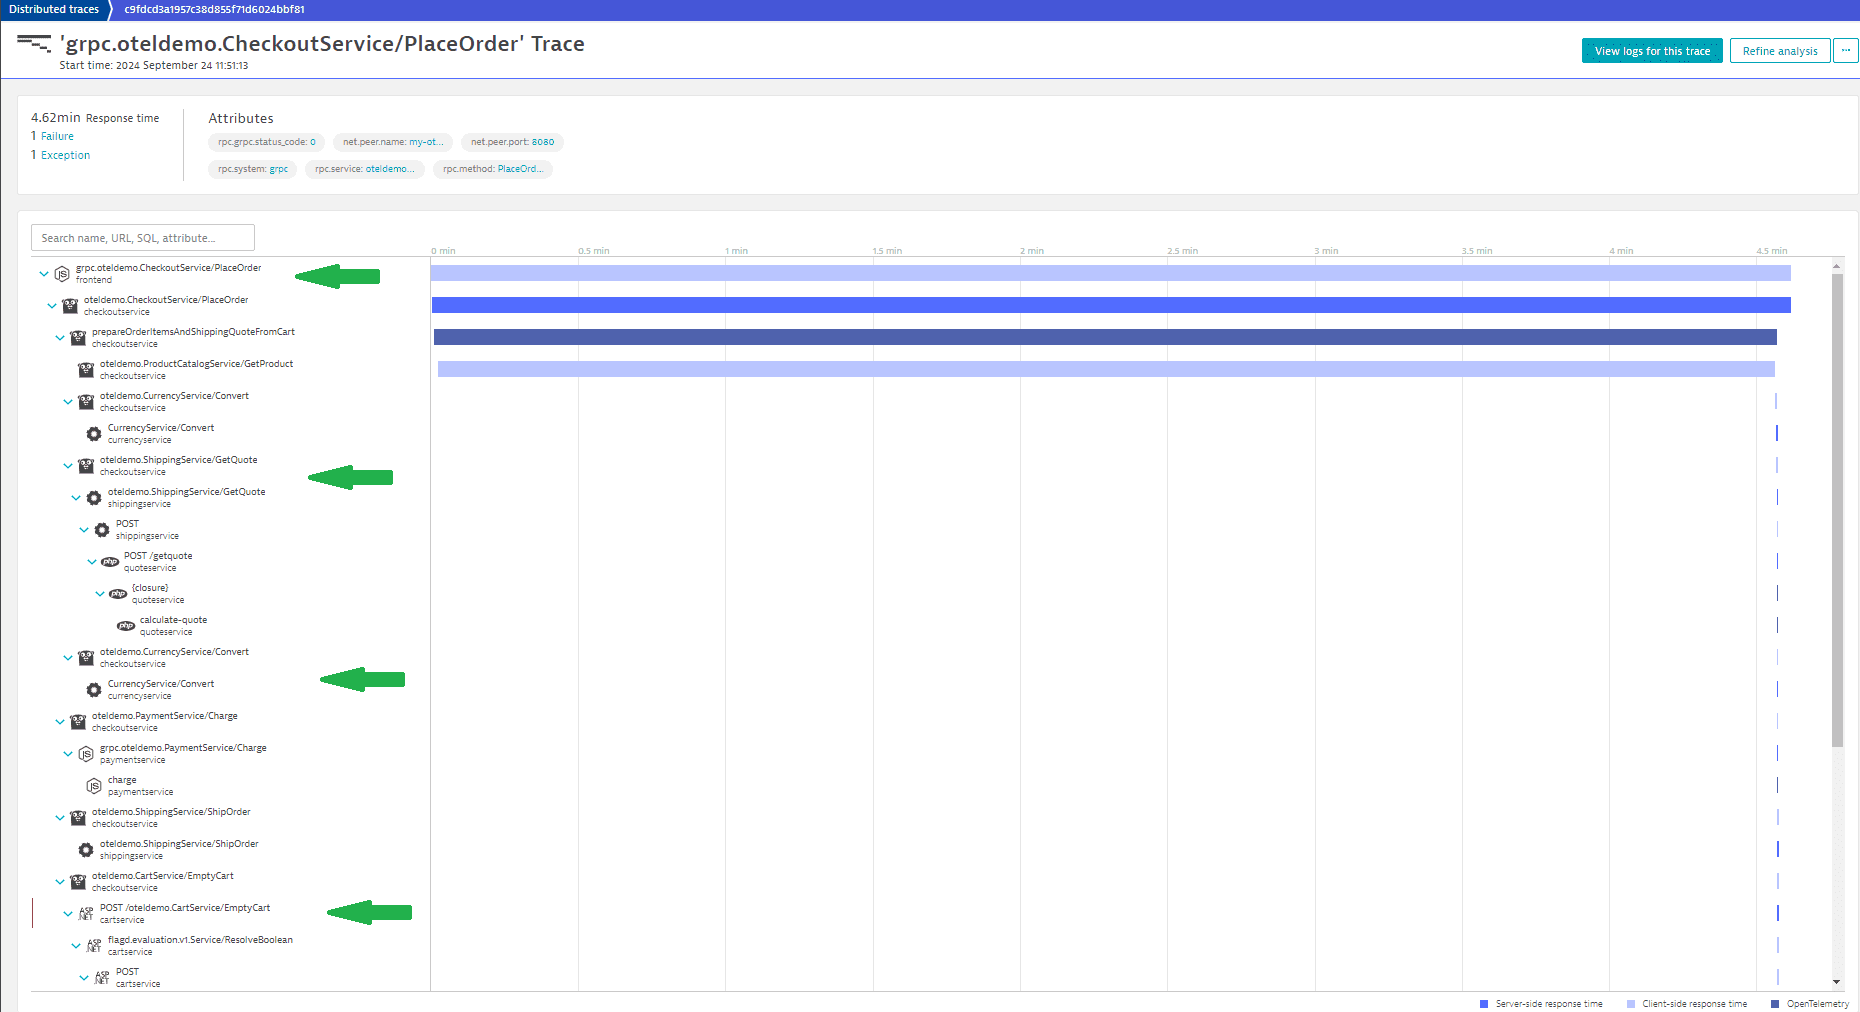
The Distributed Traces app displays a chronological list of called functions, which you can use to make a step-by-step analysis of the problem. The failing point will be marked by a red line.
Distributed Traces app view example
Summary
If you followed all the steps, you have:
- Created a pipeline designed for detecting errors.
- Found the root cause with the help of the Problems app and logs.
If your developer has provided you with a runbook that you can use as a guide for resolving errors, you can follow it as your next step.
Otherwise, your next step should be to contact the team responsible for maintaining the service or feature that led to an error. If you're a part of that team, you can begin the process of debugging the issue.
 OpenPipeline