Set up alerts based on events extracted from logs
- Latest Dynatrace
- Tutorial
- 4-min read
Ingested logs can be triggers for opening new Davis problems.
Using Davis events based on logs you will get immediate alerts once the log record you define is ingested.
Follow this guide to learn more about extracting events from logs.
If you need to set thresholds for your alerts, you should follow the instructions in Set up custom alerts based on metrics extracted from logs.
Prerequisites
Optional
- You have set up log ingestion.
- You have the necessary permissions to configure OpenPipeline. For example, the permissions granted with the default policy: Data Processing and Storage.
Steps
In this example we will open a new Davis problem when certain records, which contain a specific phrase, are ingested.
1. Find logs you want to trigger alerts
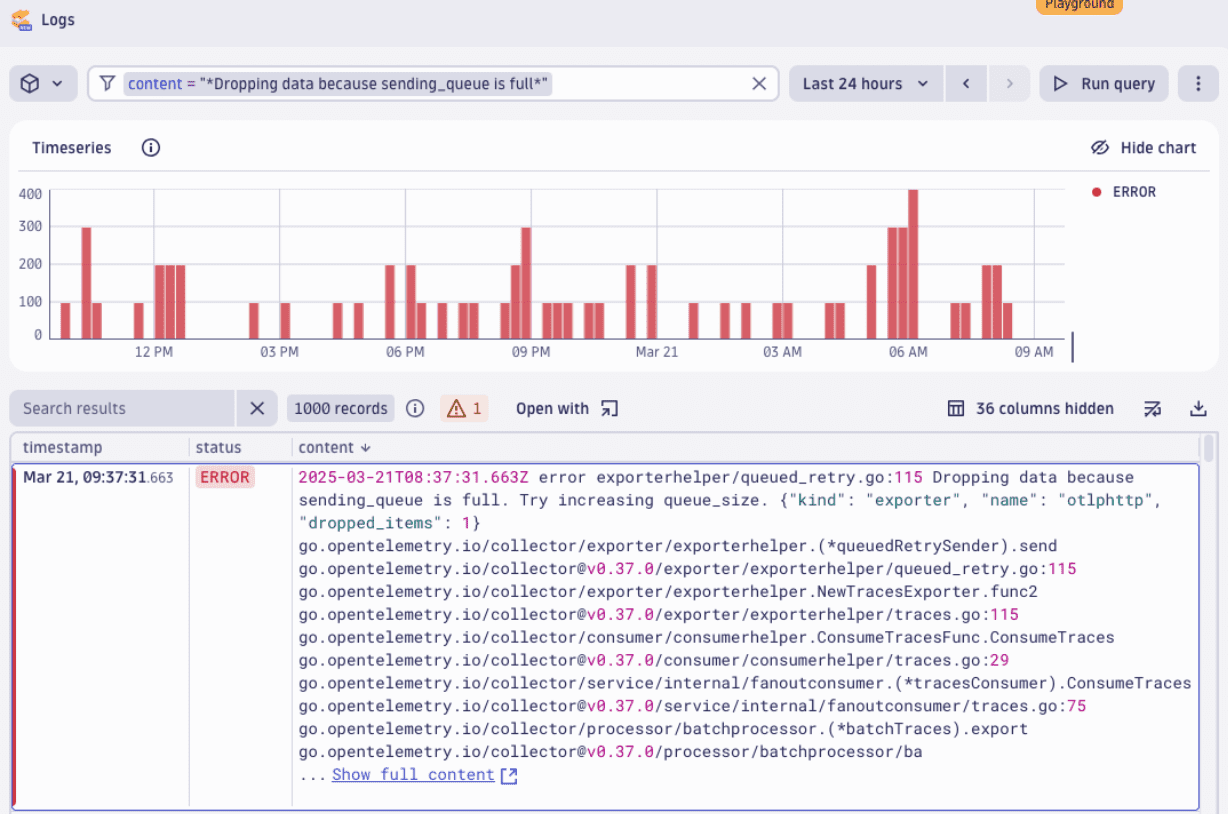
You can find alerts by opening  Logs and using the following DQL query.
fetch logs| filter matchesPhrase(content, "Dropping data because sending_queue is full")| sort timestamp desc
- If your DQL query uses
parse,fieldAdd, or other transformations, you should add a processing rule to set those fields on ingest. - To find which pipeline handles your logs, select a log record in Logs and check the
dt.openpipeline.pipelinesfield. Use that value when selecting a pipeline in OpenPipeline settings.
2. Extract Davis event in OpenPipeline
-
Add Davis event extraction configuration in OpenPipeline.
- Open
 Settings > Process and contextualize > OpenPipeline > Logs > Pipelines.
 - Find the pipeline you want to modify, or add a new pipeline.
- Select > Edit. The pipeline configuration page appears.
- Select the Davis stage and add a Davis event processor.
- Open
-
Set the DQL matcher. A matcher sets the condition for the event that is to be extracted. It is a subset of filtering conditions in a single DQL statement.
In Matching condition, use the matcher as shown below.
matchesPhrase(content, "Dropping data because sending_queue is full")If you use segments or your permissions are set at the record level, you should include those conditions in the matcher.
There are situations when a matcher can't be easily extracted from a DQL statement. In these cases, you can create log alerts for a log event or summary of log data.
-
Set event properties.
Event properties are metadata that your event will contain when it is triggered. You can remap any field from the log record.
In our example, we will remap the
dt.source_entityfield to have the alerts connected to entities for Dynatrace Intelligence root cause analysis.In Event template, set the following key/value pairs.
- Set
event.typetoCUSTOM_ALERT. - Set
event.descriptiontoDropping data because sending_queue is full. Try increasing queue_size.. - Set
event.nametoOpenTelemetry exporter failure. - Set
dt.source_entityto{dt.source_entity}.
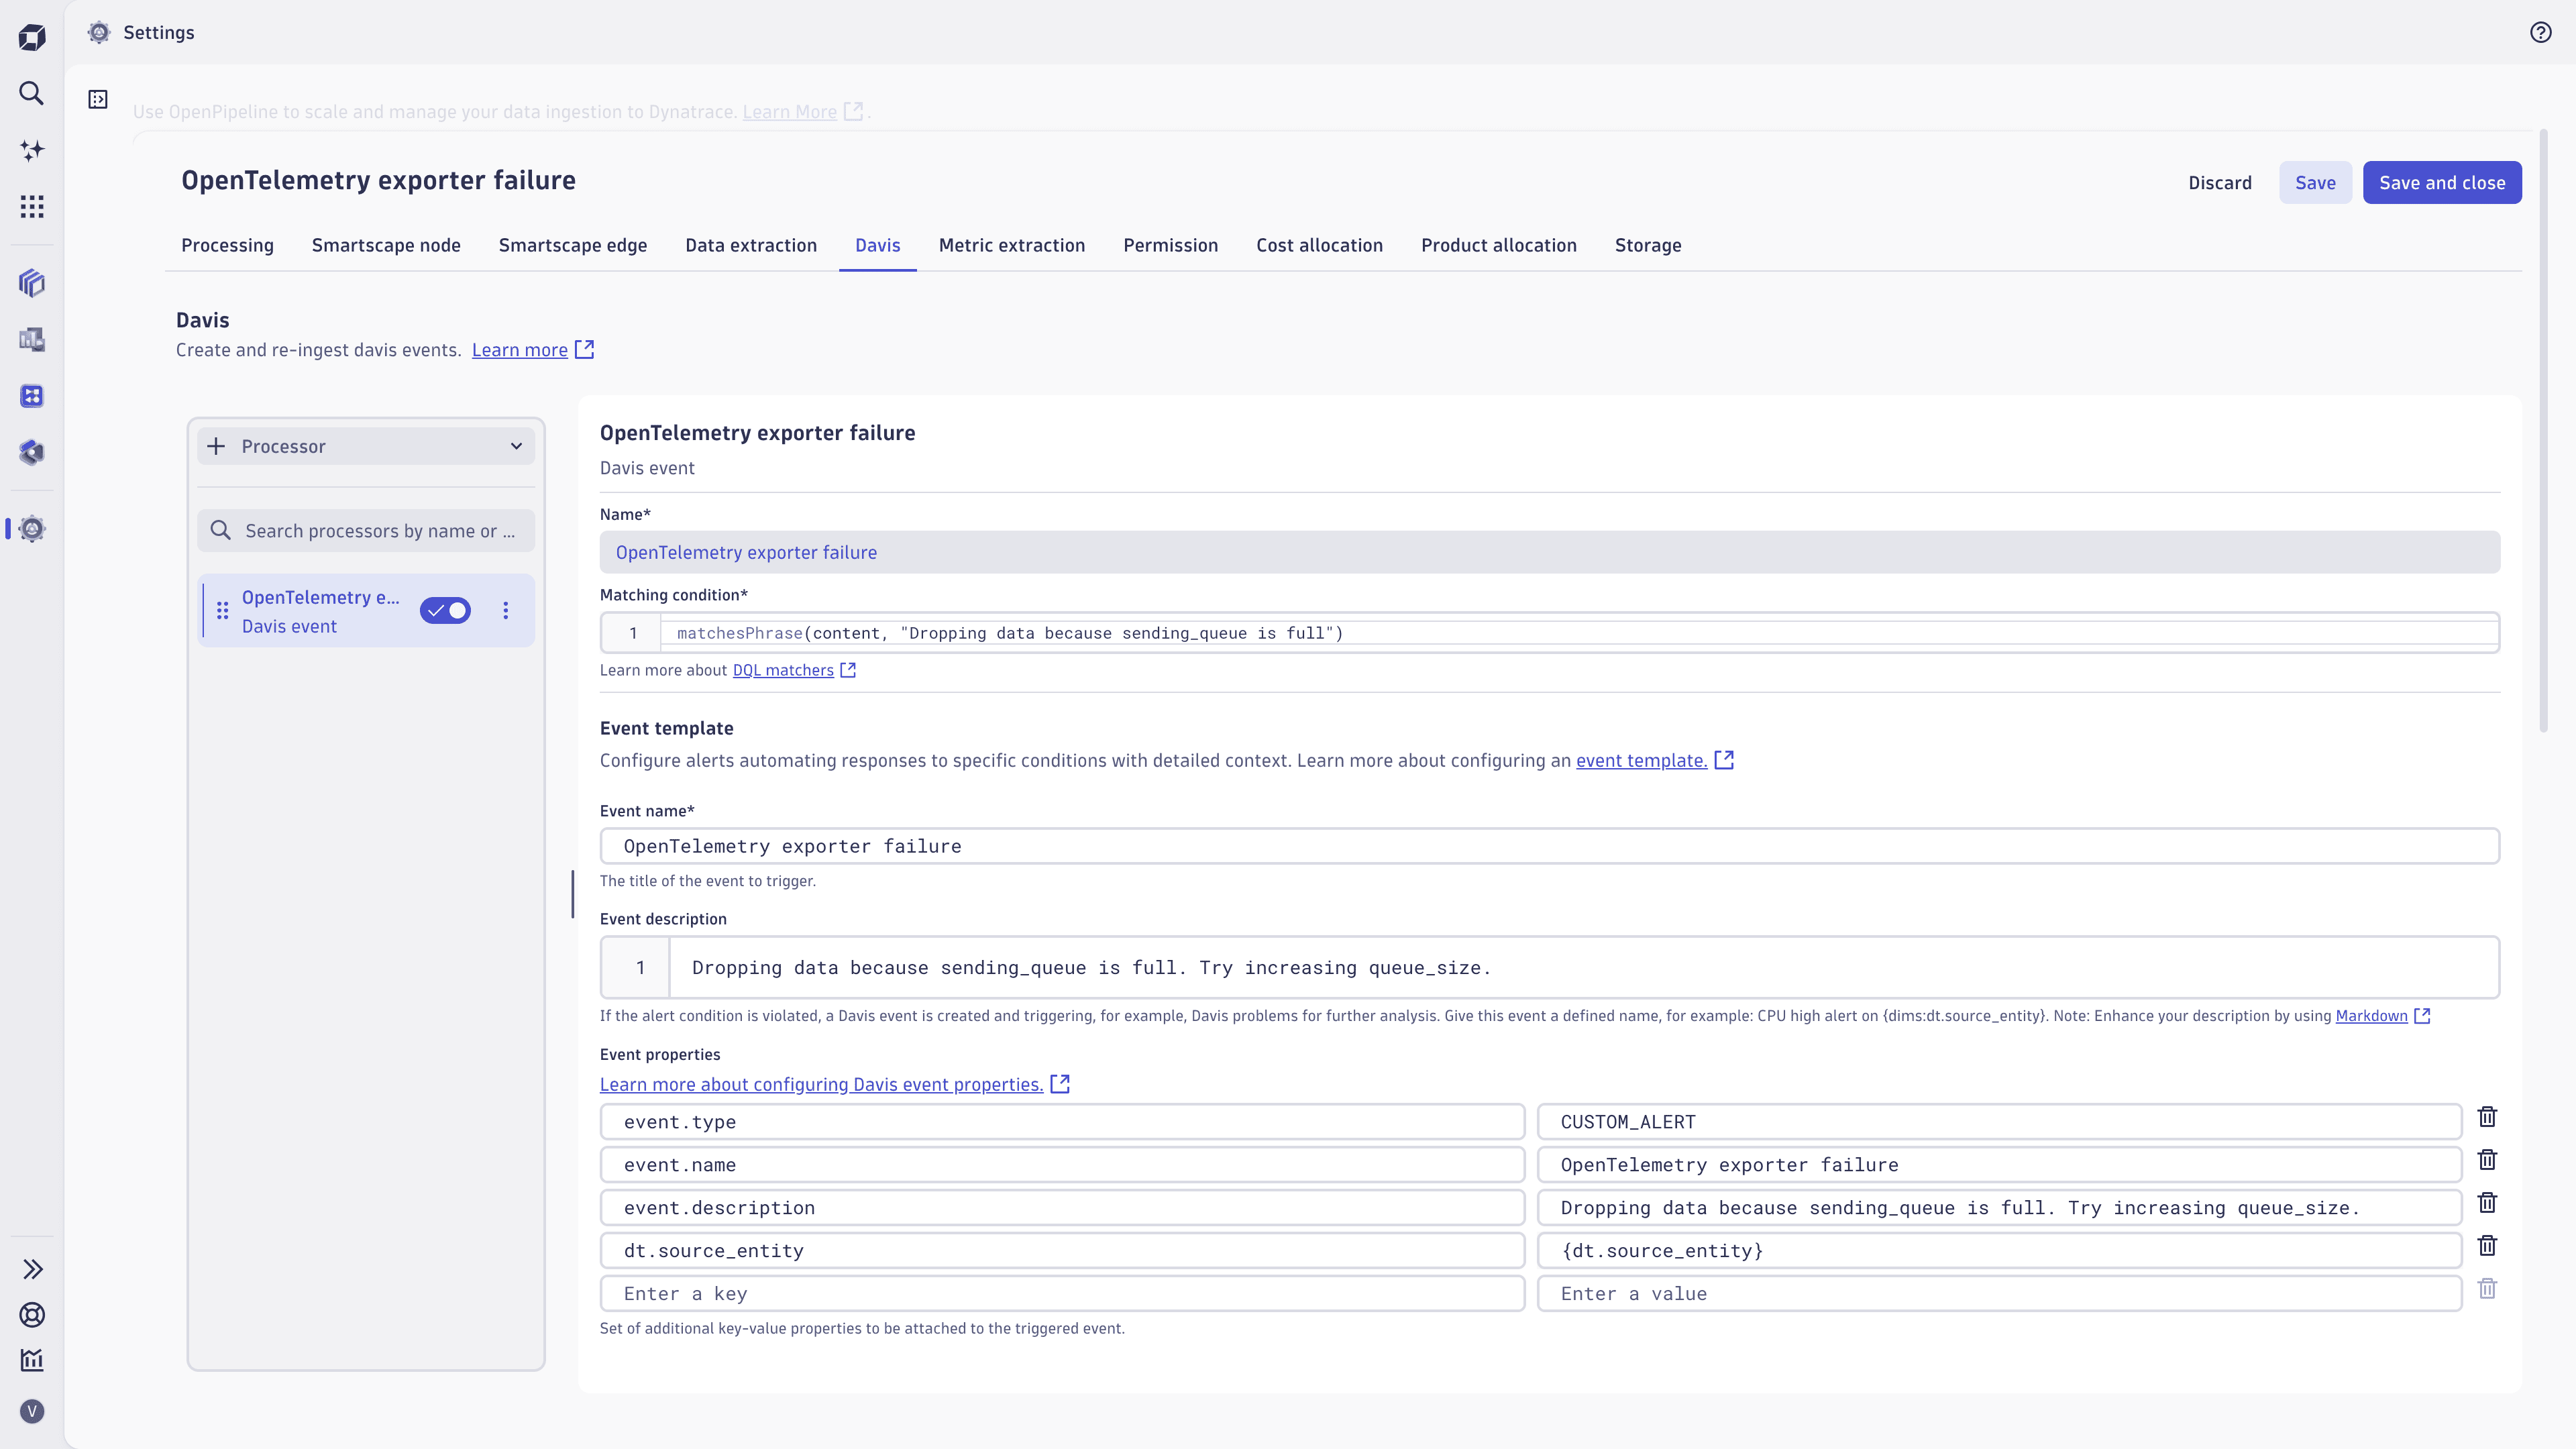 Extract a Davis event from logs via OpenPipeline
 - Set
If you added the extraction rule to an existing pipeline, logs are already routed there and no further configuration is needed.
If you created a new pipeline, configure a dynamic route so logs reach it:
Fields that are computed or added during the Processing stage cannot be used in dynamic route matching conditions because routing is evaluated before Processing. This includes fields added by Dynatrace itself, such as dt.entity.service. For a full list of fields with this limitation, see Fields with limits for all configuration scopes.
-
Go to
Settings > Process and contextualize > OpenPipeline > Logs > Dynamic routing. -
Select Dynamic route and set:
-
Name: For example, use
Dropping data alert route. -
Matching condition: Use the same condition as the Davis event matcher so the route narrows the data to the records you actually want to process.
matchesPhrase(content, "Dropping data because sending_queue is full") -
Pipeline: Select the new pipeline.
-
-
Select Add.
Routes are evaluated top to bottom and the first matching route wins. If you have other routes that could match the same logs, place this route above them.
3. Open problem in Problems
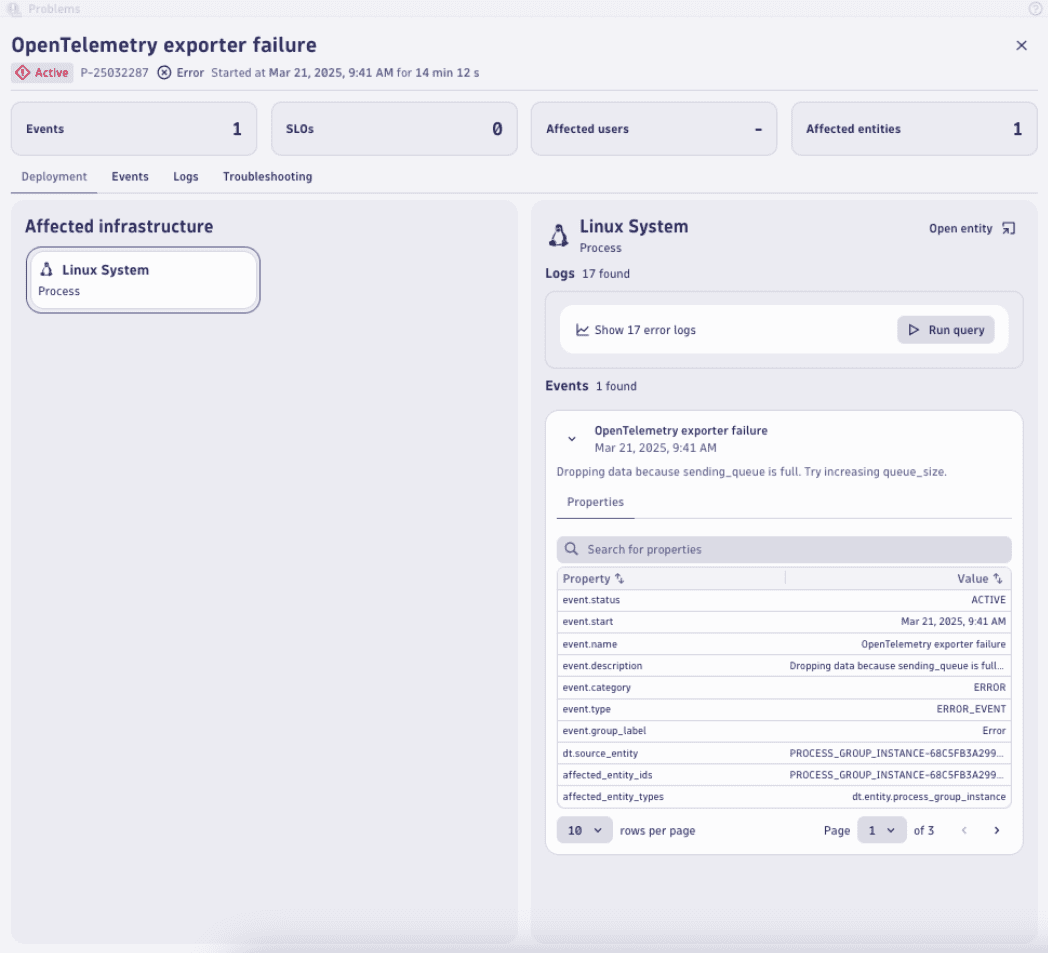
When the first Davis event is extracted, a new problem will be opened.
If there are no new events within the timeout period as defined in dt.davis.event_timeout, the problem will be closed automatically.
The default timeout is 15 minutes.
Conclusion
Extracting Davis events from logs is ideal for simple alerting when thresholds are not important.
- It provides immediate/real-time alerting.
- Additional overview of matching data overtime is not required.
Once you're extracting events, you can use these to trigger automations using simple workflows as described in Create a simple workflow in Dynatrace Workflows.
Further reading
More information about event properties is available at:
 OpenPipeline