Dynatrace SaaS release notes version 1.265
- Latest Dynatrace
- Release notes
- Published Jan 31, 2020
Rollout start: Apr 25, 2023.
Want to ask questions or give feedback? Head over to What's new in Dynatrace in the Dynatrace Community.
The latest Dynatrace is here!
Starting with Dynatrace version 1.265, we've begun rolling out the latest Dynatrace to all Dynatrace SaaS environments.
To ensure smooth transitions for all customers and optimize your user experience, we're doing a phased rollout starting April 25. We'll proactively inform the Dynatrace administrators via email when their respective environment has been upgraded.
Get a head start
- Find out the prerequisites for setting up necessary access policies for your users to use the latest Dynatrace capabilities. For more information, see Onboard users to Grail and AppEngine.
- Think about upgrading your licensing to Dynatrace Platform Subscription (DPS), our new flexible, usage-based monitoring consumption model. For more information, see Dynatrace Platform Subscription documentation.
What's included

Dynatrace AppEngine: Everything thinkable is now possible
AppEngine

AutomationEngine tames cloud complexity with answer-driven automation
Automation

Automated Change Impact Analysis with Site Reliability Guardian
Automation

Boundless analytics with our expanded Grail data lakehouse and new Dynatrace user experience
Grail

From observability to sustainability: Reduce your IT carbon footprint with Dynatrace Carbon Impact
Grail
New Dynatrace Documentation
Get to know the latest Dynatrace capabilities.
Dynatrace UI
Navigate the Dynatrace Platform
Introducing the Launcher, Dock, and apps—the Launcher is your new home page, the Dock holds all your favorite apps, and you can search your environment in record time.

New data visualizations
Learn how to use and control the latest Dynatrace data visualizations.
Observe and explore

Dashboards
Quickly and easily transform complex data into easy-to-understand visualizations that paint a clear picture for you.

Notebooks
Create powerful, data-driven documents for custom analytics in the brand-new Notebooks app, the go-to place for data exploration.
Visualizations for Dashboards and Notebooks
Learn about your visualization options with Dynatrace Notebooks and Dashboards.
Automation

Workflows
Boost your productivity, optimize your reporting, handle security alerts faster, or build any custom workflows.
Site Reliability Guardian
Make the right release decisions and empower SREs to apply Service-Level Objectives (SLOs) for their critical services using Site Reliability Guardian.

Slack for Workflows
Automate sending messages to Slack based on the events and schedules defined for your workflow.

Jira for Workflows
Automate creating, commenting, and assigning Jira issues on the events and schedules defined for your workflow.

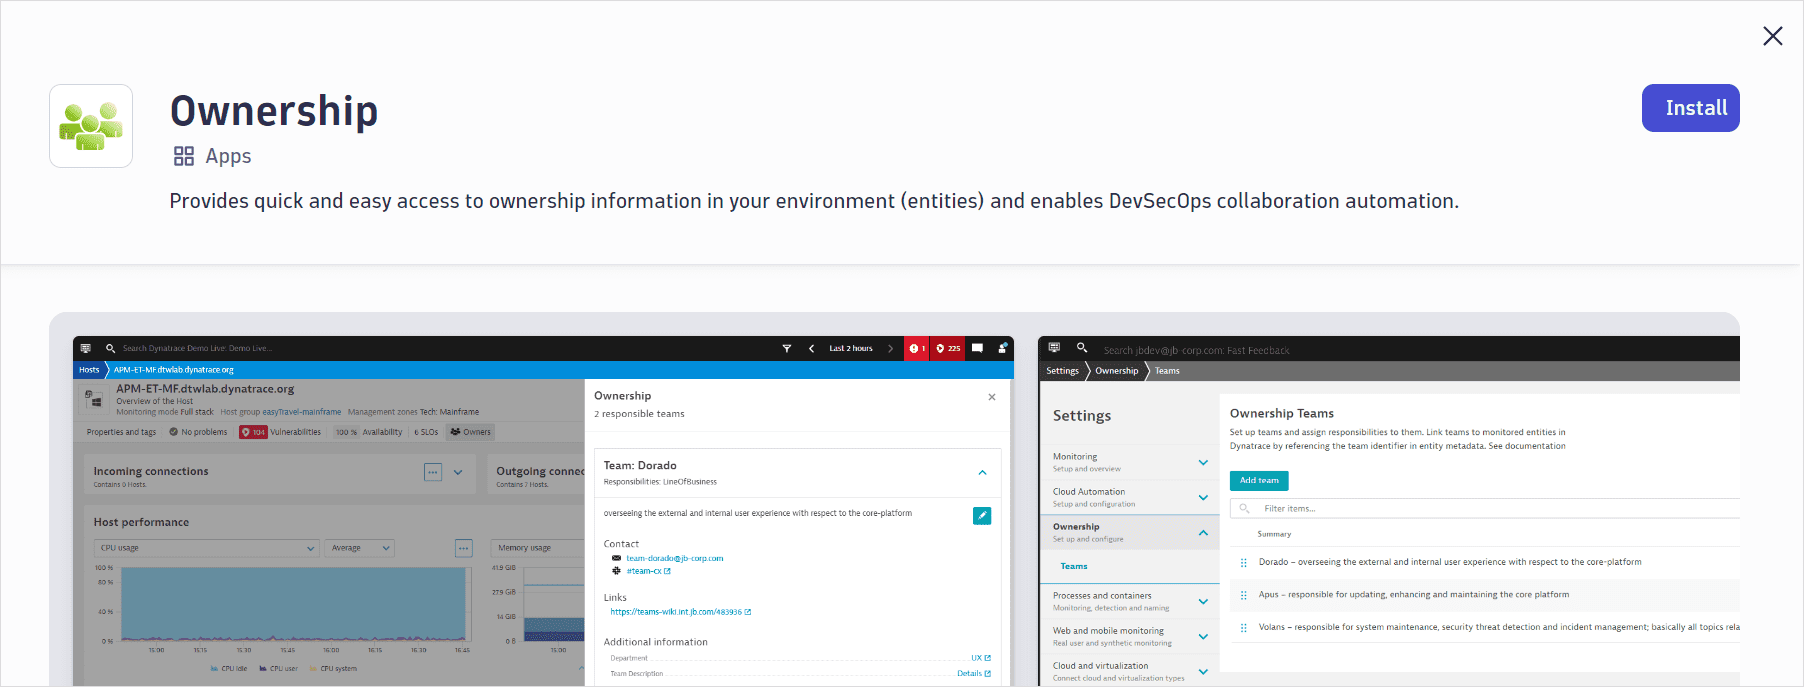
Ownership app
Extract entity ownership contact information to create workflows that automate notifications, task assignment, and other use cases.
Business Observability

Business Flow
Track business key performance indicators (KPI), detect process anomalies, and prioritize optimization opportunities to improve business outcomes.
Carbon Impact
Track, report, and reduce the carbon emissions resulting from your cloud and on-premises infrastructure electricity consumption.

Explore Business Events
Explore Business Events is a central repository of resources related to business events, including blog posts, documentation, product links, and other applications relevant to business analysis.

Salesforce Insights
Ensure optimal performance of the Salesforce solution by monitoring performance, feature adoption, logins, user actions, and threats for your Salesforce environment.
Dynatrace Platform
AppEngine
With the introduction of the Dynatrace AppEngine, you can now build custom apps on top of all the observability data collected by Dynatrace.
AutomationEngine
Dynatrace AutomationEngine enables you to combine observability, security, and business data with causal AI to easily automate BizDevSecOps workflows at enterprise scale.
Dynatrace Hub

New features and enhancements
New DQL functions
Platform | DQL
Now you can include the following functions in your DQL queries:
- hashMd5
ThehashMd5function computes the MD5 hash for a given string expression.
- hashSha1
ThehashSha1function computes the SHA-1 hash for a given string expression.
- hashSha256
The
hashSha256function returns a SHA-256 hash for the given expression. - hashSha512
The
hashSha512function returns a SHA-512 hash for the given expression.
- percentile
Calculates a given percentile of an expression.
New tool for writing cost-effective DPL patterns.
Platform | DPL Latest Dynatrace
Use the DPL Architect tool to:
- Extract additional typed fields from the data in Grail.
- Save time when developing DPL patterns.
- Get instant feedback on the effectiveness and coverage of your patterns for your specific use case.
Bucket and table permissions in Grail
Platform | Grail
You can now assign user permissions to built-in (default) and custom buckets, and tables in Grail.
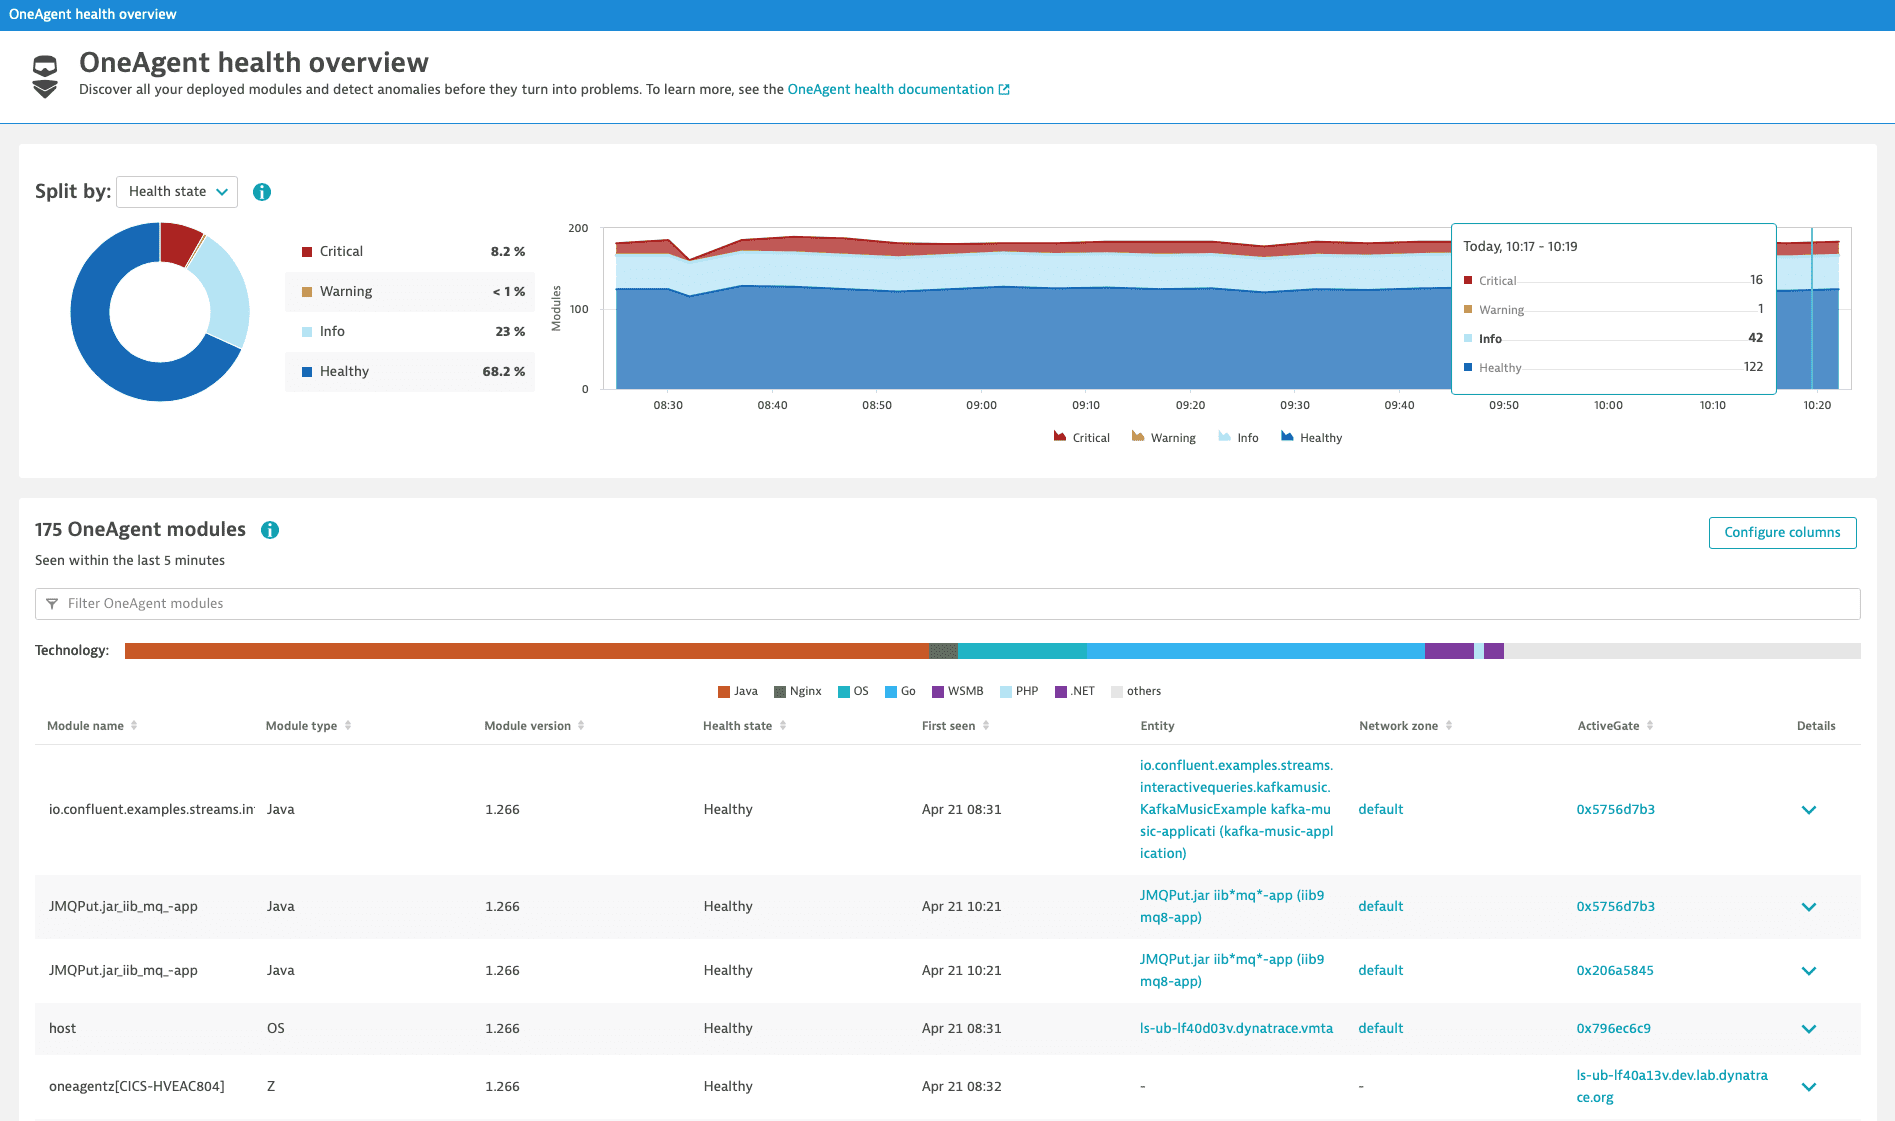
OneAgent health
Platform | OneAgent
OneAgent Health offers an overview of all your deployed OneAgent modules and their corresponding health statuses, so you can detect anomalies before they become problems.
Management zone support for vulnerability notifications
Application Security | Vulnerabilities
You can configure your alerting profile to receive notifications
- When a vulnerability is opened or reopened.
- When a new management zone is affected by an open problem.
You can also set up an optional filter to receive alerts for a specific management zone.
For details, see
Metric events filter update
Platform | Davis AI
The logic of tag filter in metric events now considers a non-existing tag value as the "all" wildcard. If no tag value exists, all possible values of the specified tag match, including a null value. Let's consider an example:
- HOST1 with tag
Monitoring:True - HOST2 with tag
Monitoring:False - HOST3 with tag
Monitoring - HOST4 without any tags
Previously, the filter with the condition TAG equals Monitoring would match only the HOST3. Now the filter matches the hosts HOST1, HOST2, HOST3.
Ownership app
Automation | Ownership Latest Dynatrace
The Ownership app in the latest Dynatrace enables you to take advantage of two custom actions for building workflows that involve querying for the ownership team (and related contact information) of an entity. With these actions, you can extract data about the entity and integrate with other apps to send Slack notifications or Jira updates to the entity owners based on different types of triggers.
Custom keys for ownership information
Automation | Ownership
You can define custom keys for applying ownership information to entities in key-value pairs via tags and entity metadata. The default keys owner and dt.owner are available with each environment. However, you change these as required to define up to five custom keys. You can use any defined key as a prefix to create additional keys. For example, for the key entity-owner, you can use entity-owner.1 and entity-owner-2 in key-value pairs. Access the custom key functionality at Settings > Ownership > Configuration.
Metrics for Kubernetes events
Infrastructure Monitoring | Kubernetes
Kubernetes events are now written into a timeseries that can be filtered by event type and event reason. This timeseries can be used to search for event behavior over time and contains the affected entities.
Calling and called cards half sized
Infrastructure Monitoring | Kubernetes
Calling workloads, Called workloads , Calling services and Called services cards on the workload and Kubernetes service screens are now positioned in a single row and are half-sized for improved visibility.
Invalid VMware credentials disabled in VMware settings
Infrastructure Monitoring | Hosts
Now, invalid credentials are automatically disabled in VMware settings after 5 consecutive failed attempts to connect to a vCenter.
Adaptive Traffic Management v3
Apps & Microservices | Distributed traces
Adaptive Traffic Management in Dynatrace SaaS is now available in two versions
- In Version 2, the peak trace volume is measured in Full-service call/minute.
- In Version 3, the peak trace volume is measured in Byte/minute. This version supports data-heavy features, such as bind variables capture.
To learn about Adaptive Traffic Management versions with classic license, see Version comparison.
Dynatrace SaaS bind variables support
Apps & Microservices | Distributed traces
New support of bind variables capture for Dynatrace SaaS deployments. Want to enable this feature for your environment? Please contact a Dynatrace product expert via live chat within your environment.
Dynatrace API
To learn about changes to the Dynatrace API in this release, see Dynatrace API changelog version 1.265.
Resolved issues
General Availability (Build 1.265.103)
The 1.265 GA release doesn't contain any user-facing resolved issues.
Update 111 (Build 1.265.111)
This is a cumulative update that contains all previously released updates for the 1.265 release.
Update 113 (Build 1.265.113)
This is a cumulative update that contains all previously released updates for the 1.265 release.
Update 124 (Build 1.265.124)
This is a cumulative update that contains all previously released updates for the 1.265 release.
Update 125 (Build 1.265.125)
This cumulative update contains 1 resolved issue and all previously released updates for the 1.265 release.
Cluster
- Fixed a case where very large problems could cause the entire problem manager to get stuck. (DAVIS-4587)
Update 136 (Build 1.265.136)
This cumulative update contains 19 resolved issues and all previously released updates for the 1.265 release.
| Component | Resolved issues |
|---|---|
| Cluster | 11 |
| ActiveGate | 2 |
| Application Security | 1 |
| Log Monitoring | 1 |
| rest api | 1 |
| Session Replay | 1 |
| Synthetic monitoring | 1 |
| User Interface | 1 |
Cluster
- Filtering on Deployment Status for OneAgent was not working in some particular cases (order of applying filters) when filtering by name was used and the filter contained ":" character. (DMX-3390)
- Fixed an issue in which a problem chart could stay in an error state even when the error was resolved. (DAVIS-4212)
- Fixed an issue in which some metrics couldn't be queries during a metric correlation in the user interface. (DAVIS-4226)
- RabbitMQ is now visible as main technology if mixed with technologies. (HOST-2460)
- Fixed an issue where delayed user actions were dropped between visit splits. (RUM-9535)
- The waterfall analysis no longer shows resources loaded by XHRs in frames twice. (RUM-9983)
- Fixed an issue where hybrid sessions with only errors were dropped. (RUM-10105)
- Due to a bug, we have currently disabled the ability to duplicate an existing configuration in metric events. The fix is already underway and will be available shortly. (DAVIS-4437)
- Corrected information on metric calculation for custom metrics. (LIMA-7072)
- An attempt to delete an attribute that either did not exist or has been deleted now returns a proper validation message explaining that the attribute cannot be found. (TI-6076)
- Corrected calculated data points displayed when creating a custom metric. (LIMA-7071)
ActiveGate
- Fixed an issue with handling of CA Certificate and Custom SSL Certificate parameters in ActiveGate Windows installer, in which the actual location where the installer put the certificate, and the configured location of the file could be different. Now locations are consistent. (DMX-3477)
- Fixed issue with assigning a Synthetic private location to an ActiveGate after update. (DMX-3283)
Application Security
- The comment to the vulnerability status change (muting/unmuting) is now limited to 250 characters. The change applies to the UI and the API. (RSA-9284)
Log Monitoring
- Log event ingest by open API could drop when ActiveGate instances were updated. Any drop in log event ingestion was short lived and stopped after the ActiveGate update was completed. This fix eliminates any such drops. (LOG-3294)
rest api
- Fixed an issue in which the fold operator with aggregation could disable the default operator in metric selectors. (CLUSTER-5348)
Session Replay
- Users with proper permissions can access the Session Replay Enablement and Cost control page. (SR-2175)
Synthetic monitoring
- Fixed an issue related to the Synthetic browser monitor configuration migration, which could lead some environments to fail to start after the upgrade. (SYNTH-4745)
User Interface
- Fixed an issue where application showed an error in some cases when the navigation took longer than expected. These crashes should no longer occur. (UIP-3349)