Multidimensional analysis for web applications in RUM Classic
- Dynatrace Classic
- How-to guide
- 8-min read
- Published Jun 28, 2019
Dynatrace Real User Monitoring Classic enables you to dig deep into your user actions and perform analysis across numerous dimensions. Multidimensional User action analysis pages can be accessed from many entry points throughout Dynatrace. Depending on where you begin your analysis, pre-selected filters can be applied and carried forward as your analysis progresses.
Following are the main entry scenarios for making use of the latest multidimensional User action analysis views.
Scenario 1: Analysis based on user action type
Dynatrace differentiates between Load actions, XHR actions, and Custom actions (see below), enabling you to apply the ideal performance metrics for each action type. This provides for focused, in-context analysis of each user action type.
To access multidimensional analysis based on user action type
-
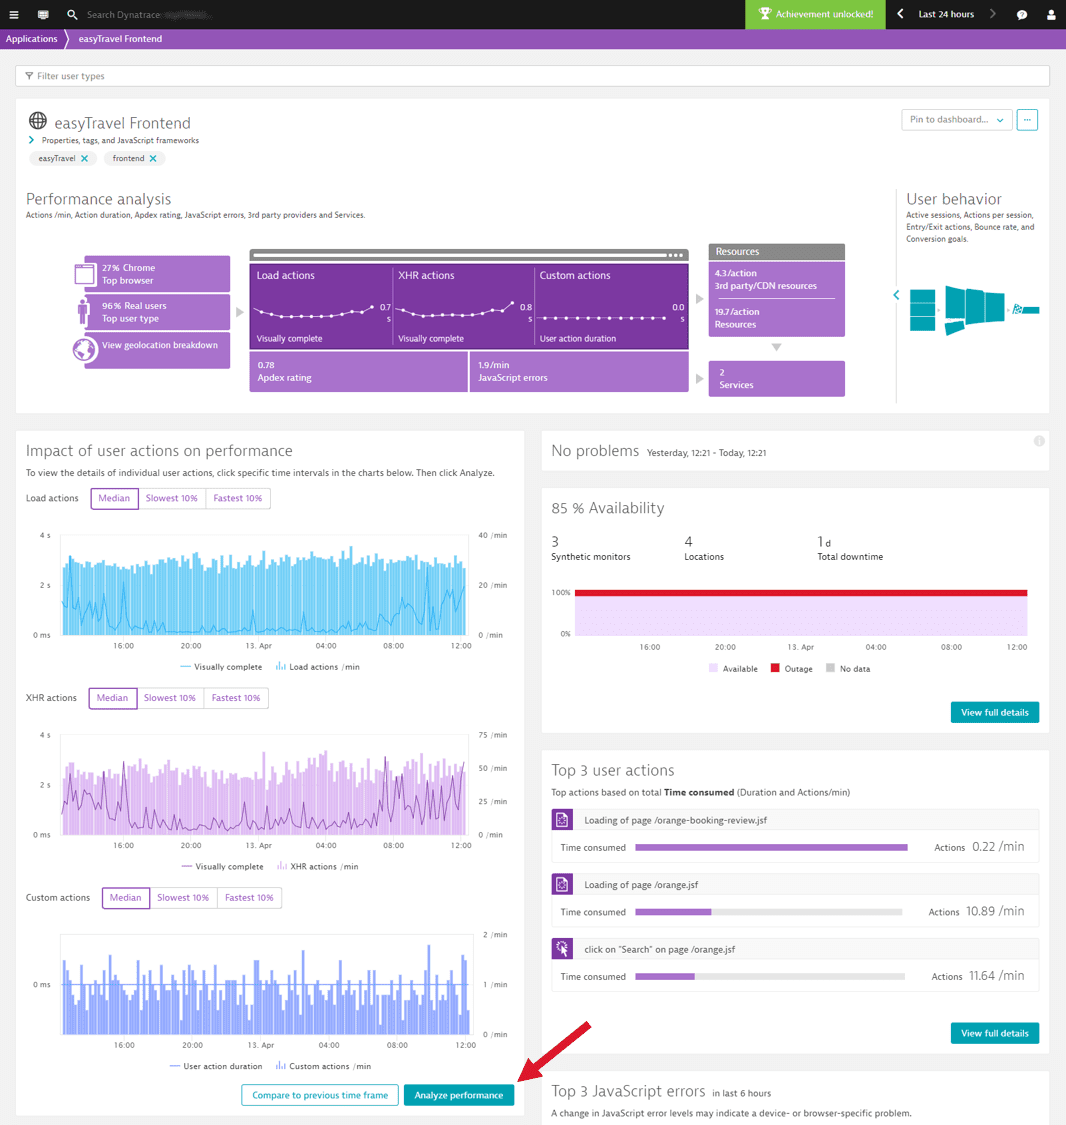
Go to Web.
-
Select the application you want to analyze.
-
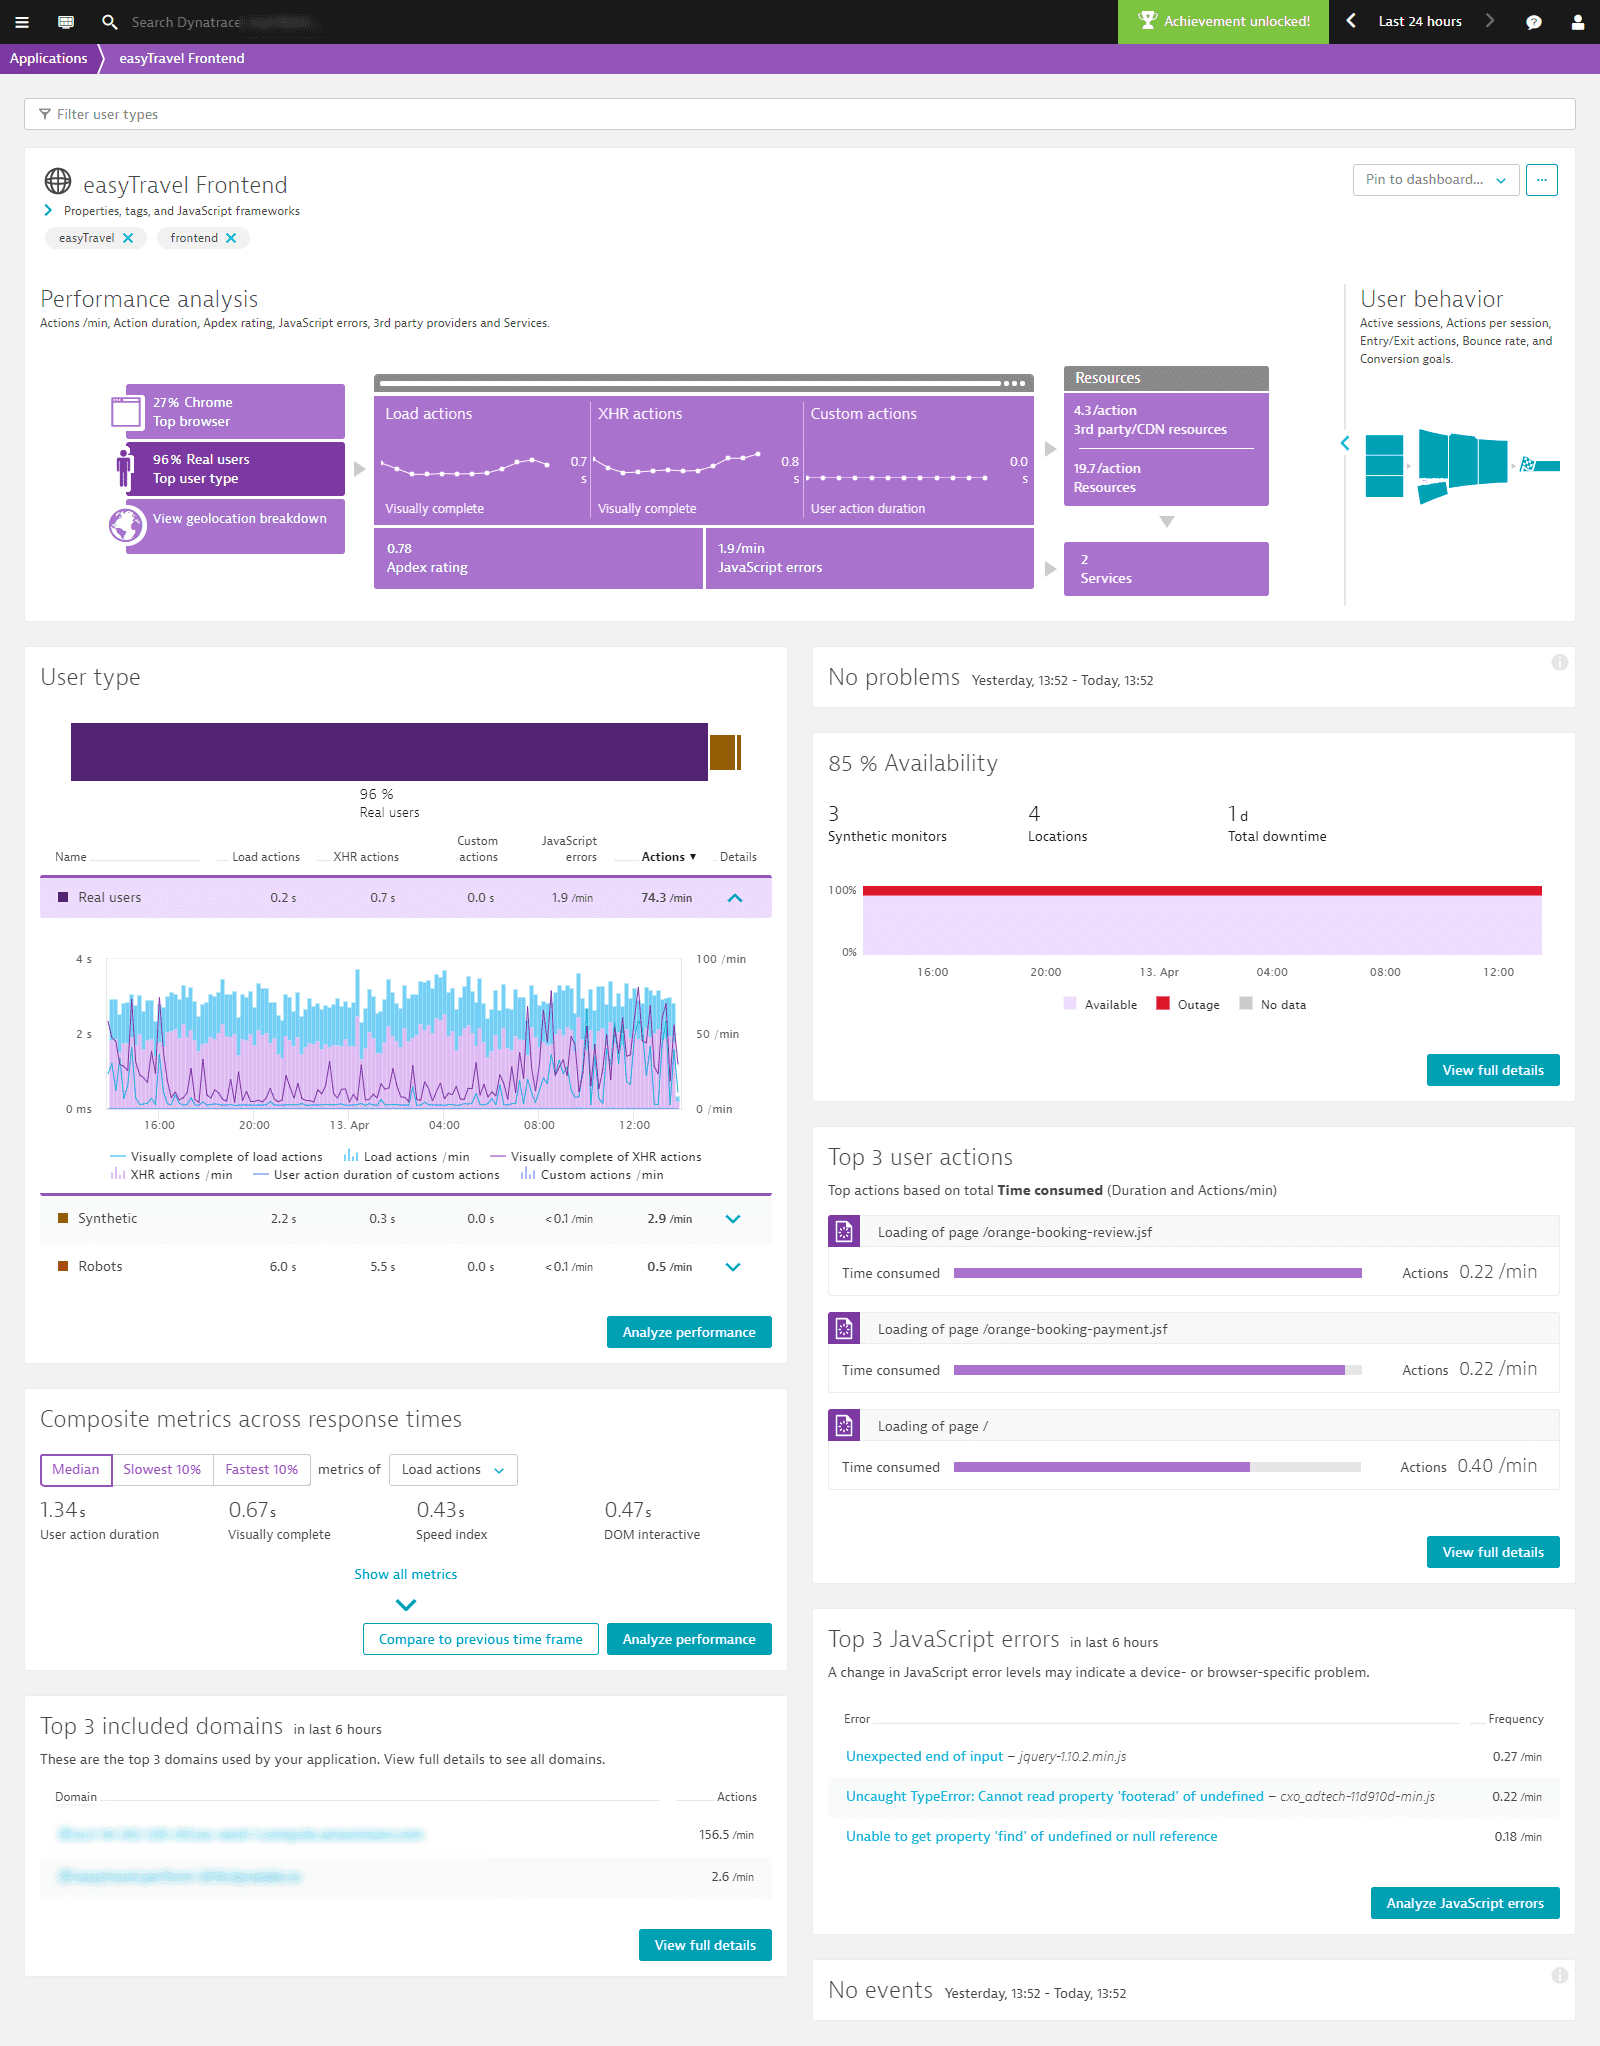
In the Impact of user actions on performance section of the page, select Analyze Performance to open the User action analysis view.
 Multidimensional analysis
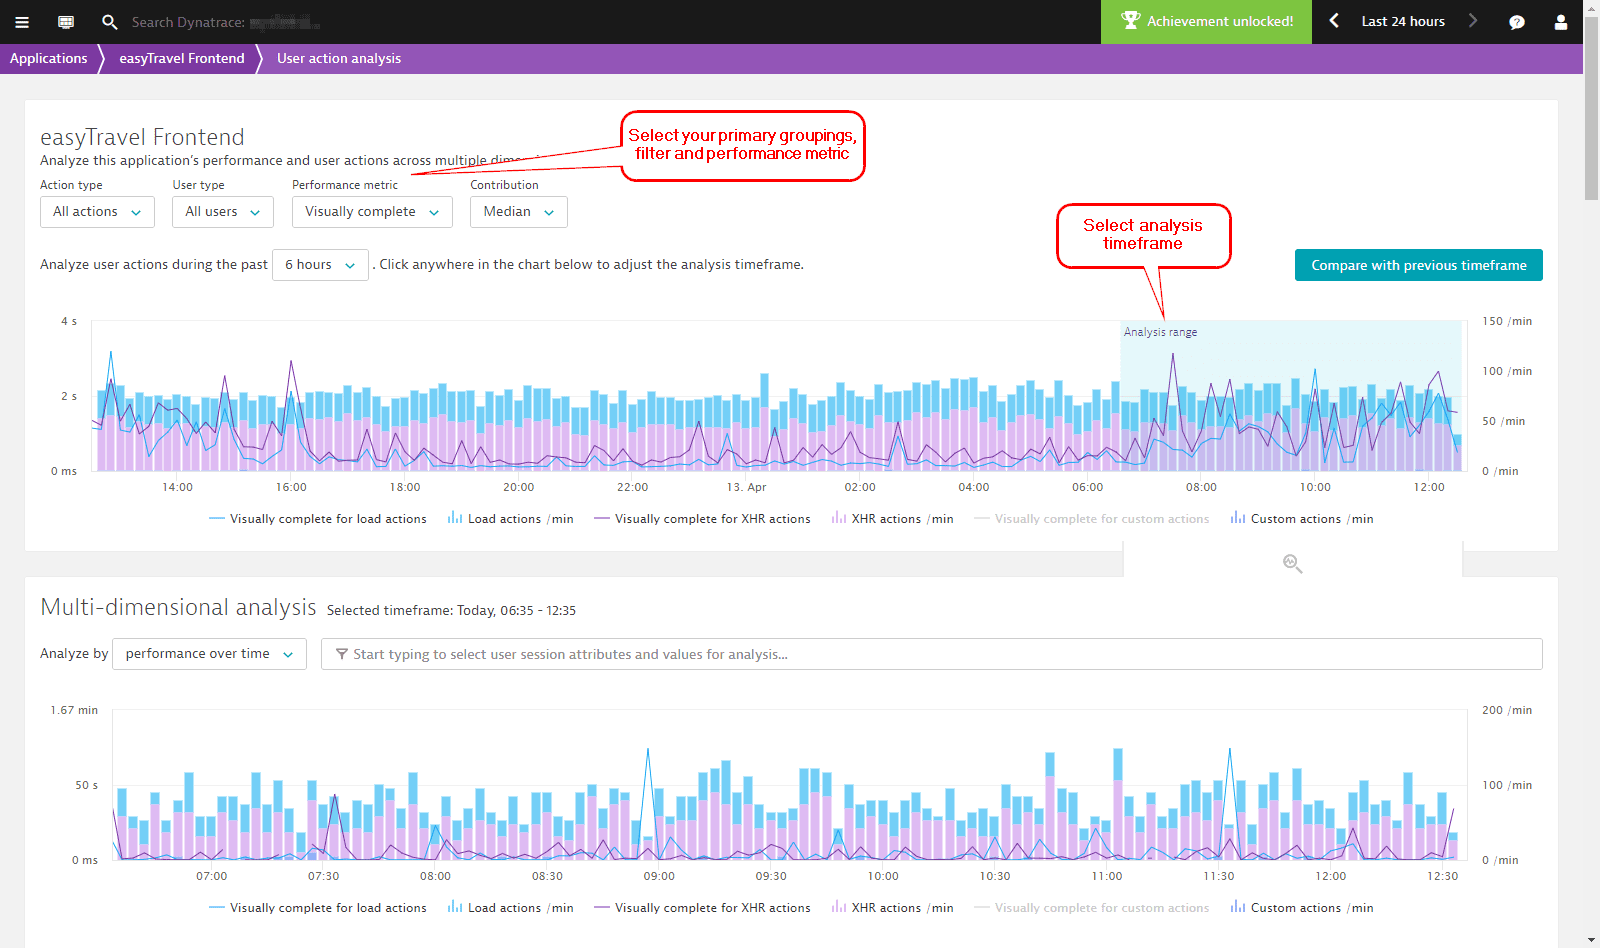
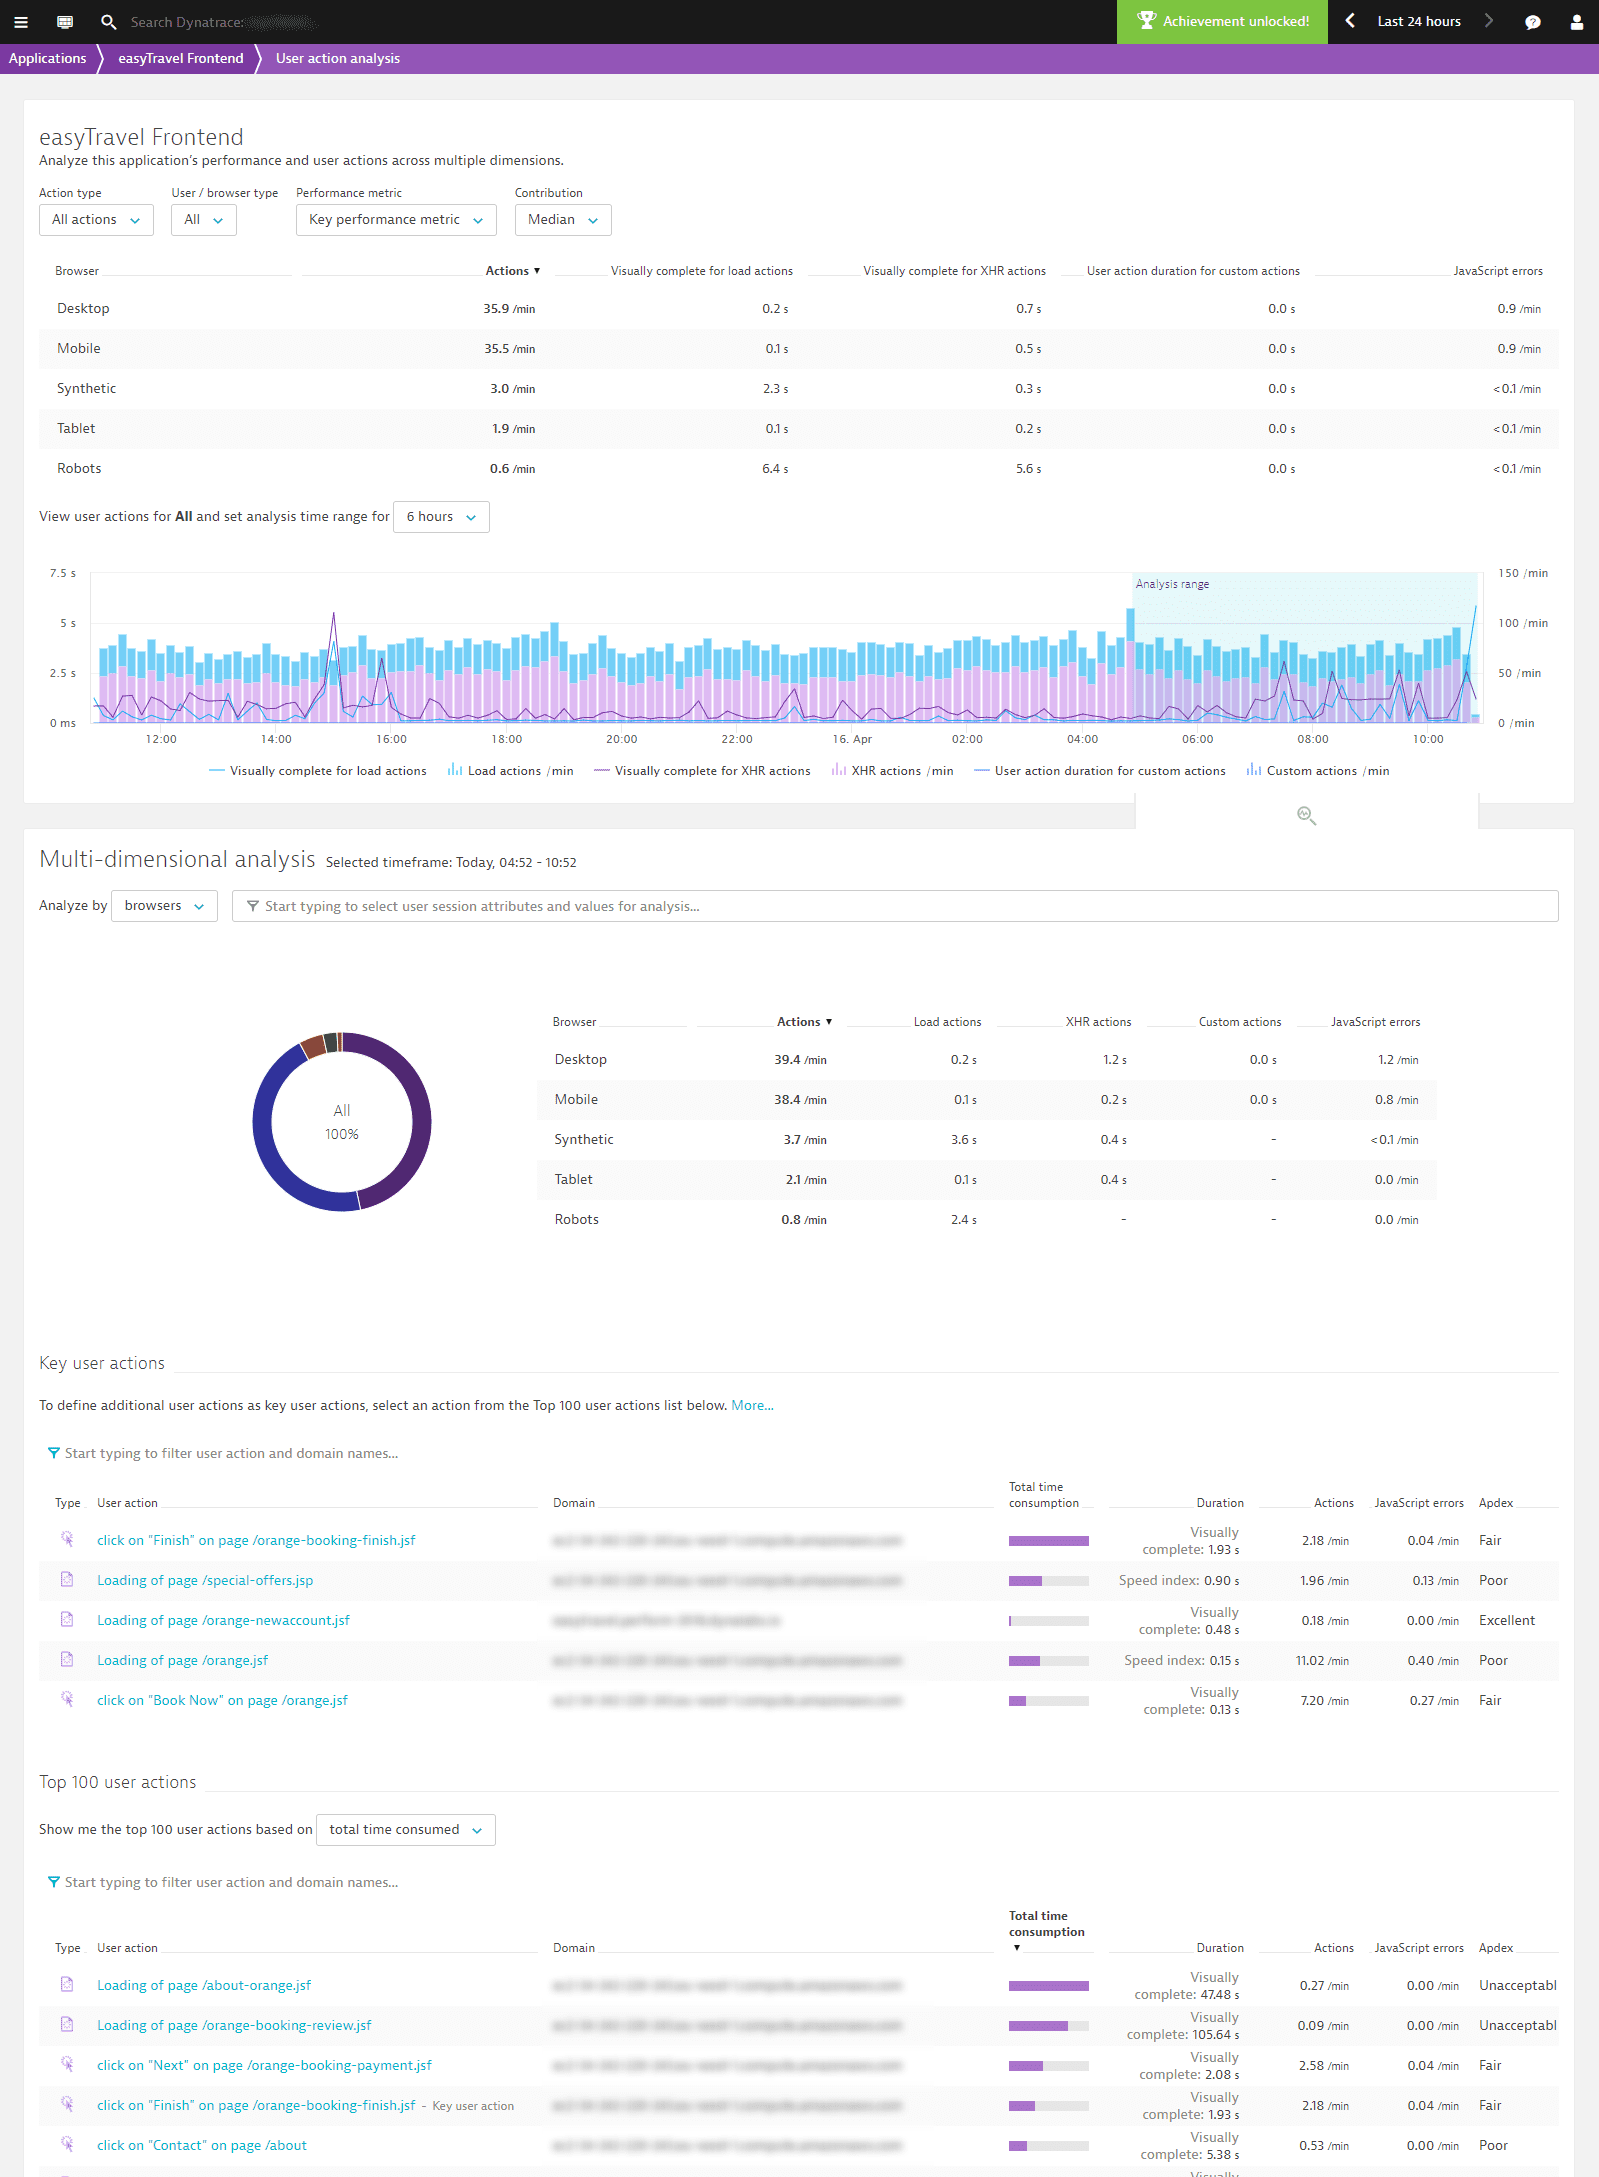
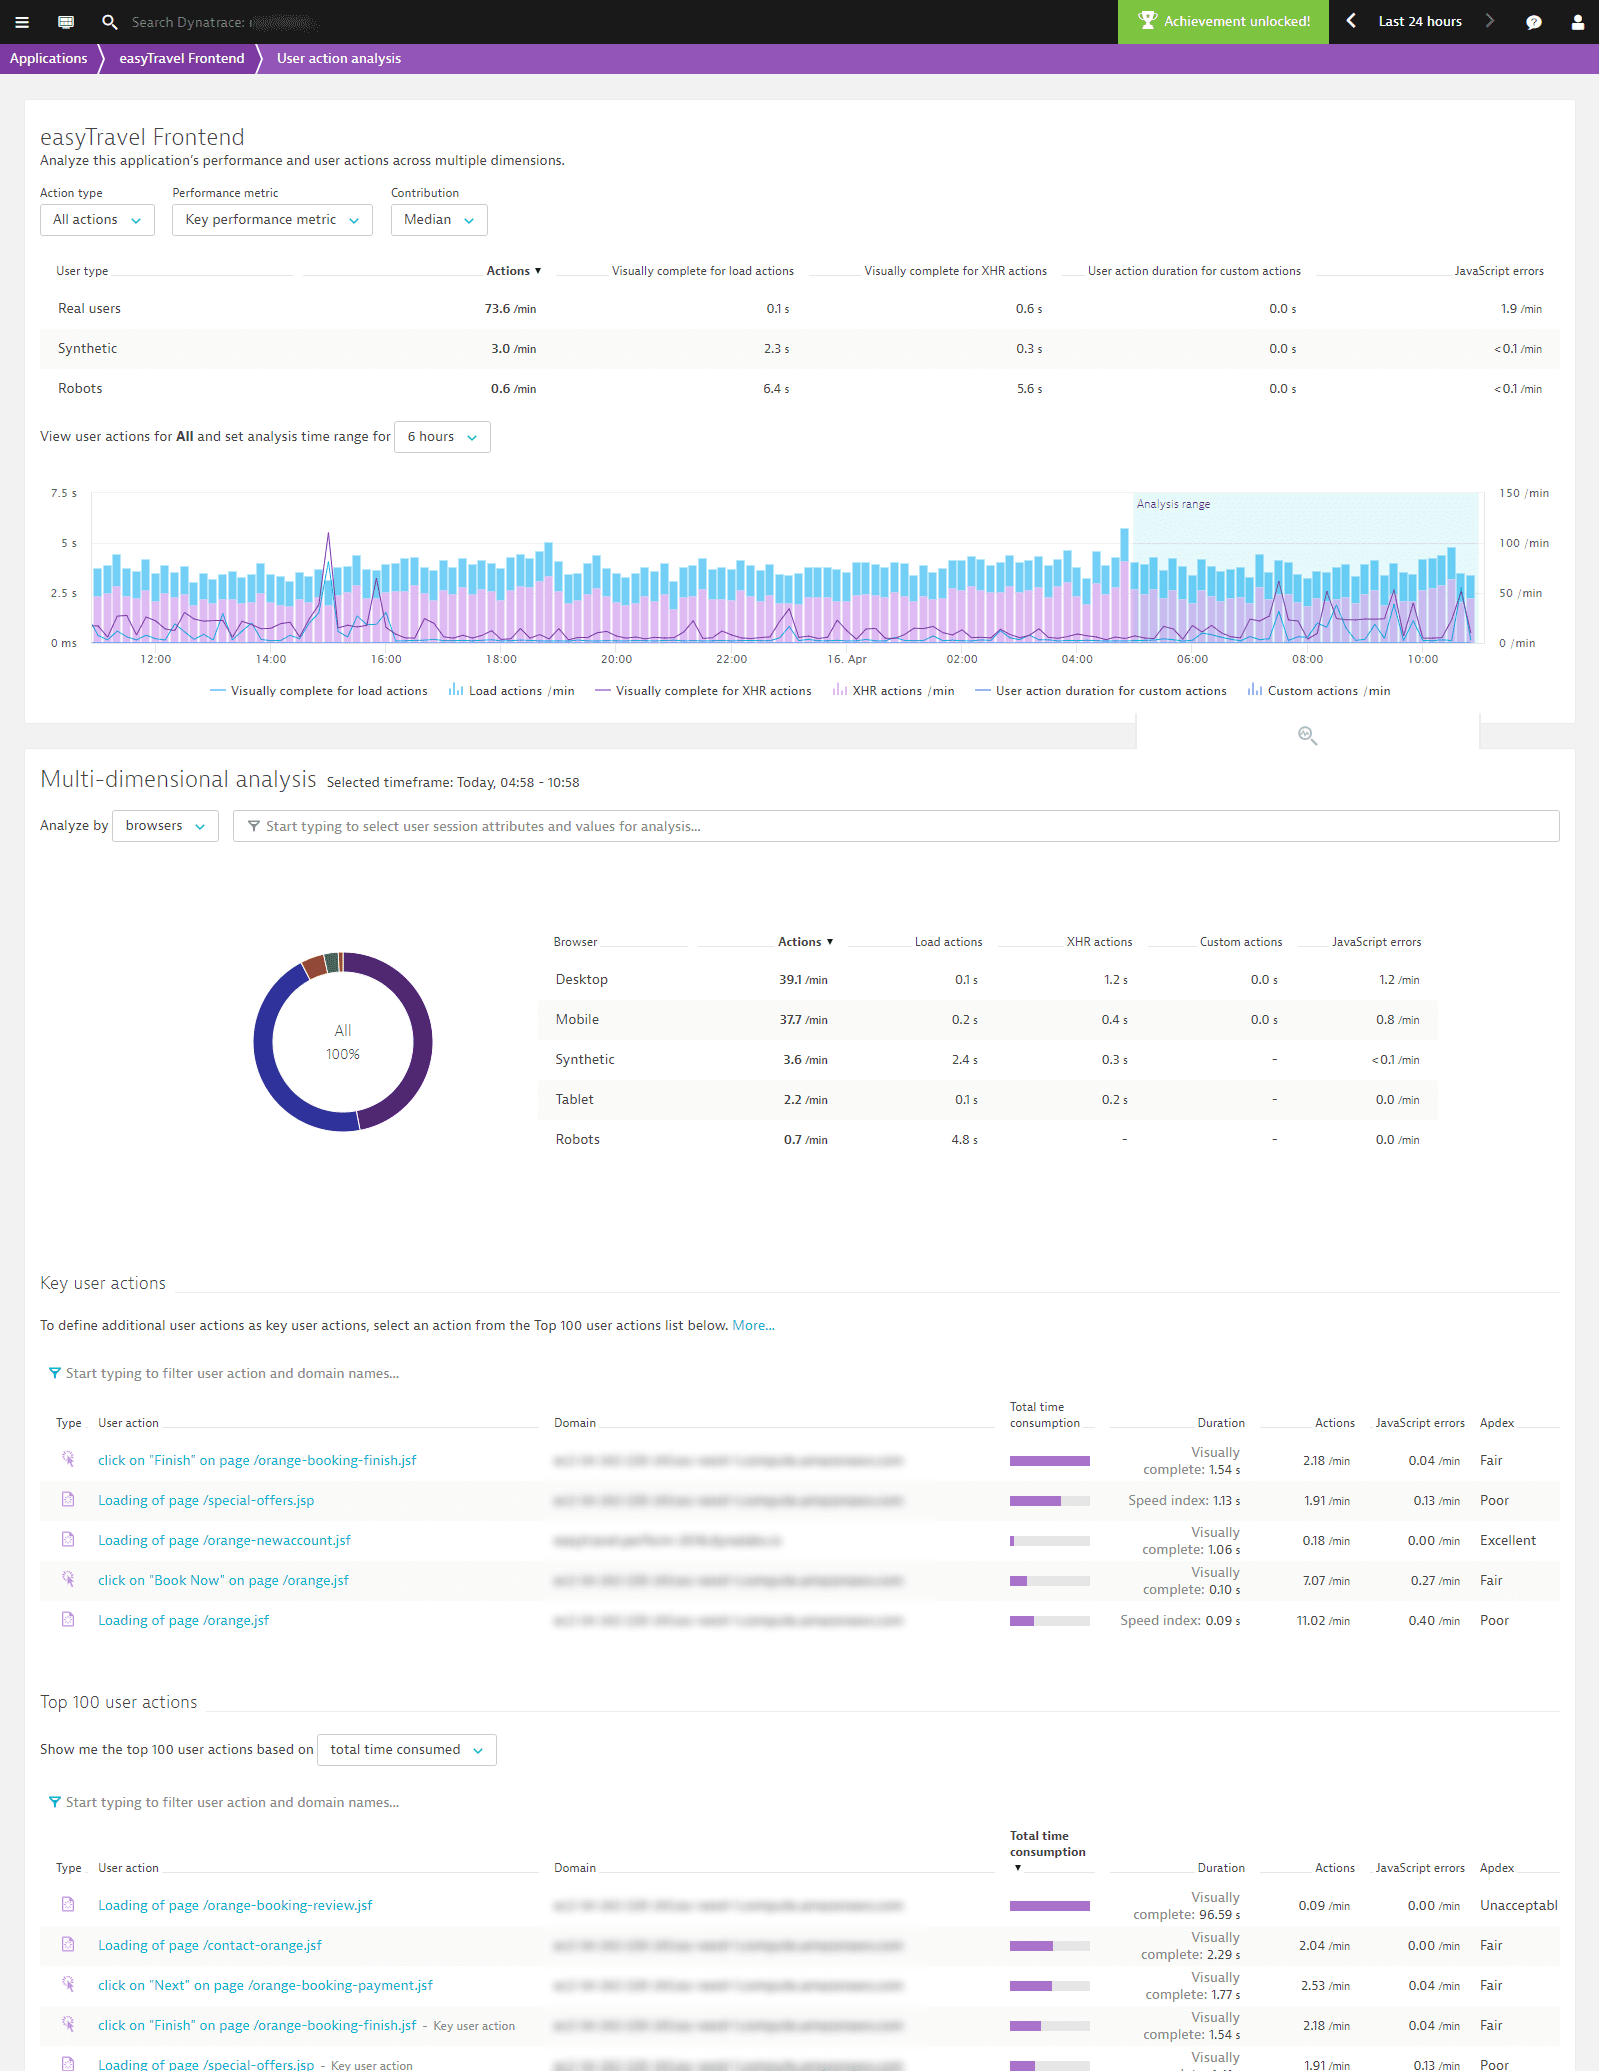
The upper section of the multidimensional User action analysis page provides primary filtering options you can use to focus analysis on specific user action types.
-
From the filter lists at the top of the page, select relevant values for filtering based on Action type, User type, Performance metric, and Contribution (see image below).
-
Select a duration for the analysis timeframe from the Analyze user actions during the past… drop list.
-
Select the timeline chart to select the timeframe you want to analyze. The lower section of the view shows the more detailed, multi-dimensional user action analytics view with all the primary filters applied.
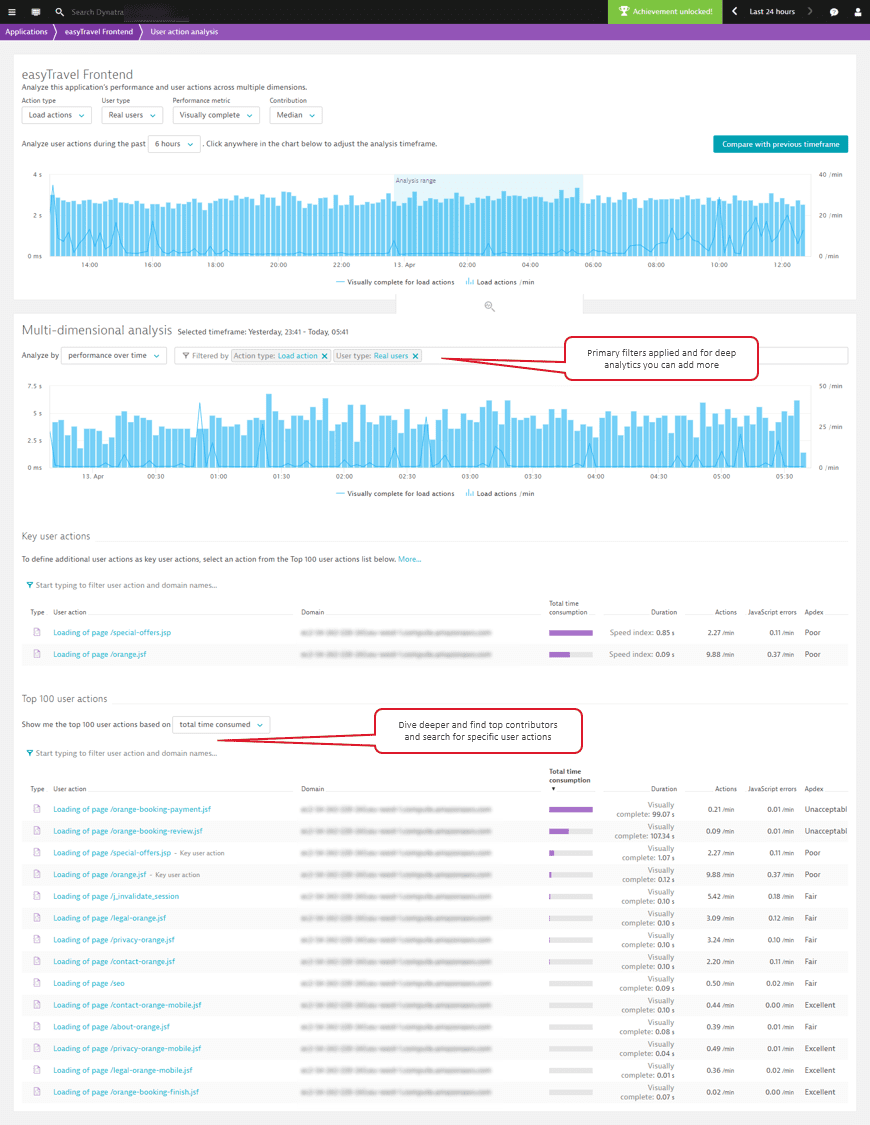
- Optional Select Filtered by to add additional filters. Filters are available for action duration, Apdex, JavaScript errors, user type, browser, location and more. Further down you’ll see a list of all the Key user actions that meet your filter criteria, along with the Top 100 user actions (this list is initially based on total time consumed, but you can also filter based on JavaScript errors, action count, or duration.
-
Select the user action you want to investigate more deeply. This takes you to the User actions view of the selected user action (Loading of page
/special-offers.jspin the example below). As you can see, the defined filters and analysis time frame are applied to the analysis on this page.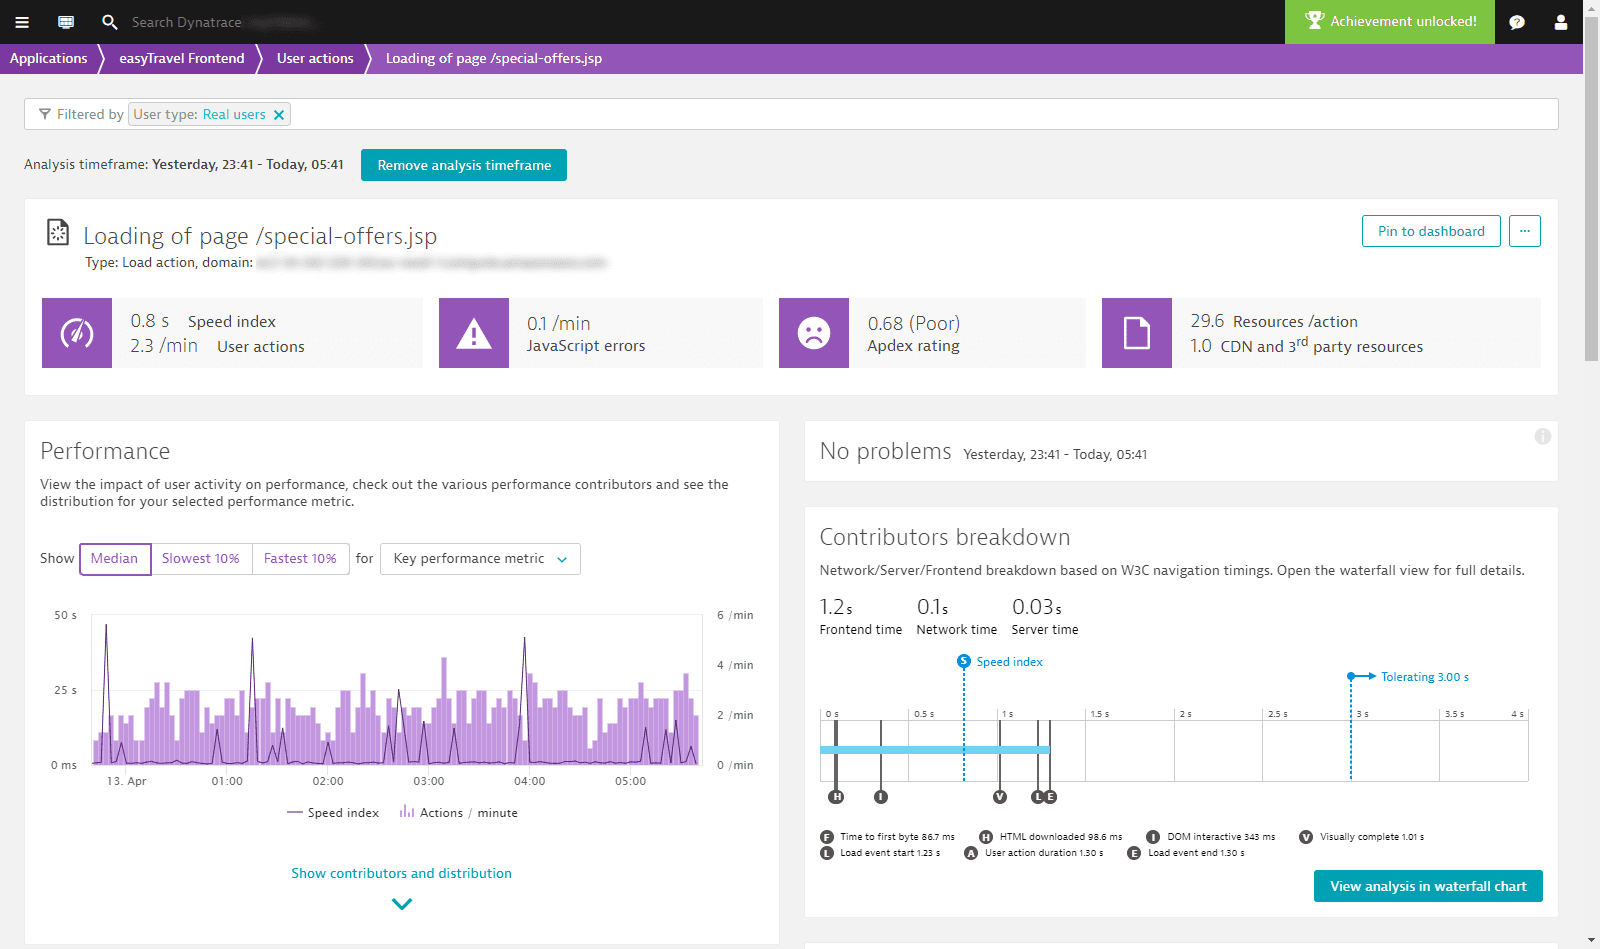 Multi-dimensional analysis
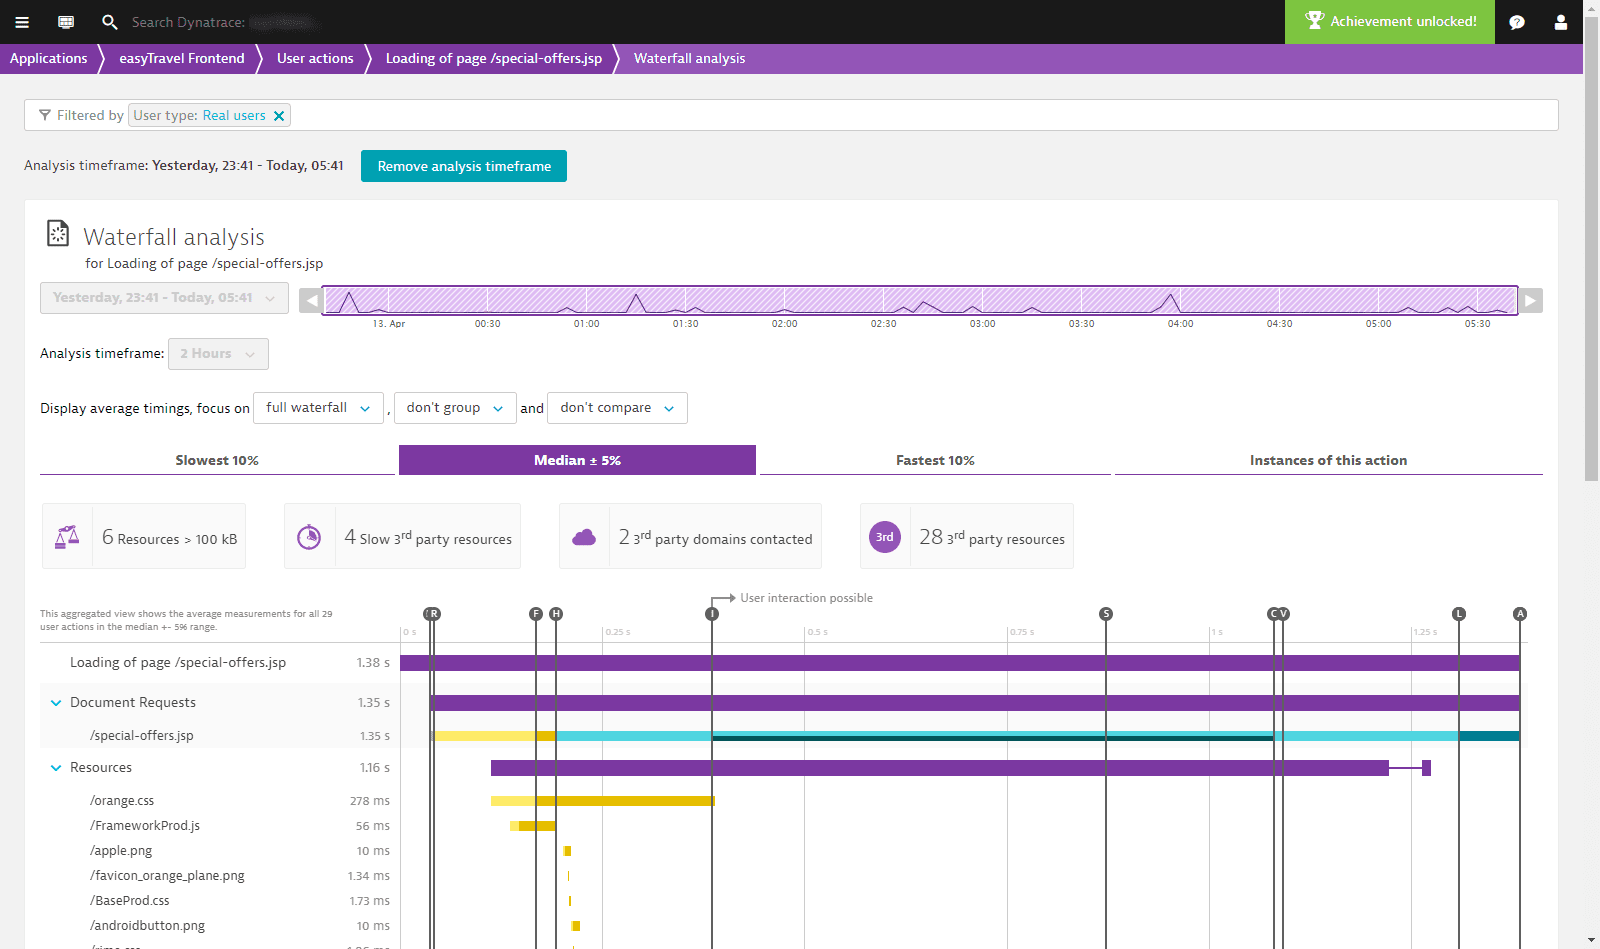
The applied filters and analysis timeframe are even carried over to the Waterfall analysis view (see below).
 Multi-dimensional analysis
Scenario 2: Analysis based on browser type
Sometimes you need to figure out if users that share the same browser type are facing the same performance issues.
To access multidimensional analysis based on browser type
-
Go to Web.
-
Select the application you want to analyze.
-
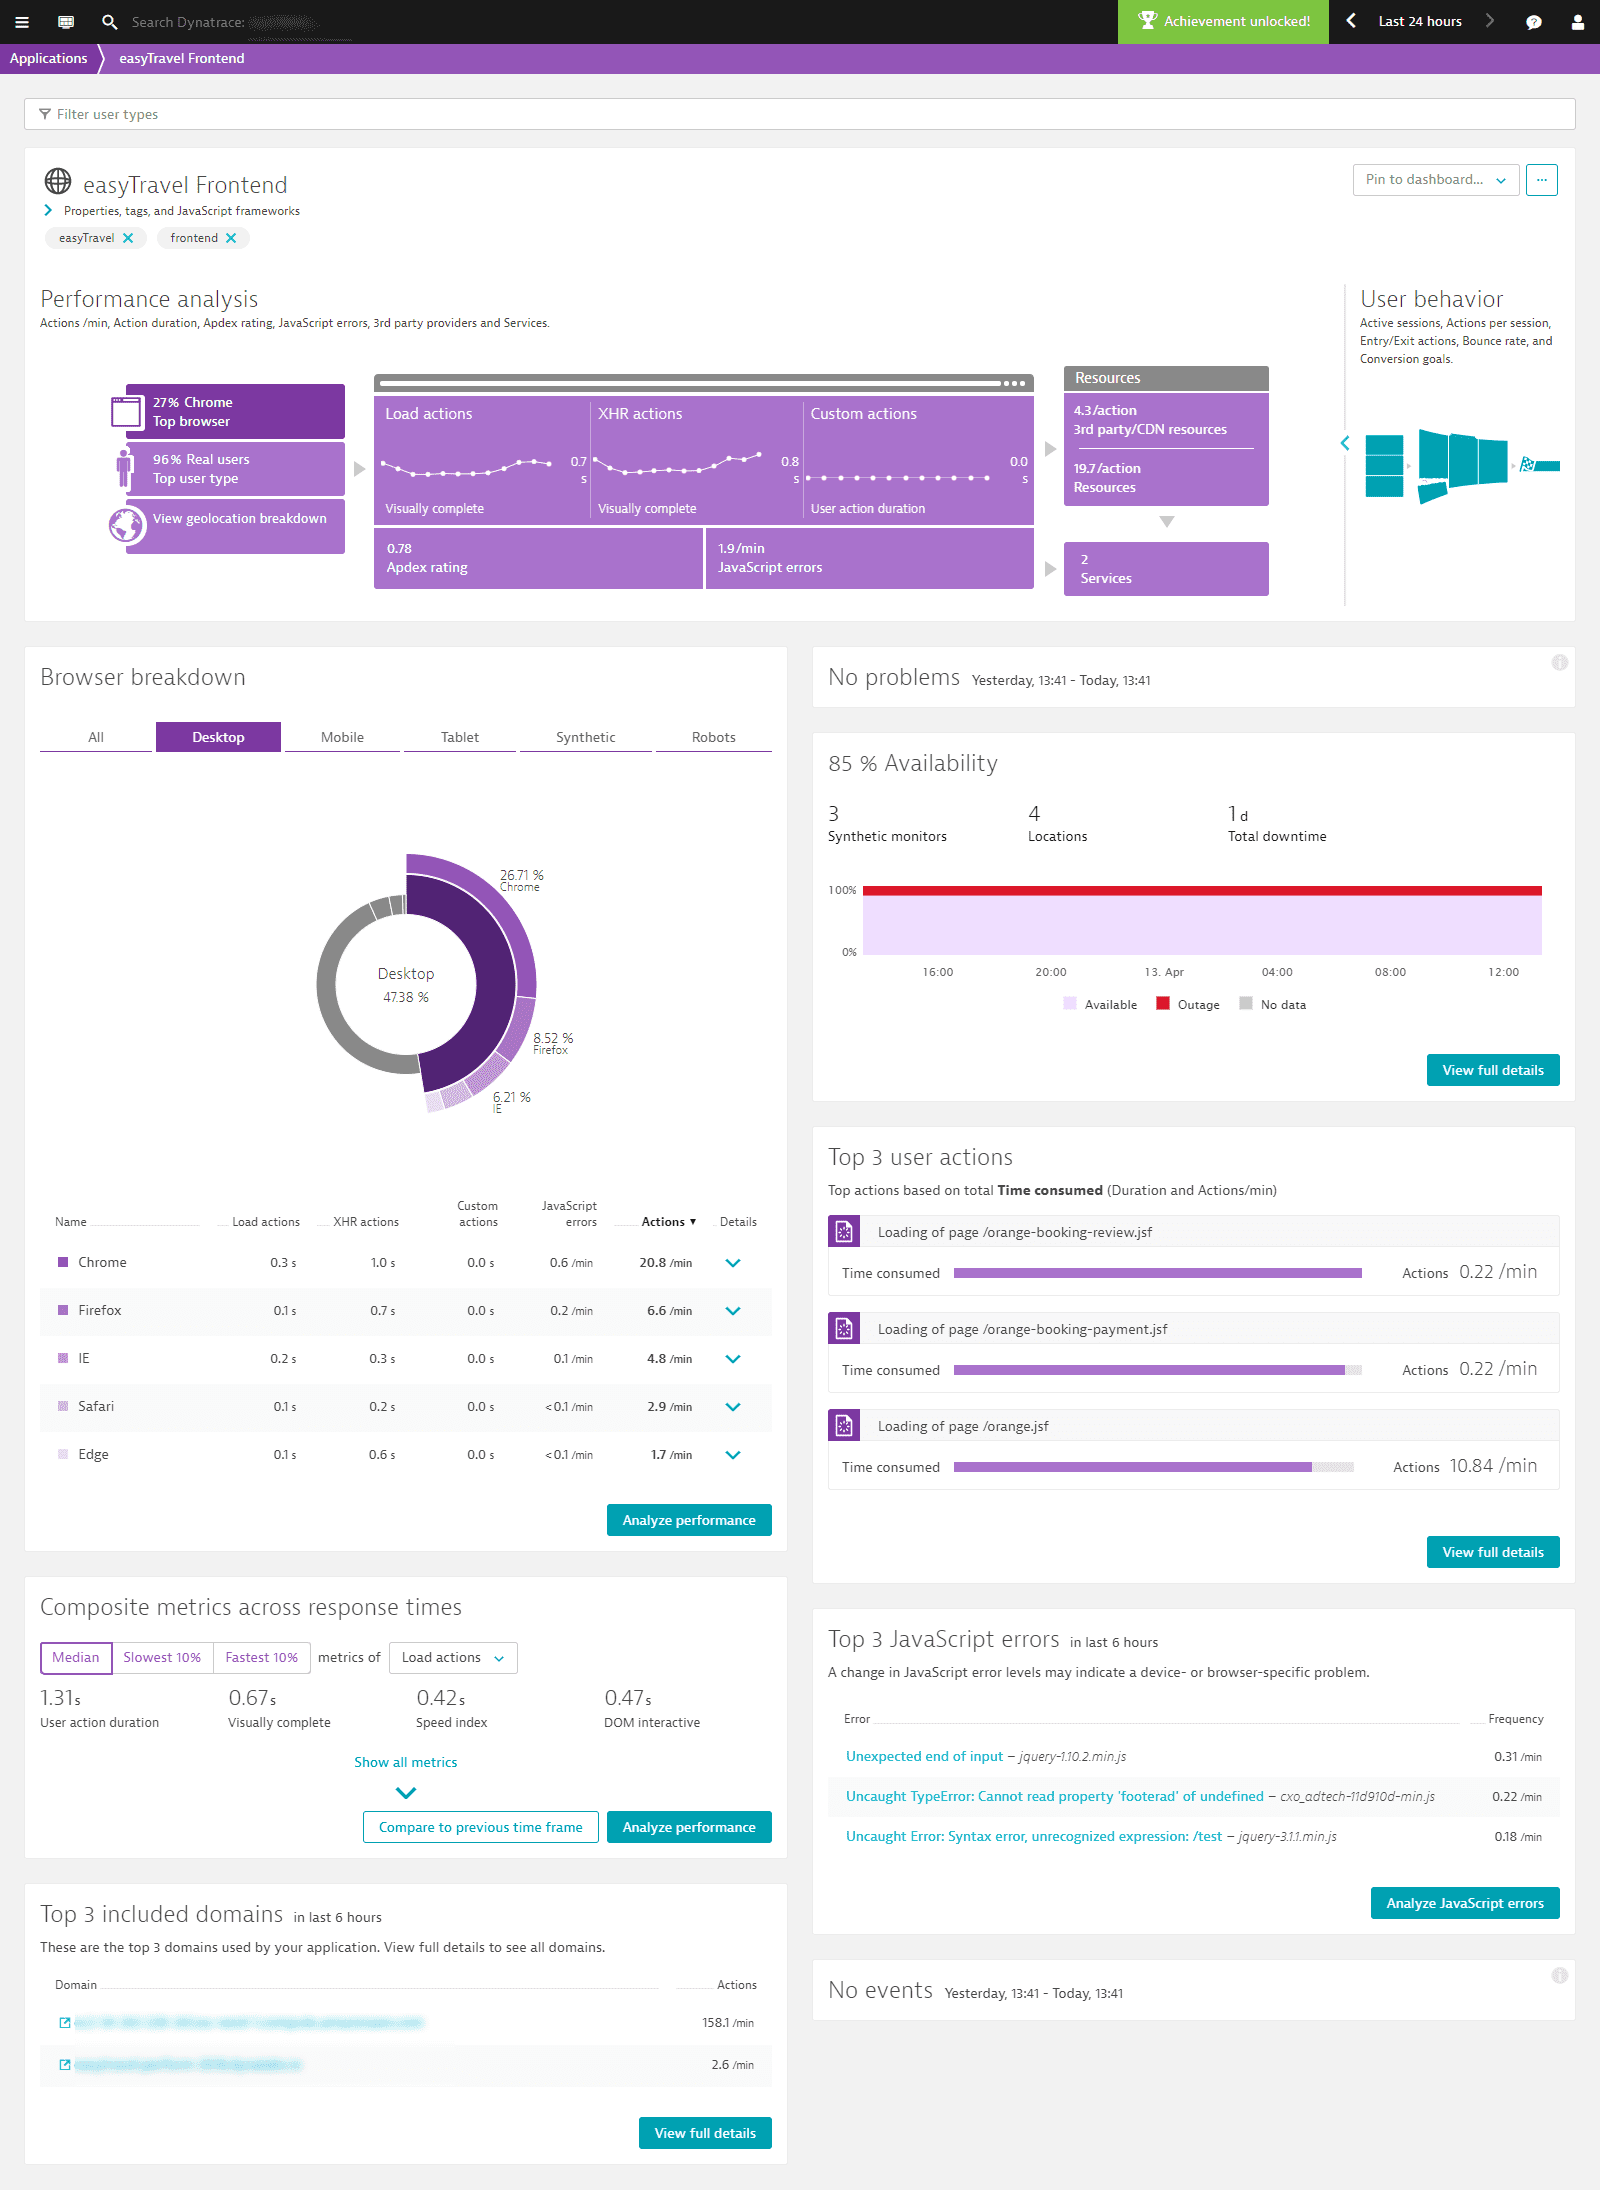
Within the Performance analysis infographic, select the Top browser tile in the upper-left corner to display the Browser breakdown section.
-
Select Analyze performance at the bottom of the section.
 Multi-dimensional analysis
This takes you to the Multidimensional analysis view, where the analysis mode is set to Browsers (see below).
-
From the filter lists at the top of the page, select relevant values for filtering based on Action type, User / browser type, Performance metric, and Contribution.
 Multi-dimensional analysis
 -
Select a duration from the analysis time range drop list.
-
Select the timeline chart to select the timeframe you want to analyze. From here, you can pinpoint and analyze only those user actions you they relevant to your analysis.
Scenario 3: Analysis based on user type
Sometimes you want to learn more about the bots that crawl your website, perhaps because your company is working toward Search Engine Optimization (SEO), or you just want to see a “clean room request” made via Synthetic monitoring.
To access multidimensional analysis based on user type
-
Go to Web.
-
Select the application you want to analyze.
-
Within the Performance analysis infographic, select the Top user type tile in the upper-left corner to display the User type section.
-
Select the Analyze performance at the bottom of the section.
 Multi-dimensional analysis
This takes you to multi-dimensional User action analysis view, which highlights the different user types that have performed the user actions under analysis. The Analyze by list in the Multidimensional analysis section is preset to Browsers.
-
From the filter lists at the top of the page, select relevant values for filtering based on Action type, Performance metric, and Contribution.
 Multi-dimensional analysis
 -
Select a duration from the analysis timeframe range drop list.
-
Select the timeline chart to select the timeframe you want to analyze. From here, you can pinpoint and analyze only those user actions that you’re most interested in.
Scenario 4: Analysis based on geolocation
In this scenario, the focus is on finding user actions from a specific geographic region. Let’s say you’ve added a Content Delivery Network (CDN) for a certain region and want insights into how well the new CDN is working.
To access multidimensional analysis based on geolocation
-
Go to Web.
-
Select the application you want to analyze.
-
Within the Performance analysis infographic, select the View geolocation breakdown tile in the lower-left corner to display the Geolocation breakdown section.
-
Select Analyze performance at the bottom of the section.
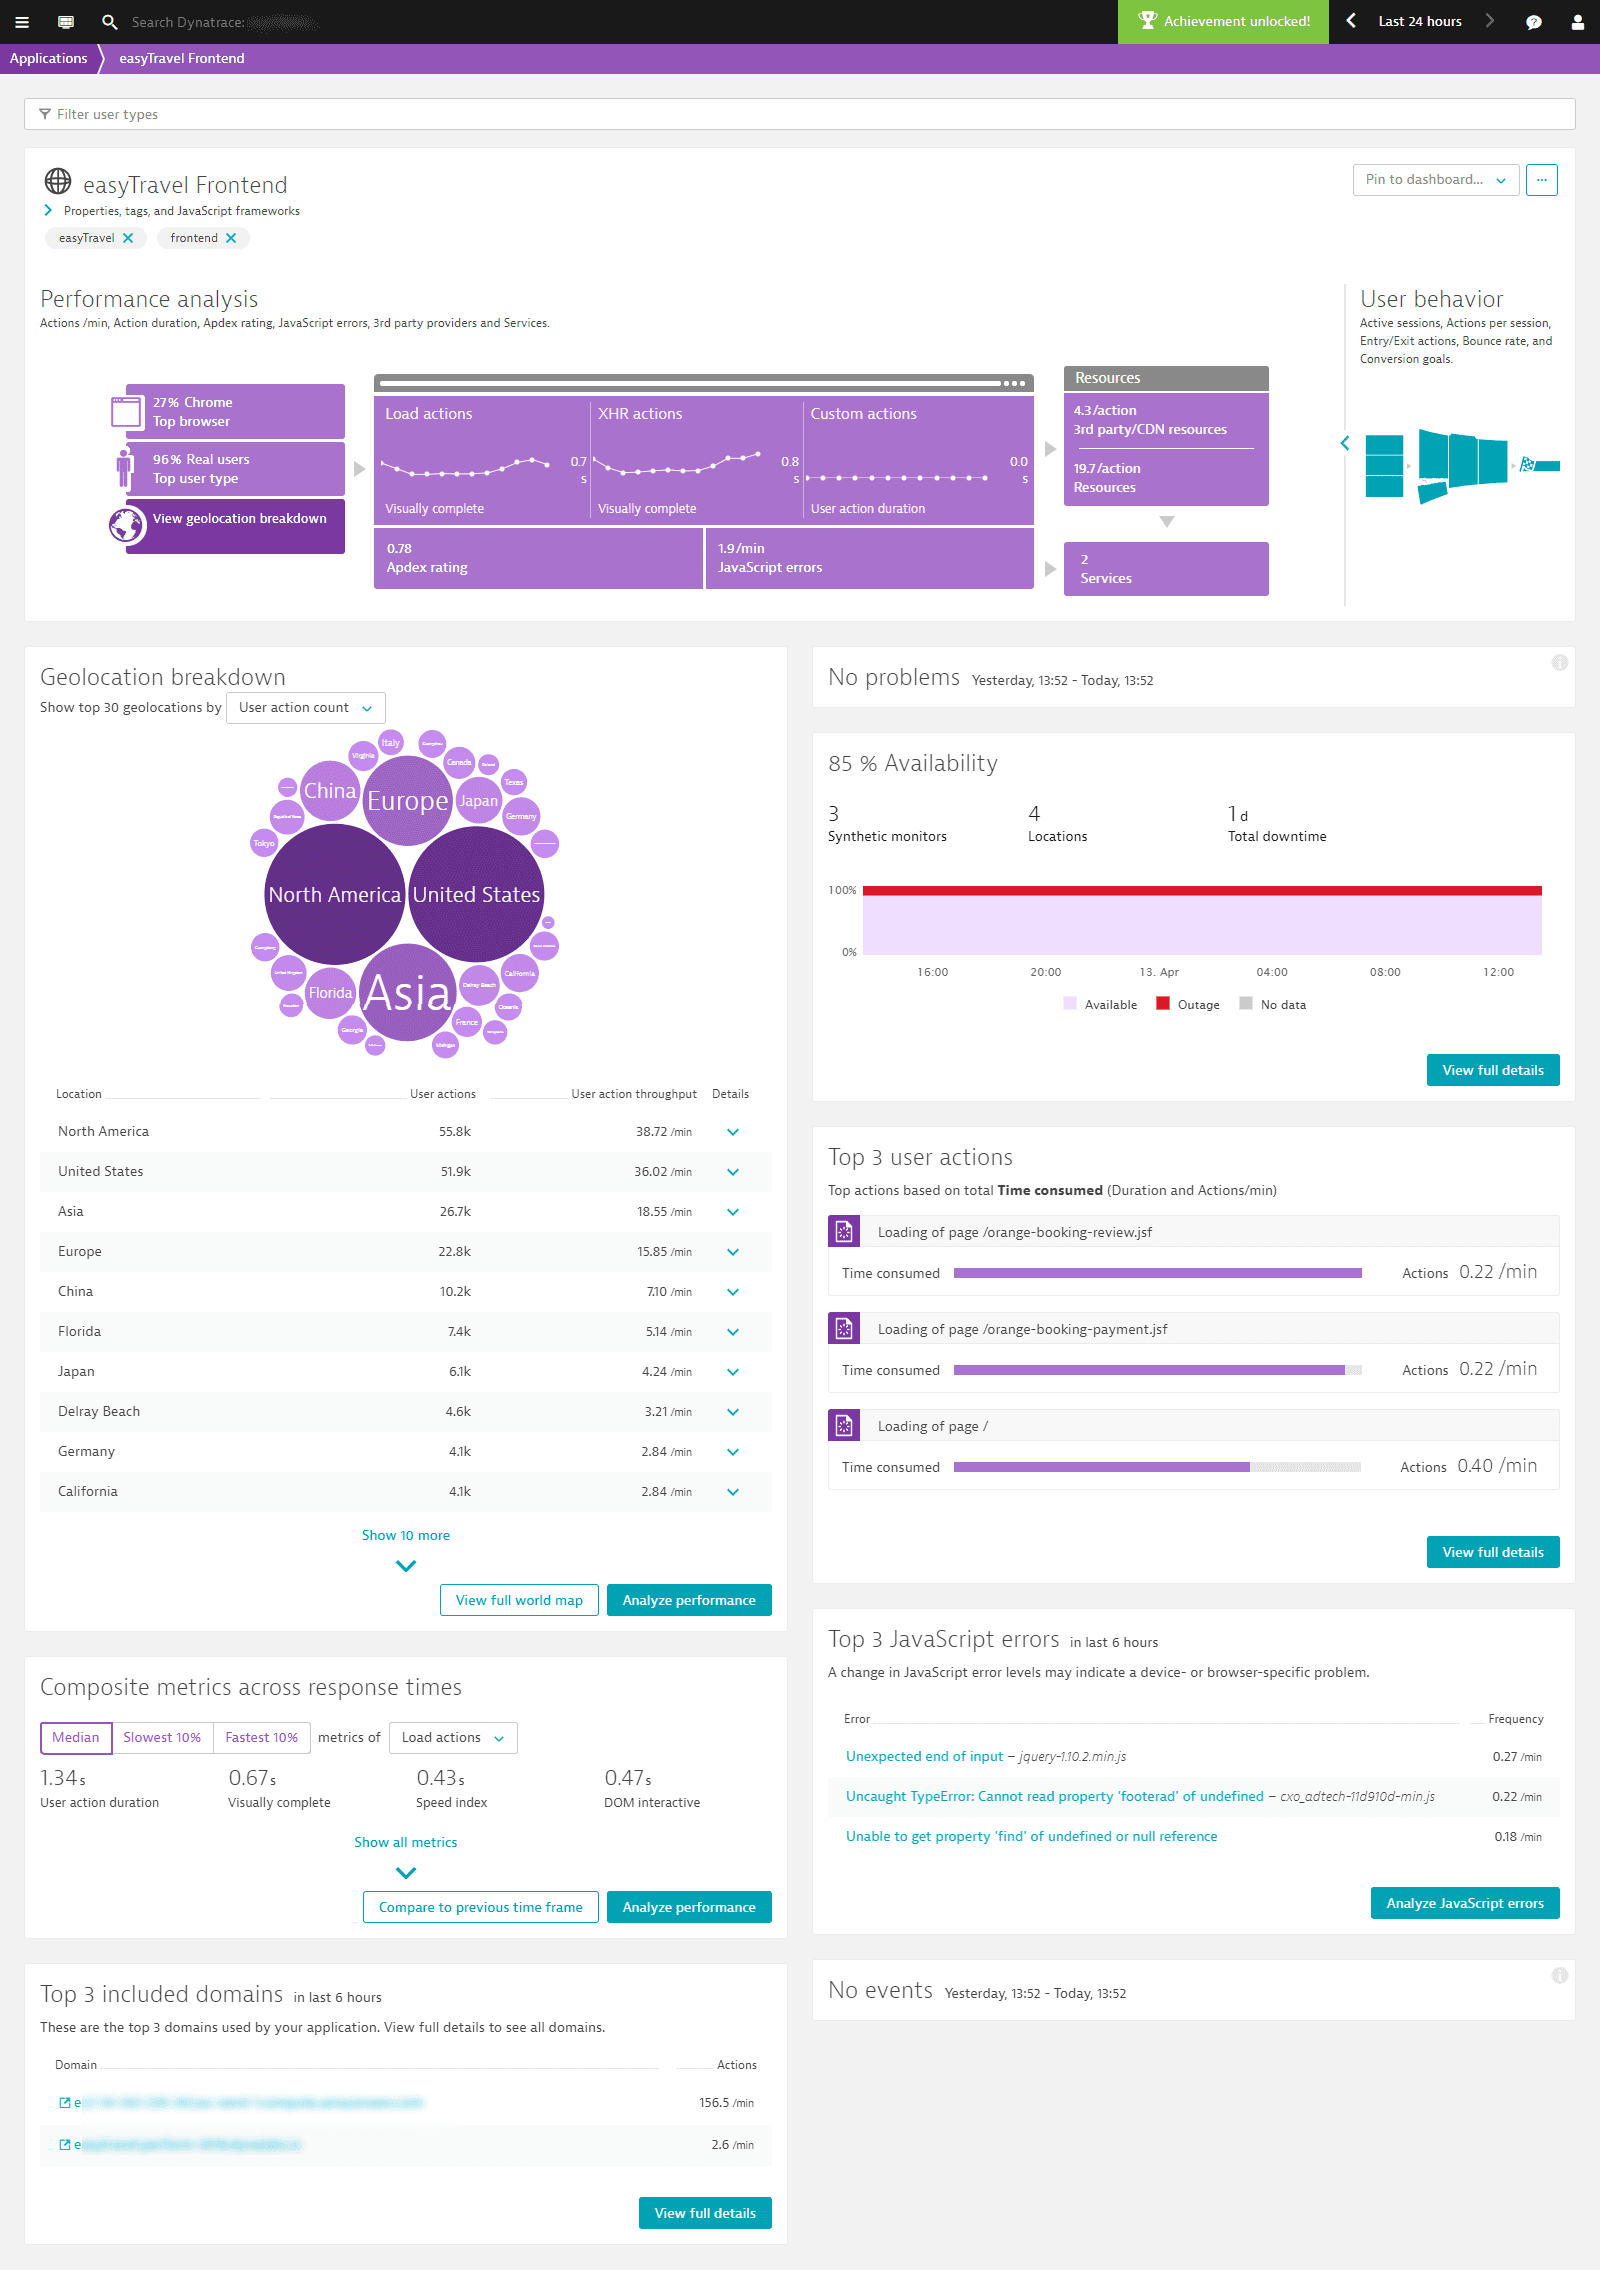 Multi-dimensional analysis
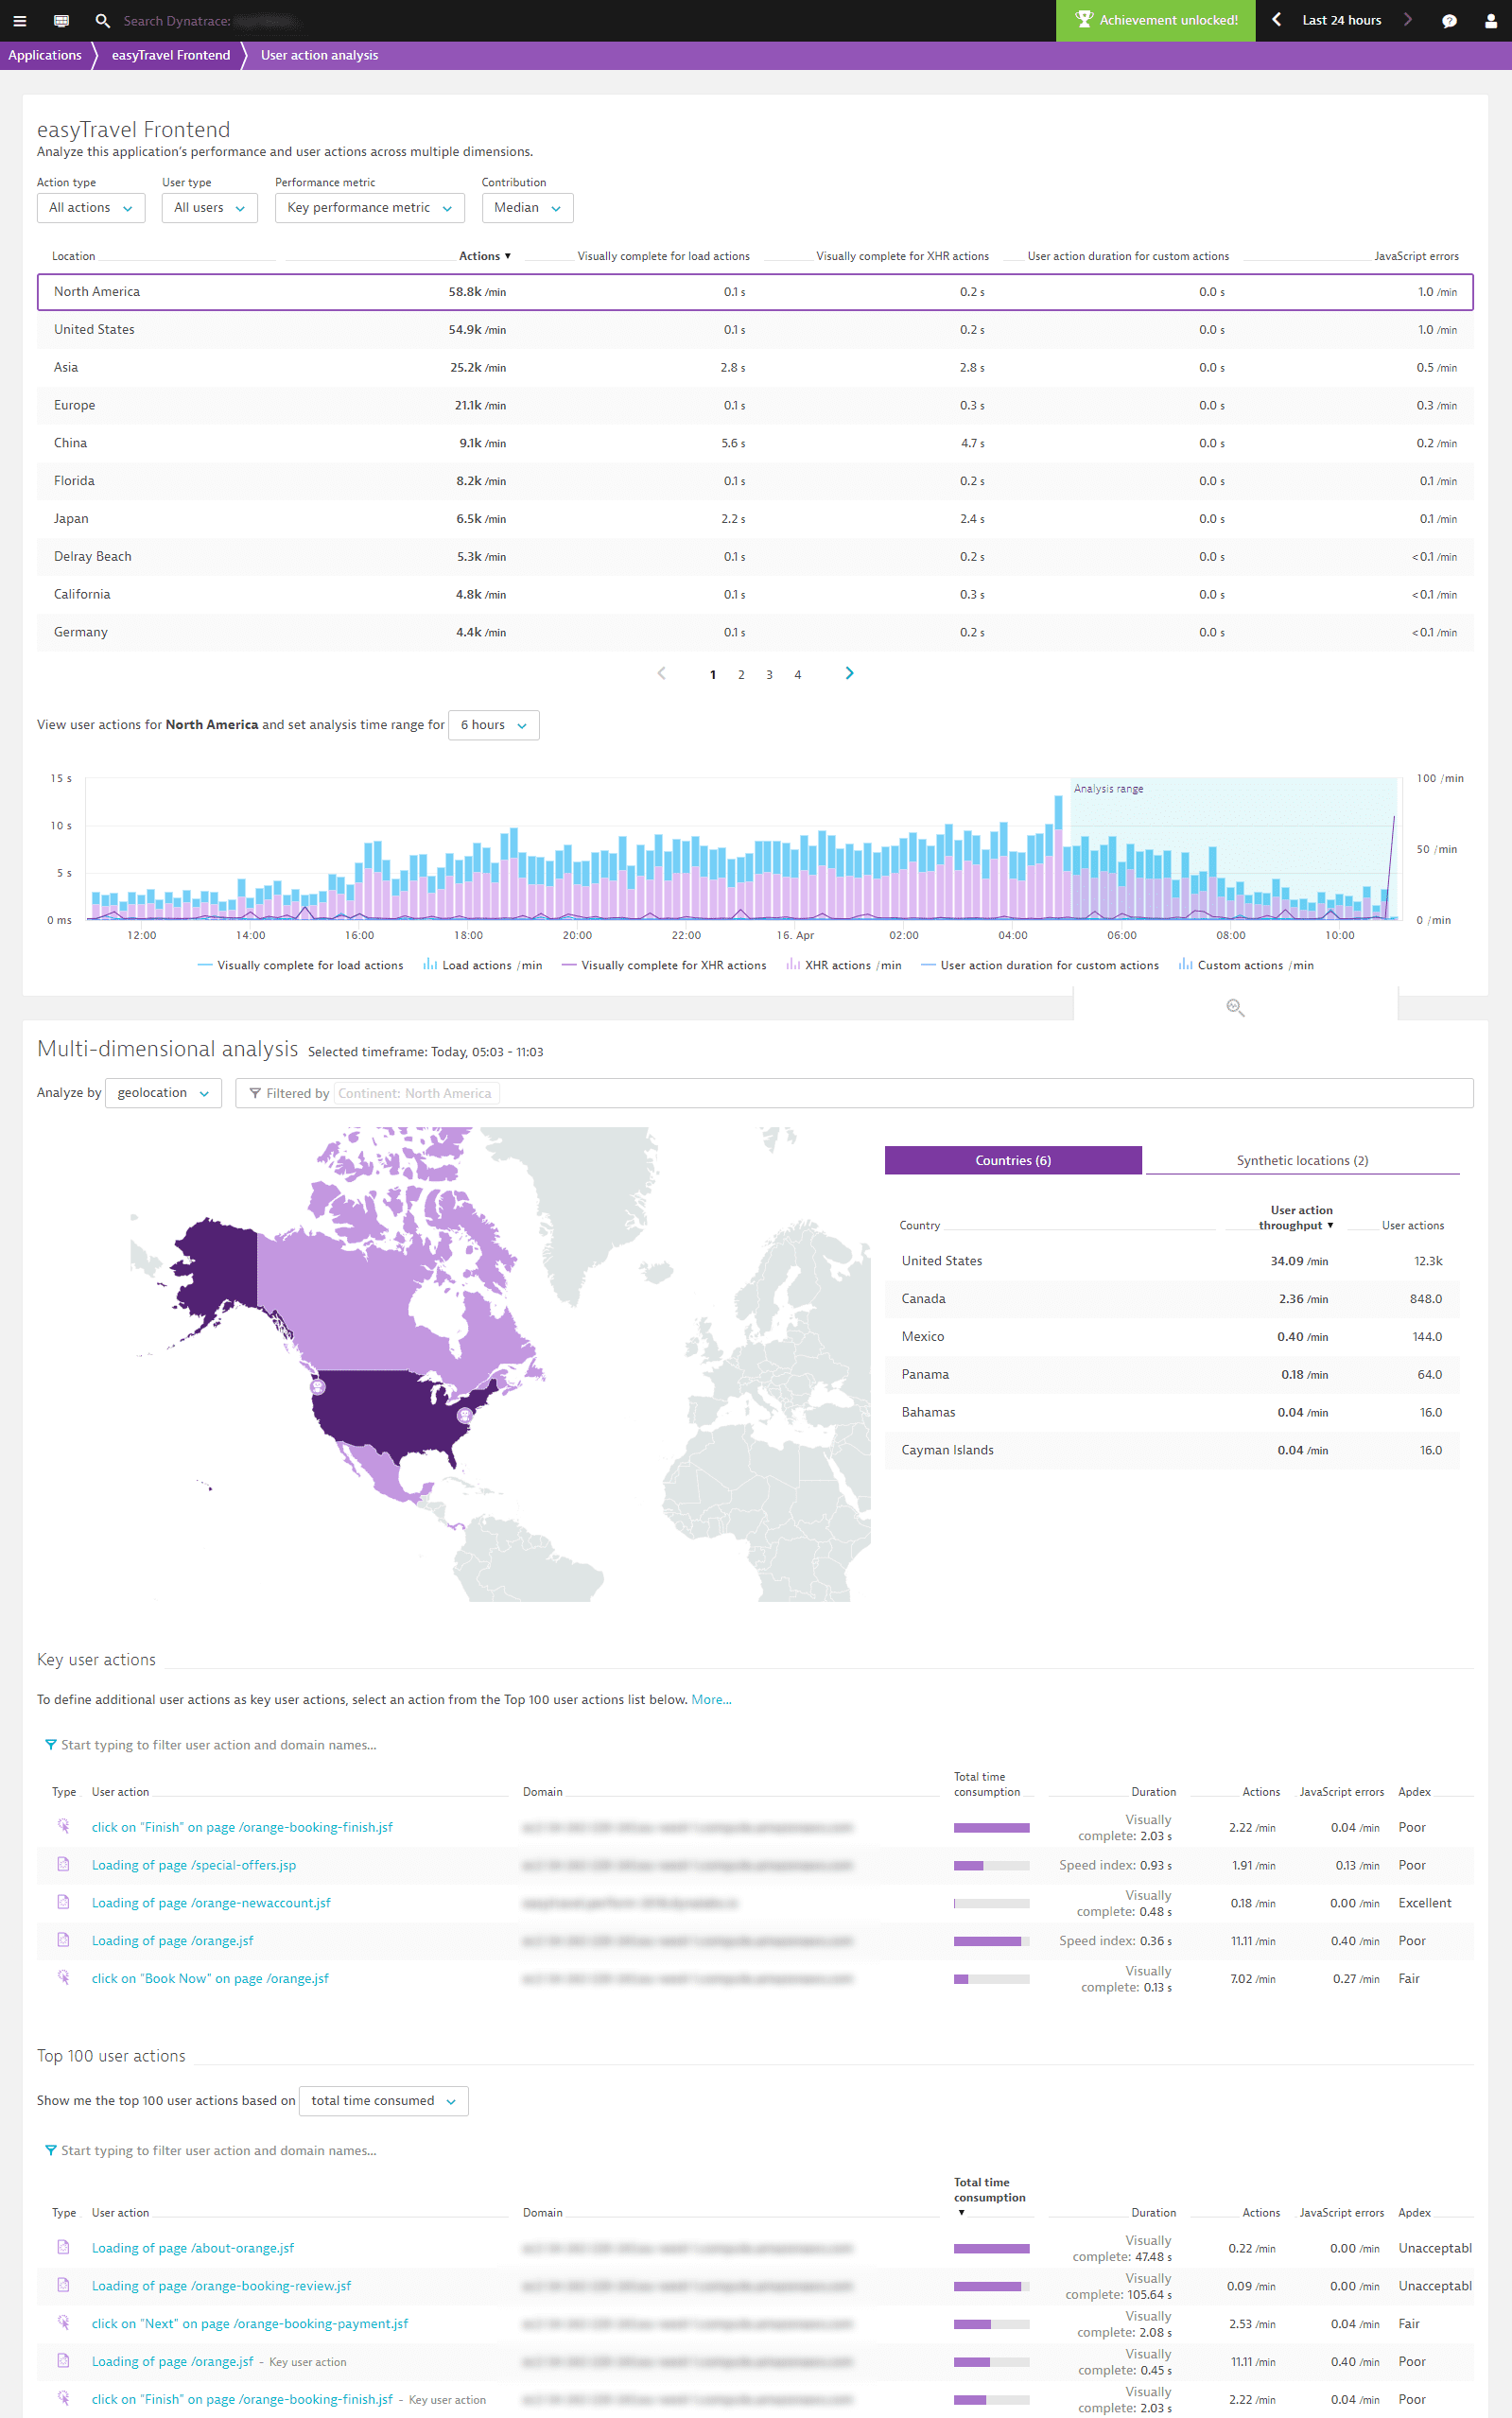
This takes you to multidimensional User action analysis view, which now shows the top geolocations where your user actions originate from.
-
From the filter lists at the top of the page, select relevant values for filtering based on Action type, User type, Performance metric, and Contribution.
-
Select a duration from the analysis time range drop list.
-
Select the timeline chart to select the timeframe you want to analyze. From here, you can pinpoint and analyze only those user actions that are relevant to your analysis.
Scenario 5: Analysis based on error type
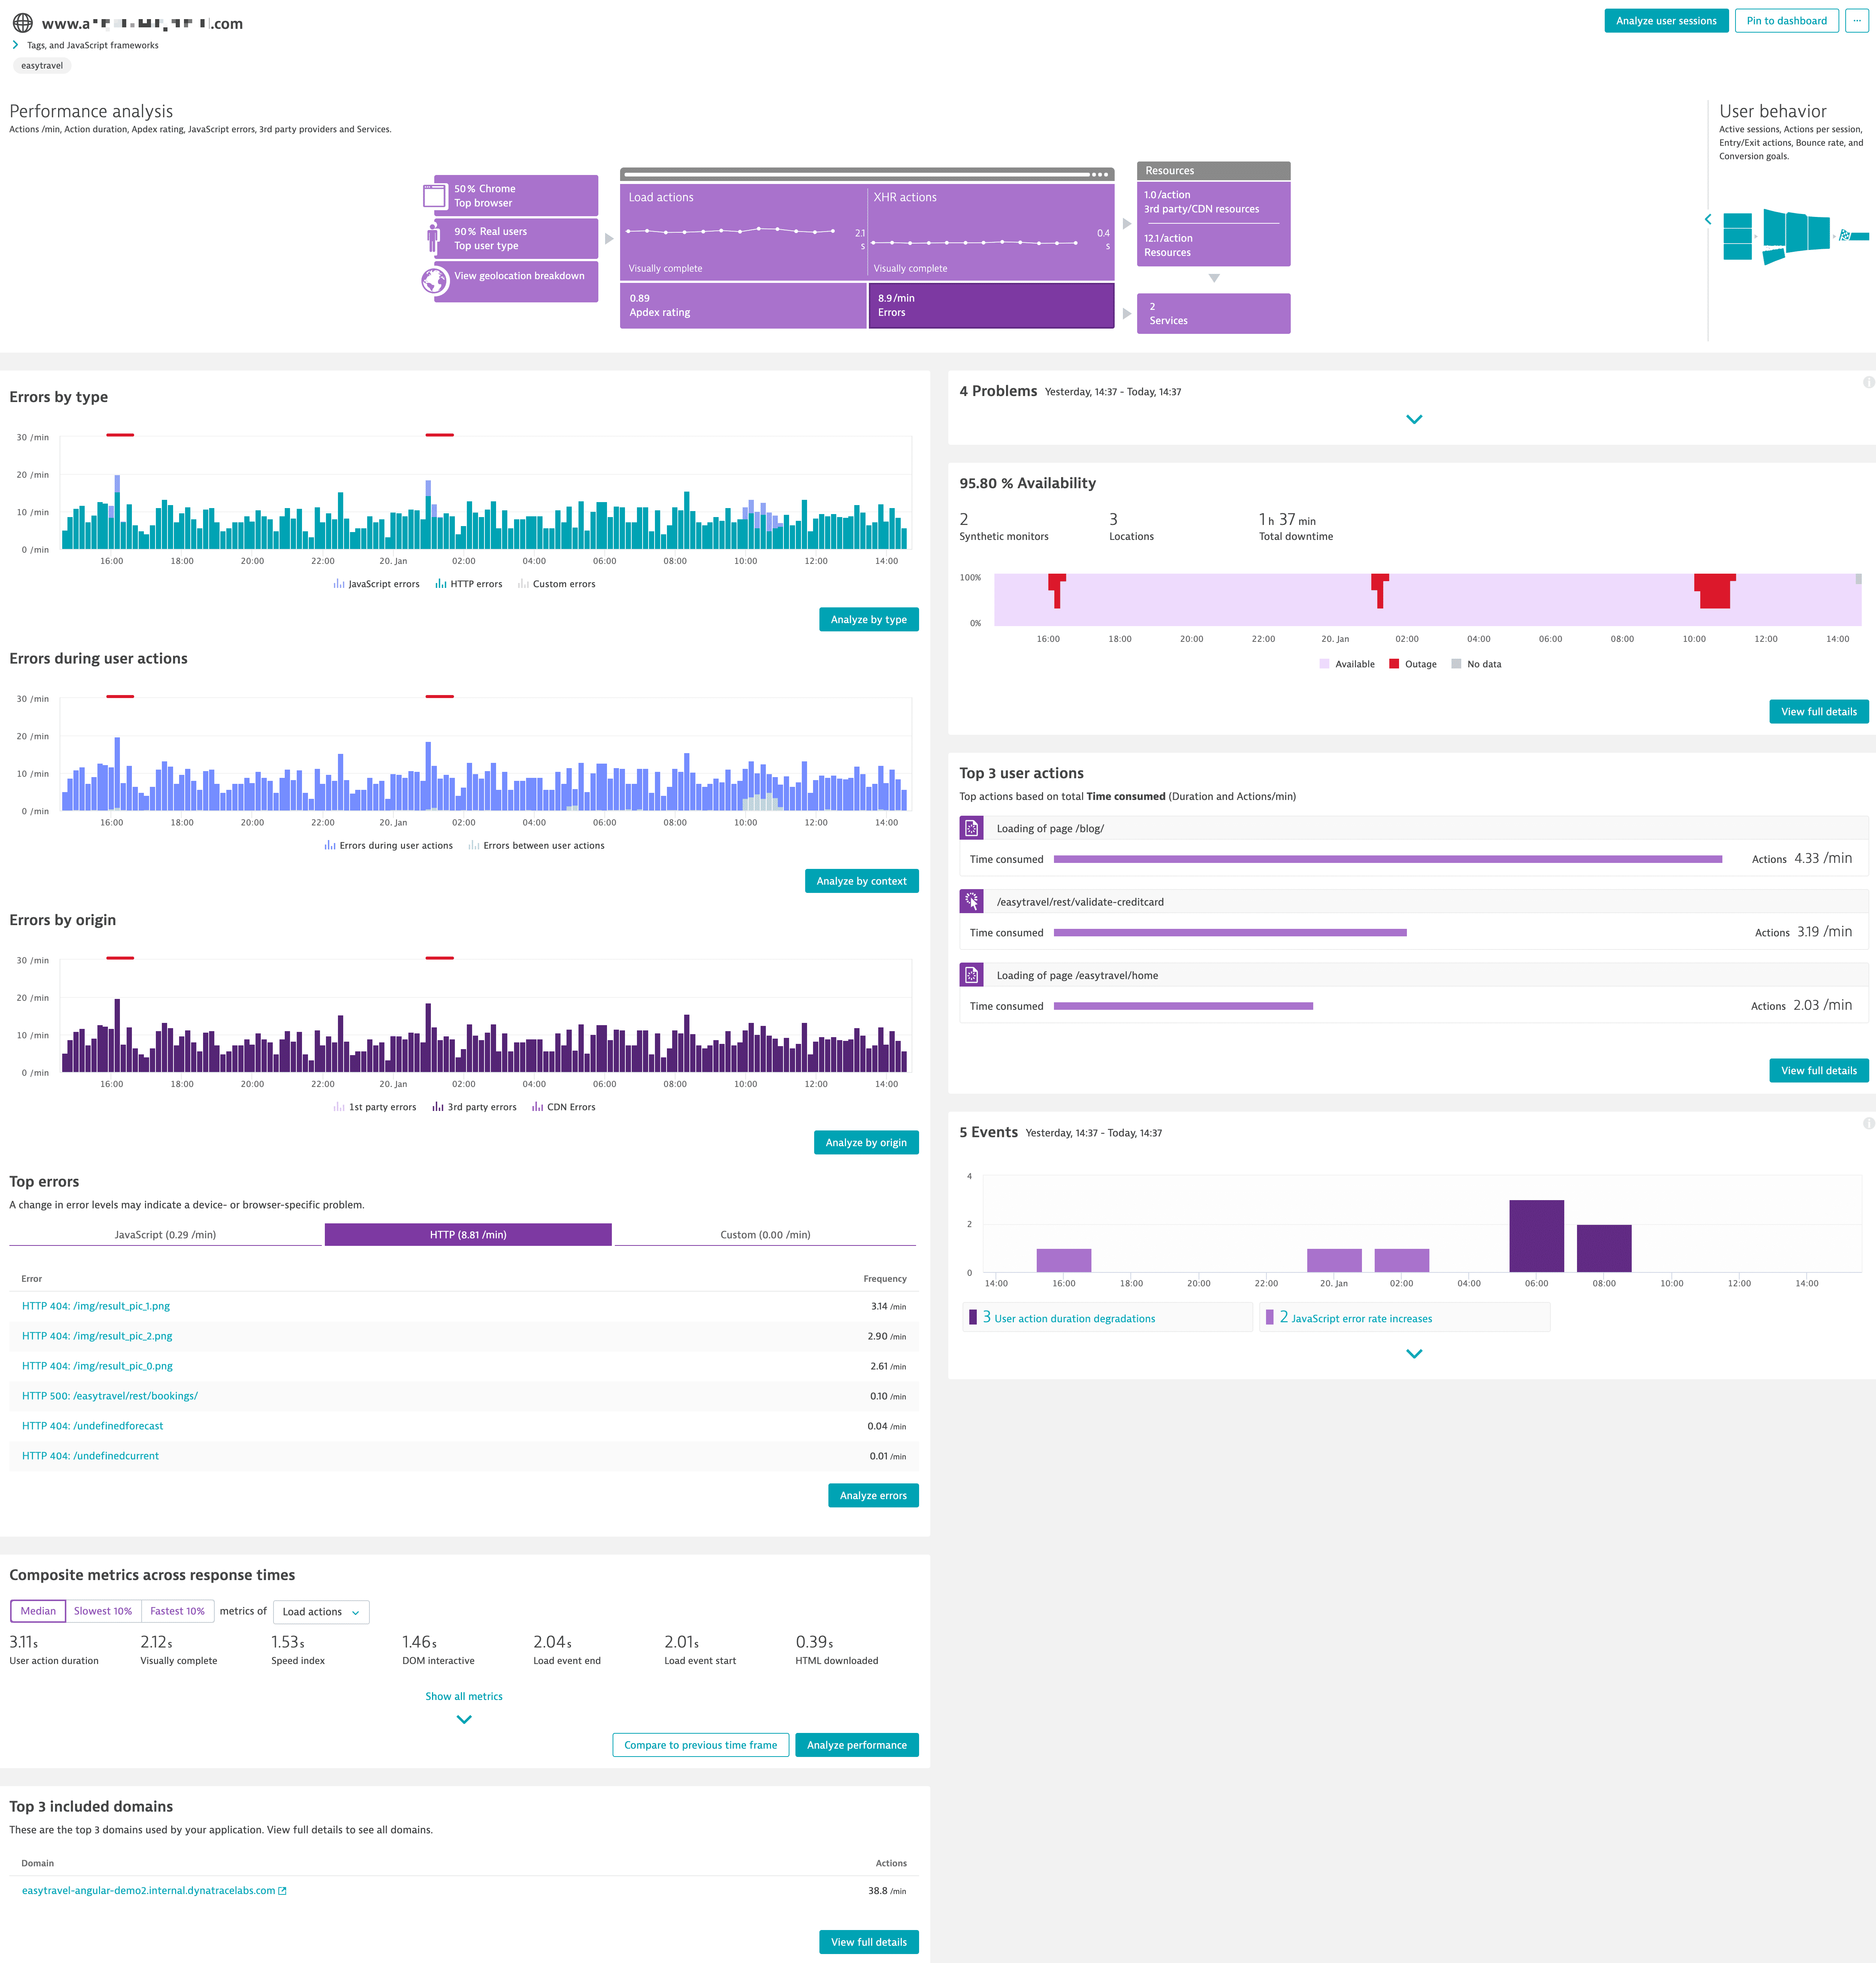
For web applications, Dynatrace classifies errors as Request, Custom, and JavaScript errors, allowing you to apply filters and analyze them categorically. You can therefore conduct a focused and contextual analysis of each type of error detected within a selected timeframe
To access multidimensional analysis based on errors
- Go to Web.
- Select the application you want to analyze.
- In the Performance analysis infographic, select the Errors by type tile at the lower-left corner to view the top Request, Custom, and JavaScript errors.
- Select Analyze errors to go to the Multidimensional analysis: Errors page.
- Apply filters to view specific errors in the selected timeframe by selecting them from the following list boxes:
- Error type:
Request,Custom, andJavaScript - Context:
Errors during user actionsandErrors between user actions - Origin:
1st party errors,3rd party errors, andCDN errors
- Error type:
- Select Show your errors by
Type,Context, orOrigin. - Select a time duration from the analysis range list box.
- Select the timeline chart to select the timeframe and slide along the timeline to select the range you want to analyze. From here, you can narrow down and analyze only the errors that are relevant to your analysis.
- Optional Select the respective error type in the legend to hide or show the respective error type in the chart.
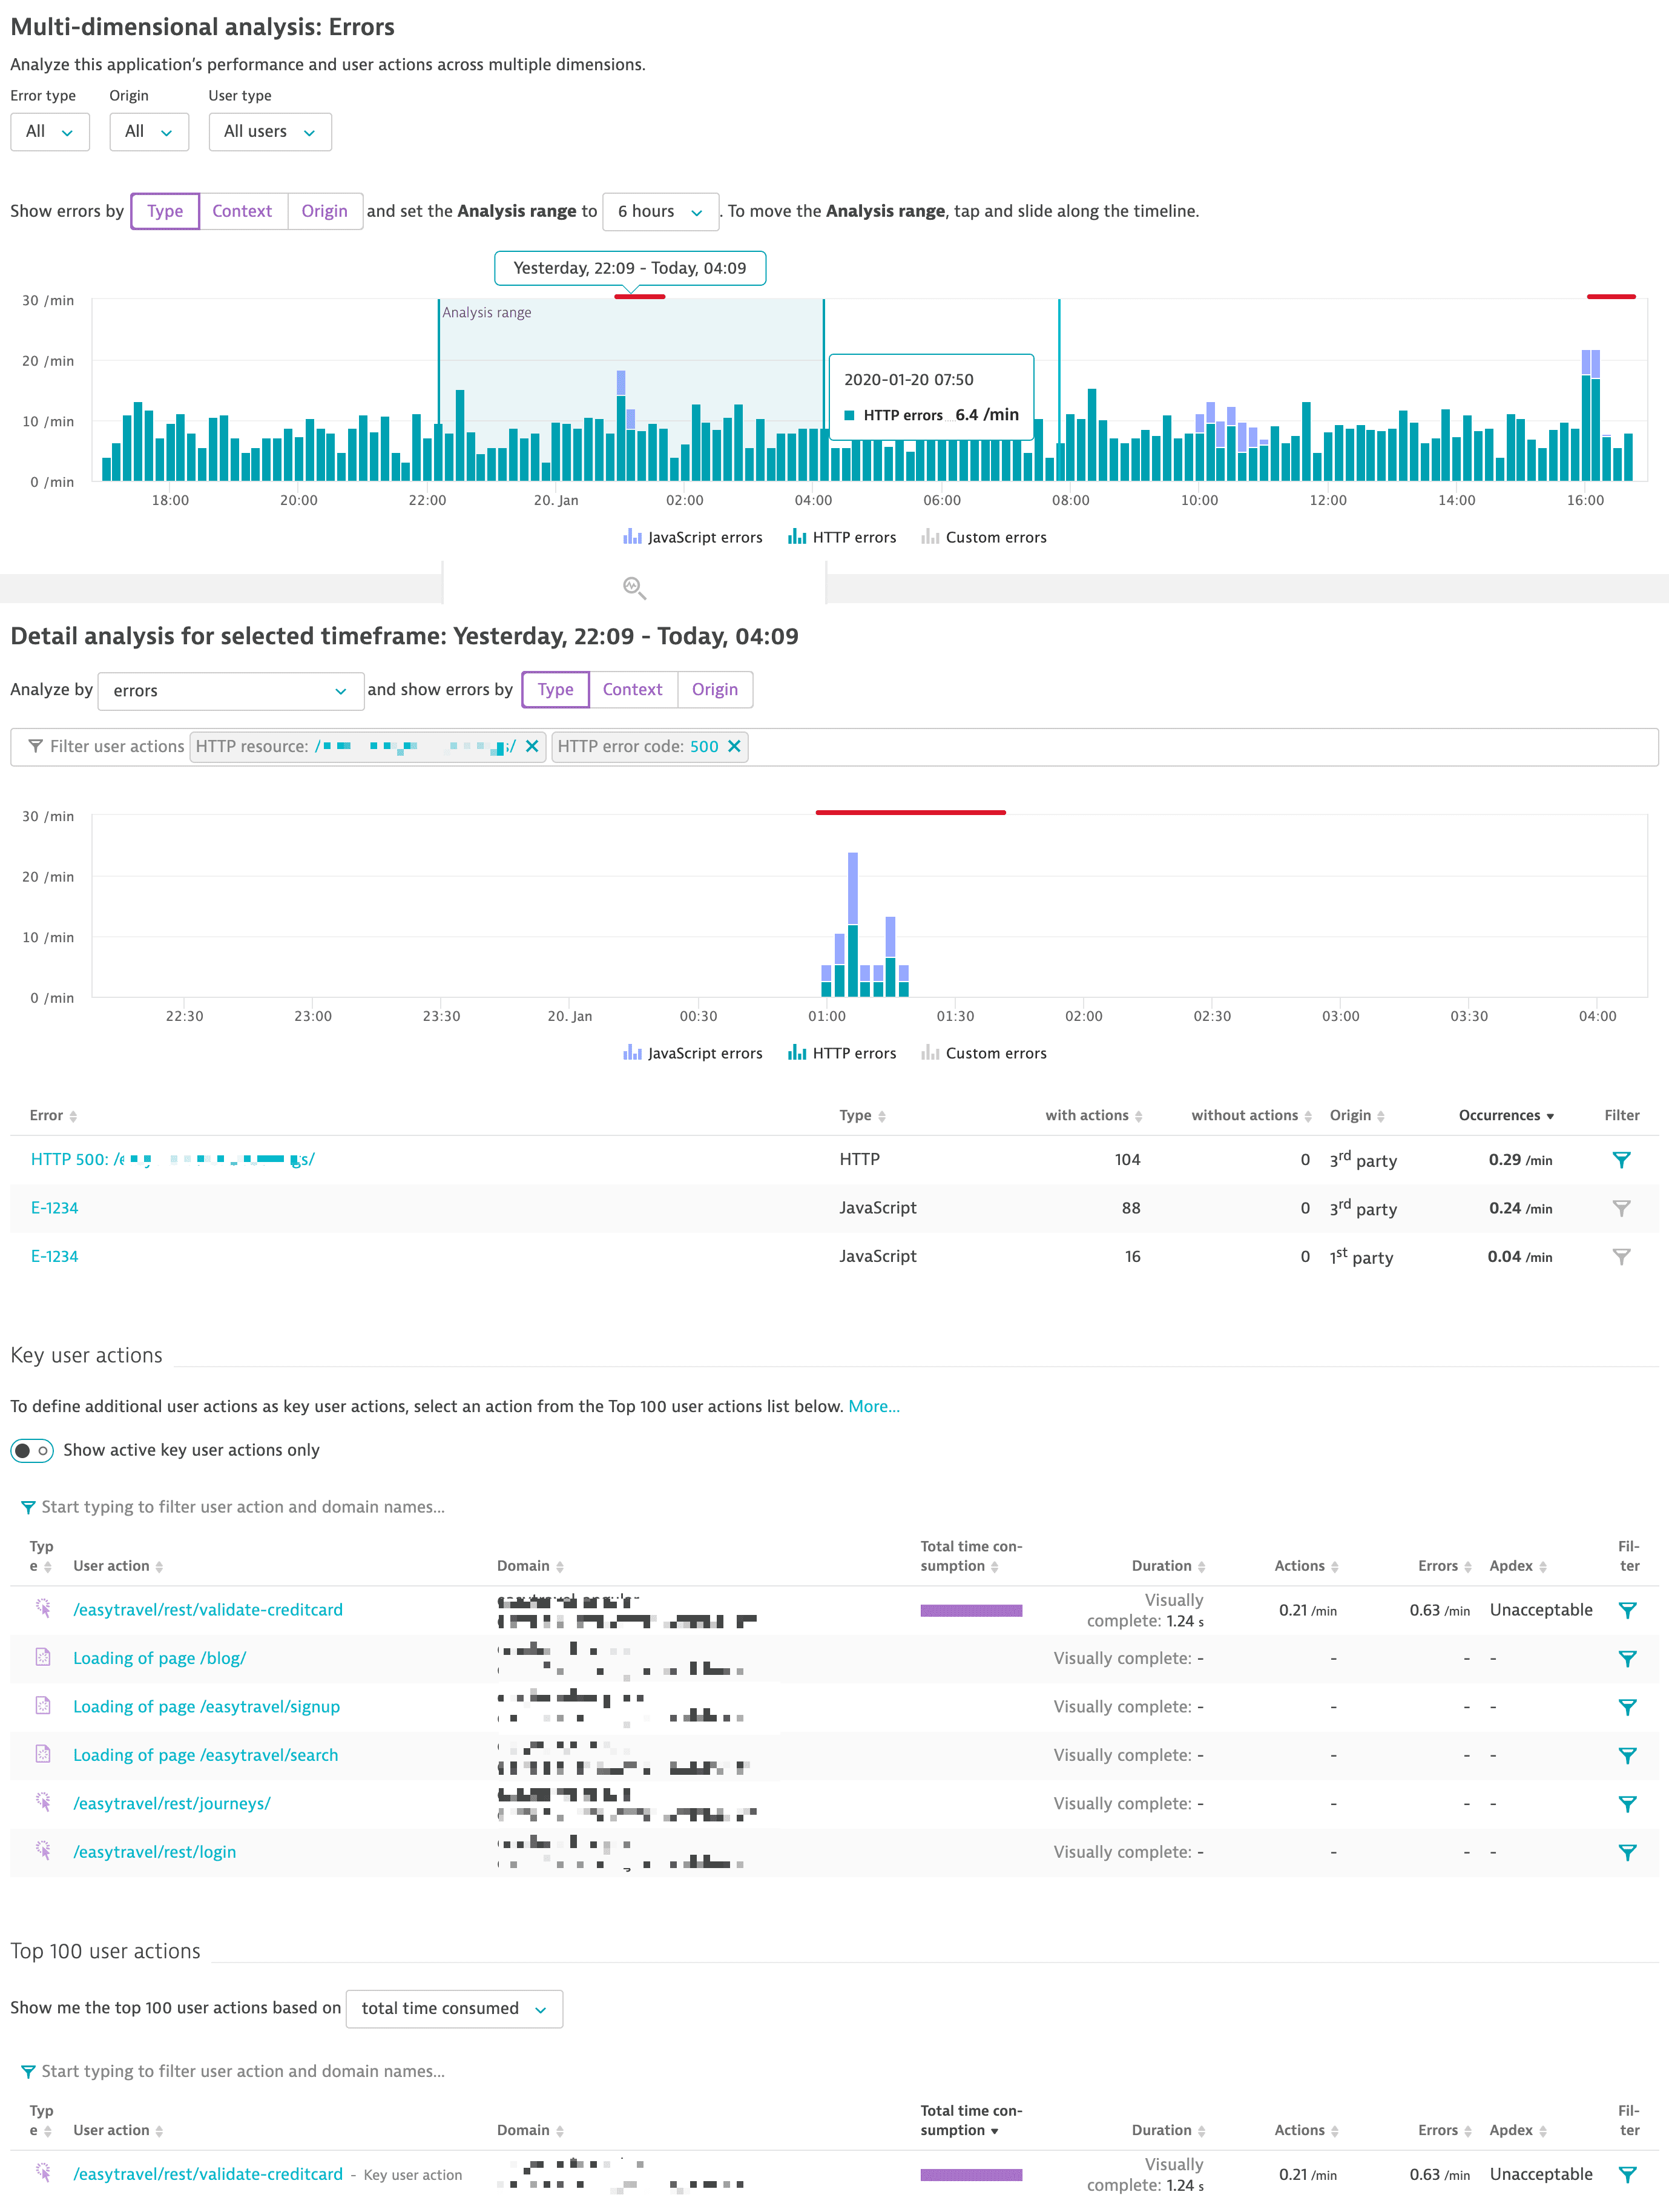
After using the Overview to identify an accumulation of errors, you can also use the Detail analysis card for the selected timeframe to further analyze the errors.
- Select one of the following dimensions by which you want to analyze the timeframe:
- Performance over time
- Distribution
- Browsers
- Geolocation
- Errors
- Select the option to group the errors by
Type,Context, orOrigin. - Optional Apply a filter by selecting the input field and choosing a desired filter. Use Enter and provide a corresponding filter value.
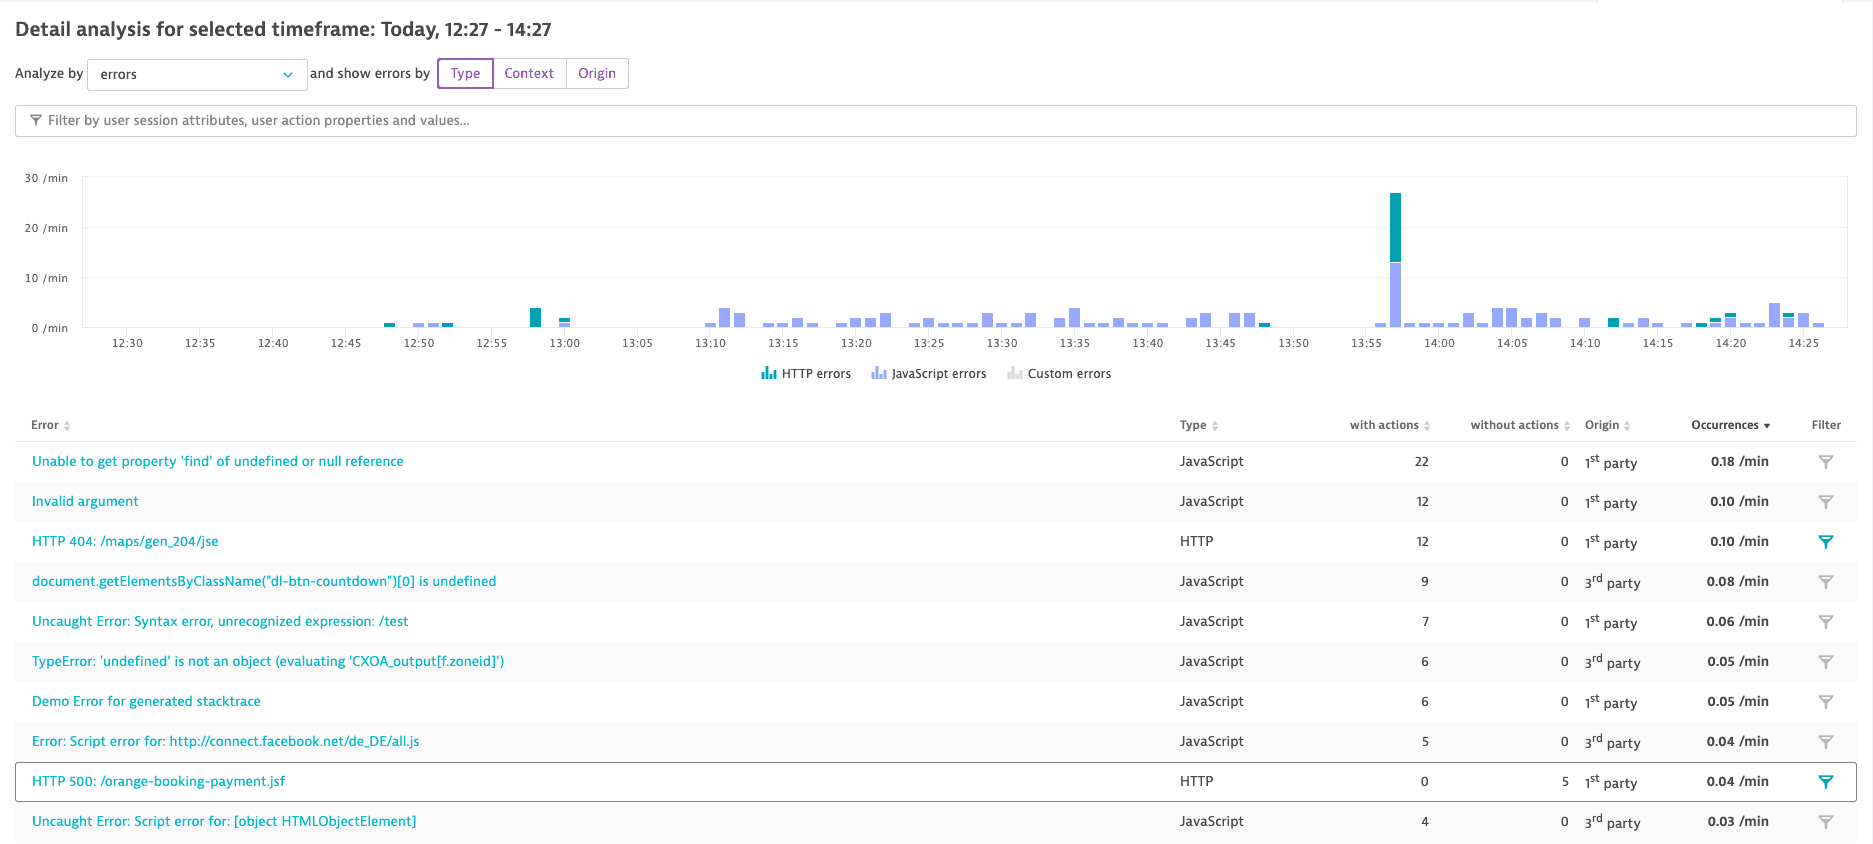
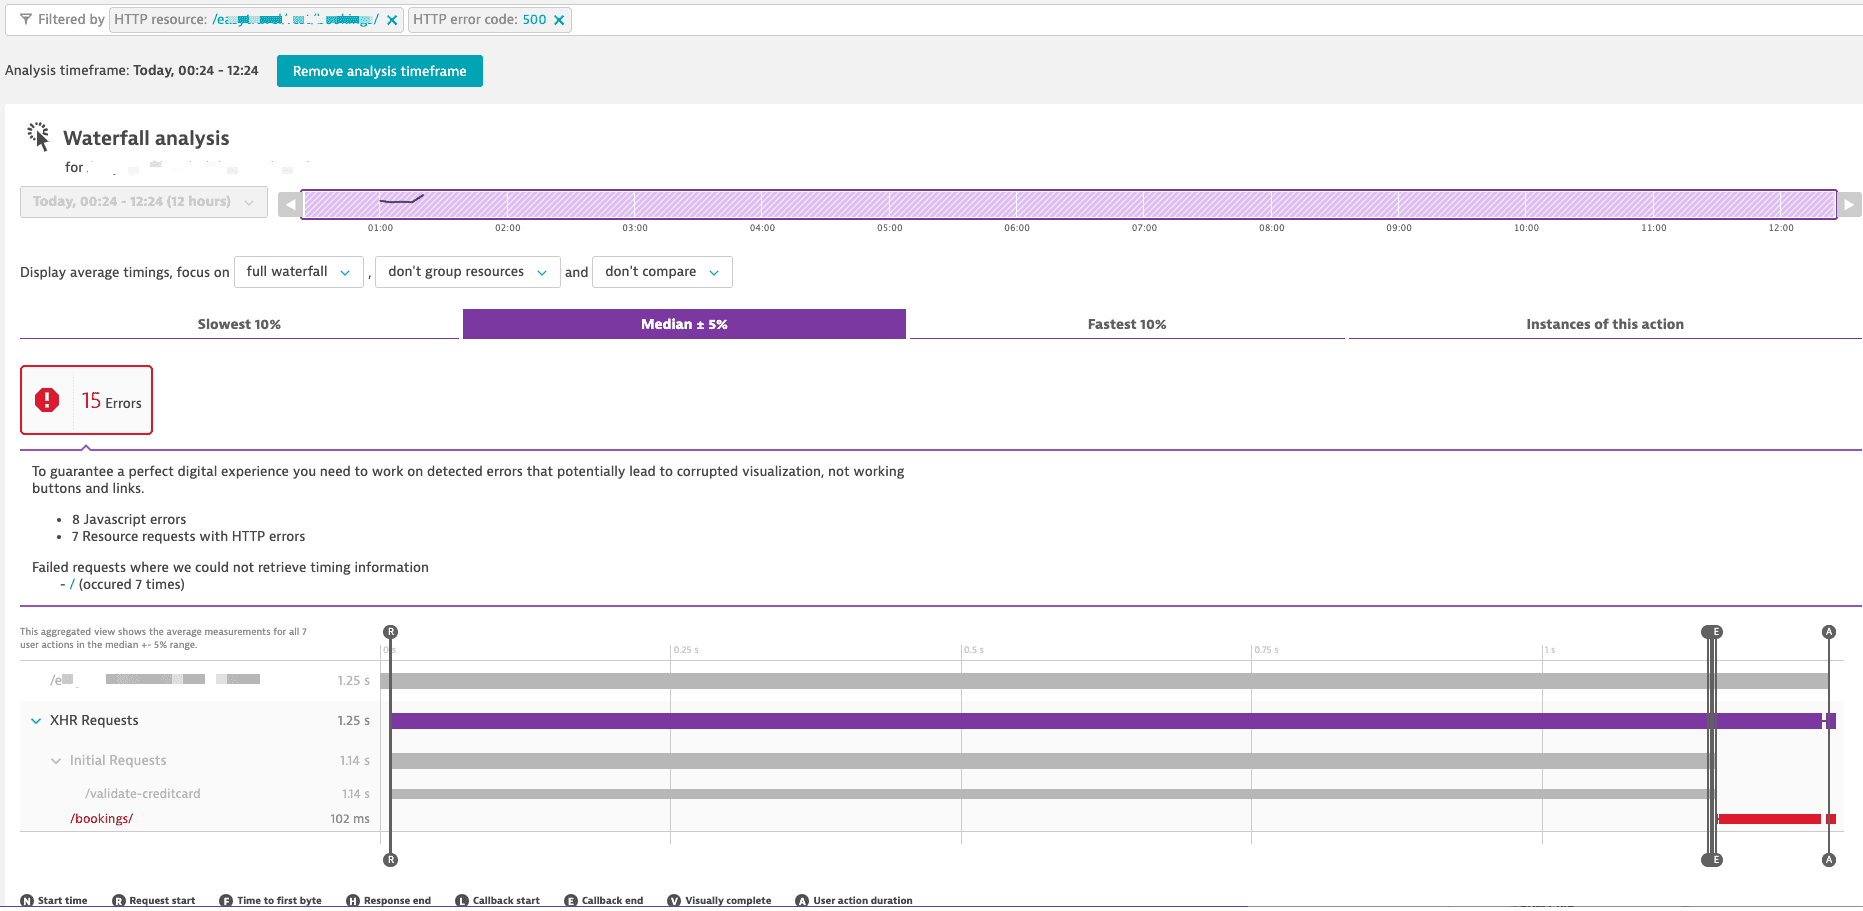
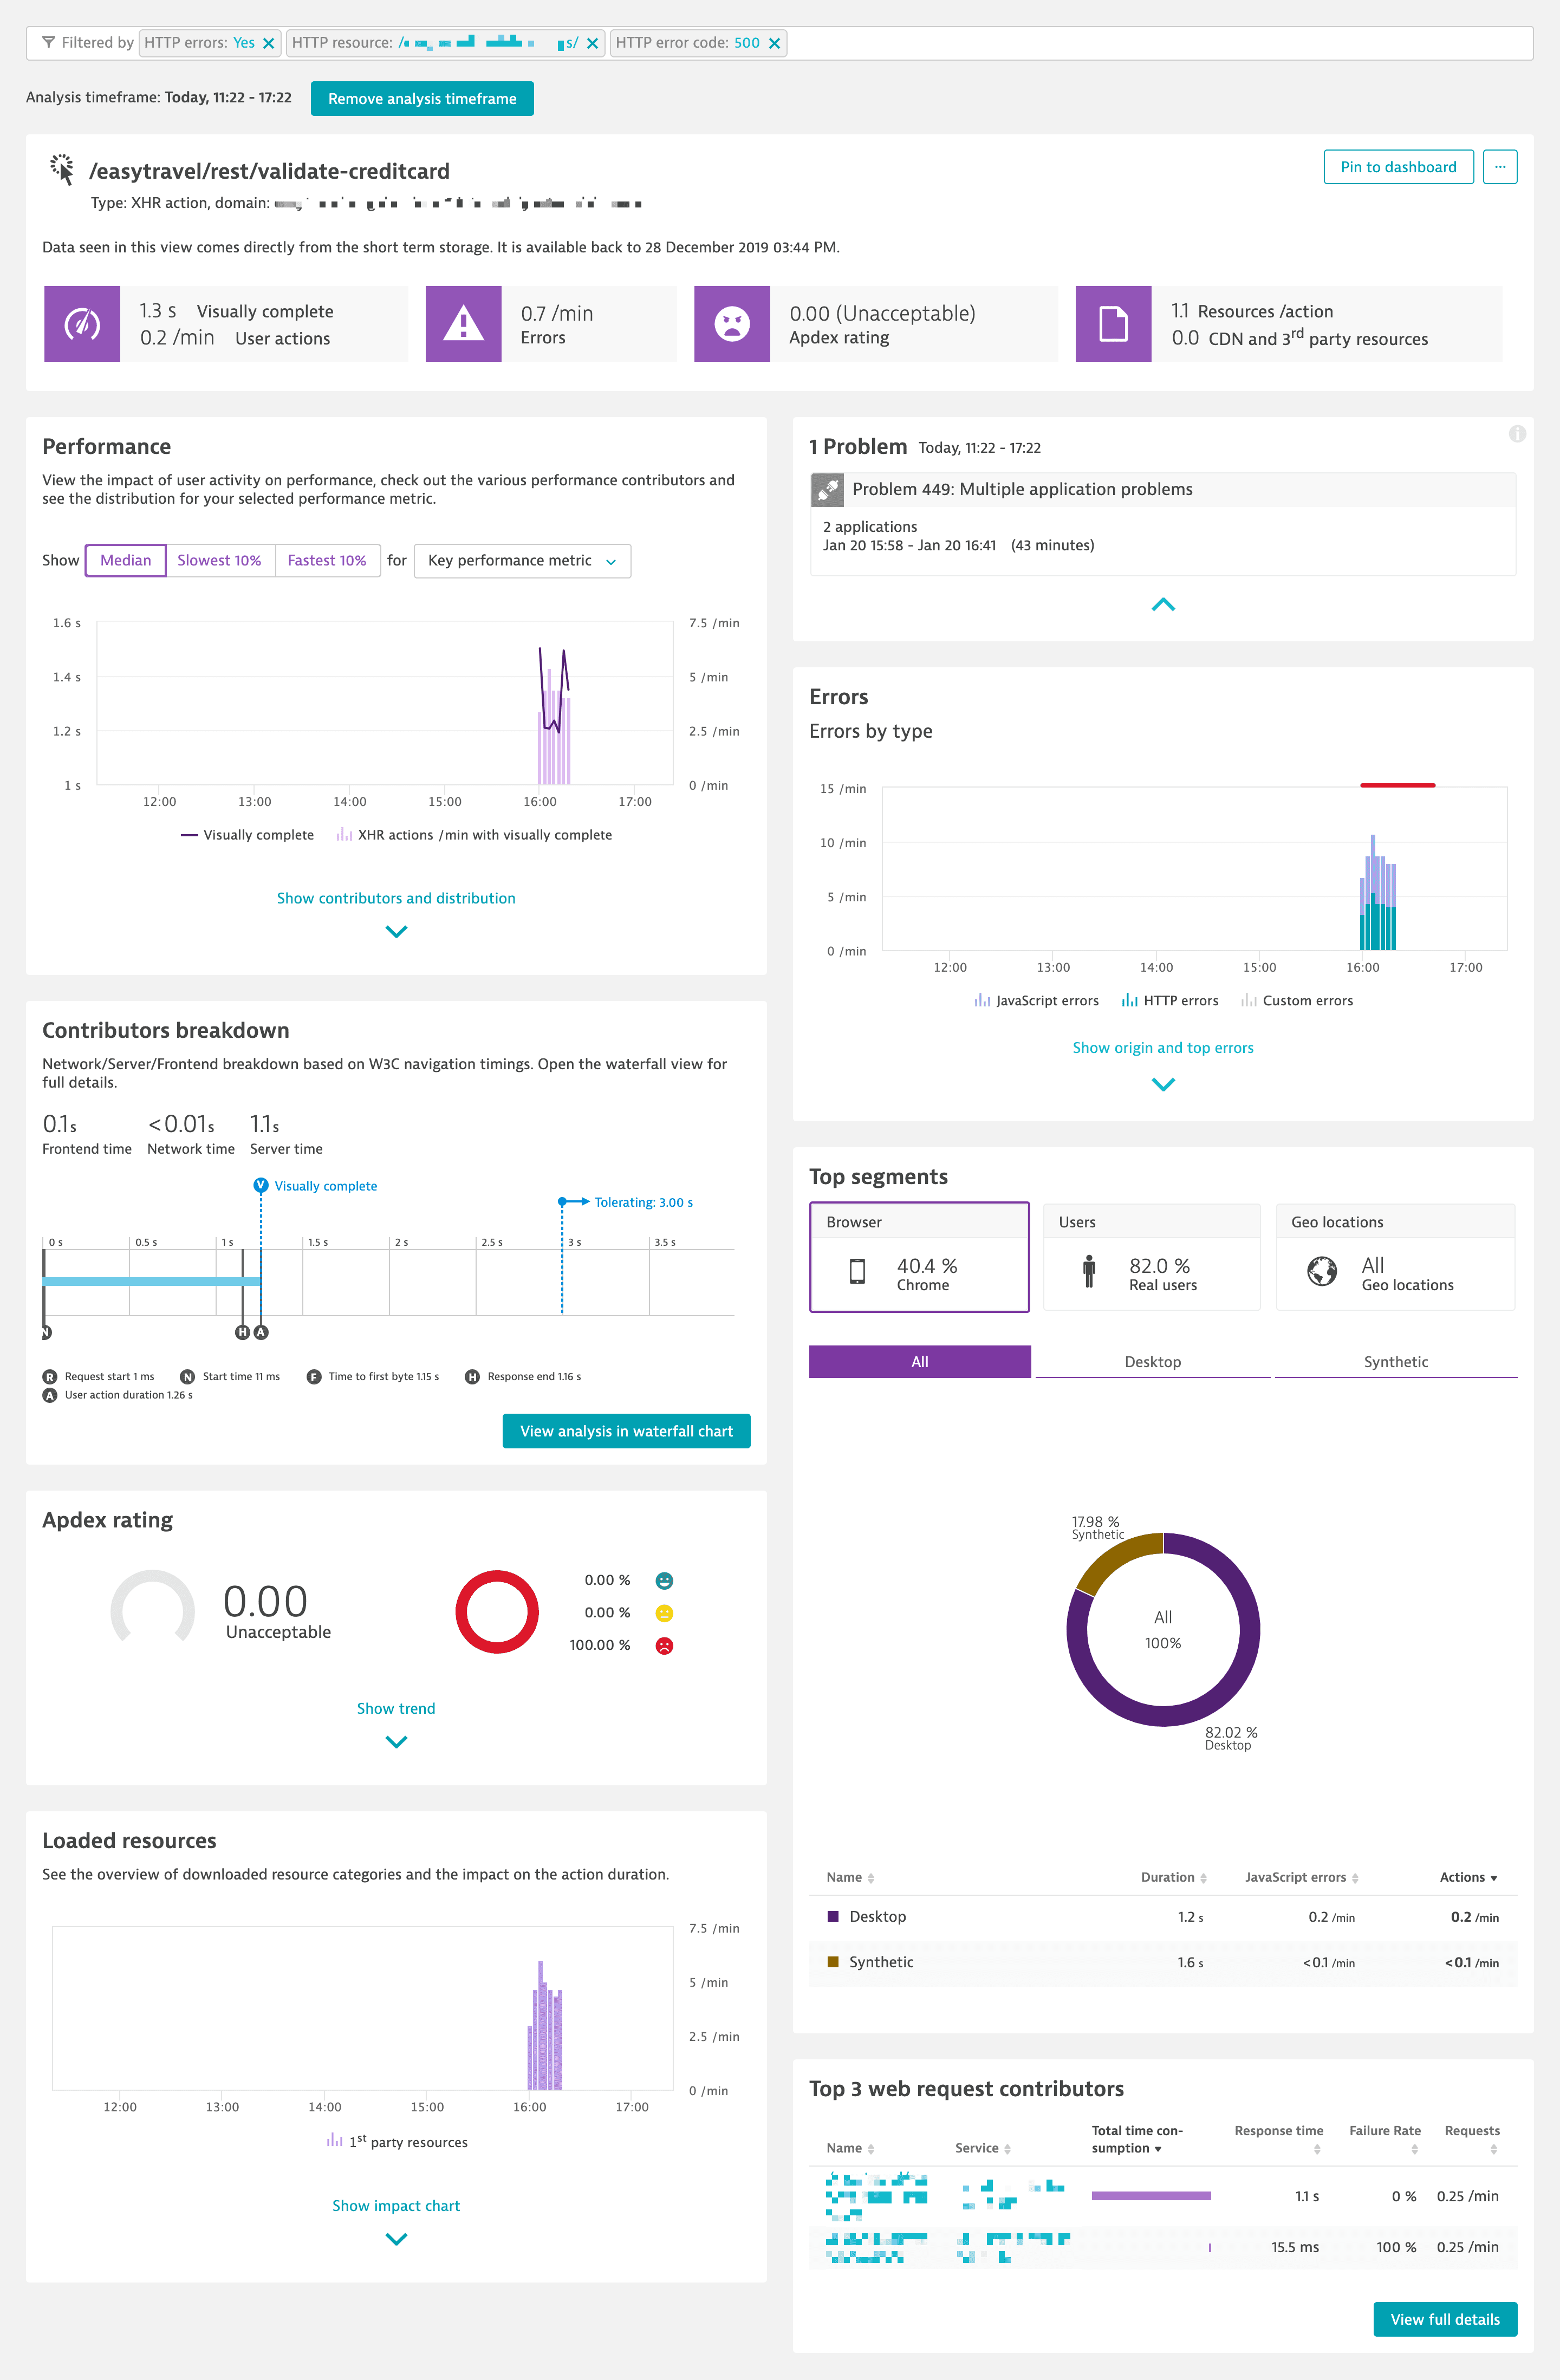
In this example, we find that we had an HTTP 500 error on a booking API, which we now want to inspect. When you select this error, the error detail page displays the most basic information related to the error, such as:
- How often the error occurred
- The number of sessions and users that were impacted
- The elements, such as user actions, OS, browser types, and locations that were involved in the error
In the error detail card, you can find additional error information, such as whether the error was detected by the RUM JavaScript or by OneAgent. When you select Edit detection rules for this error pattern, you are directed to the page where you can edit the web request error pattern that detected the error. Alternatively, you can select Create detection rule based on this error pattern to create an explicit web request error rule for the detected request error.
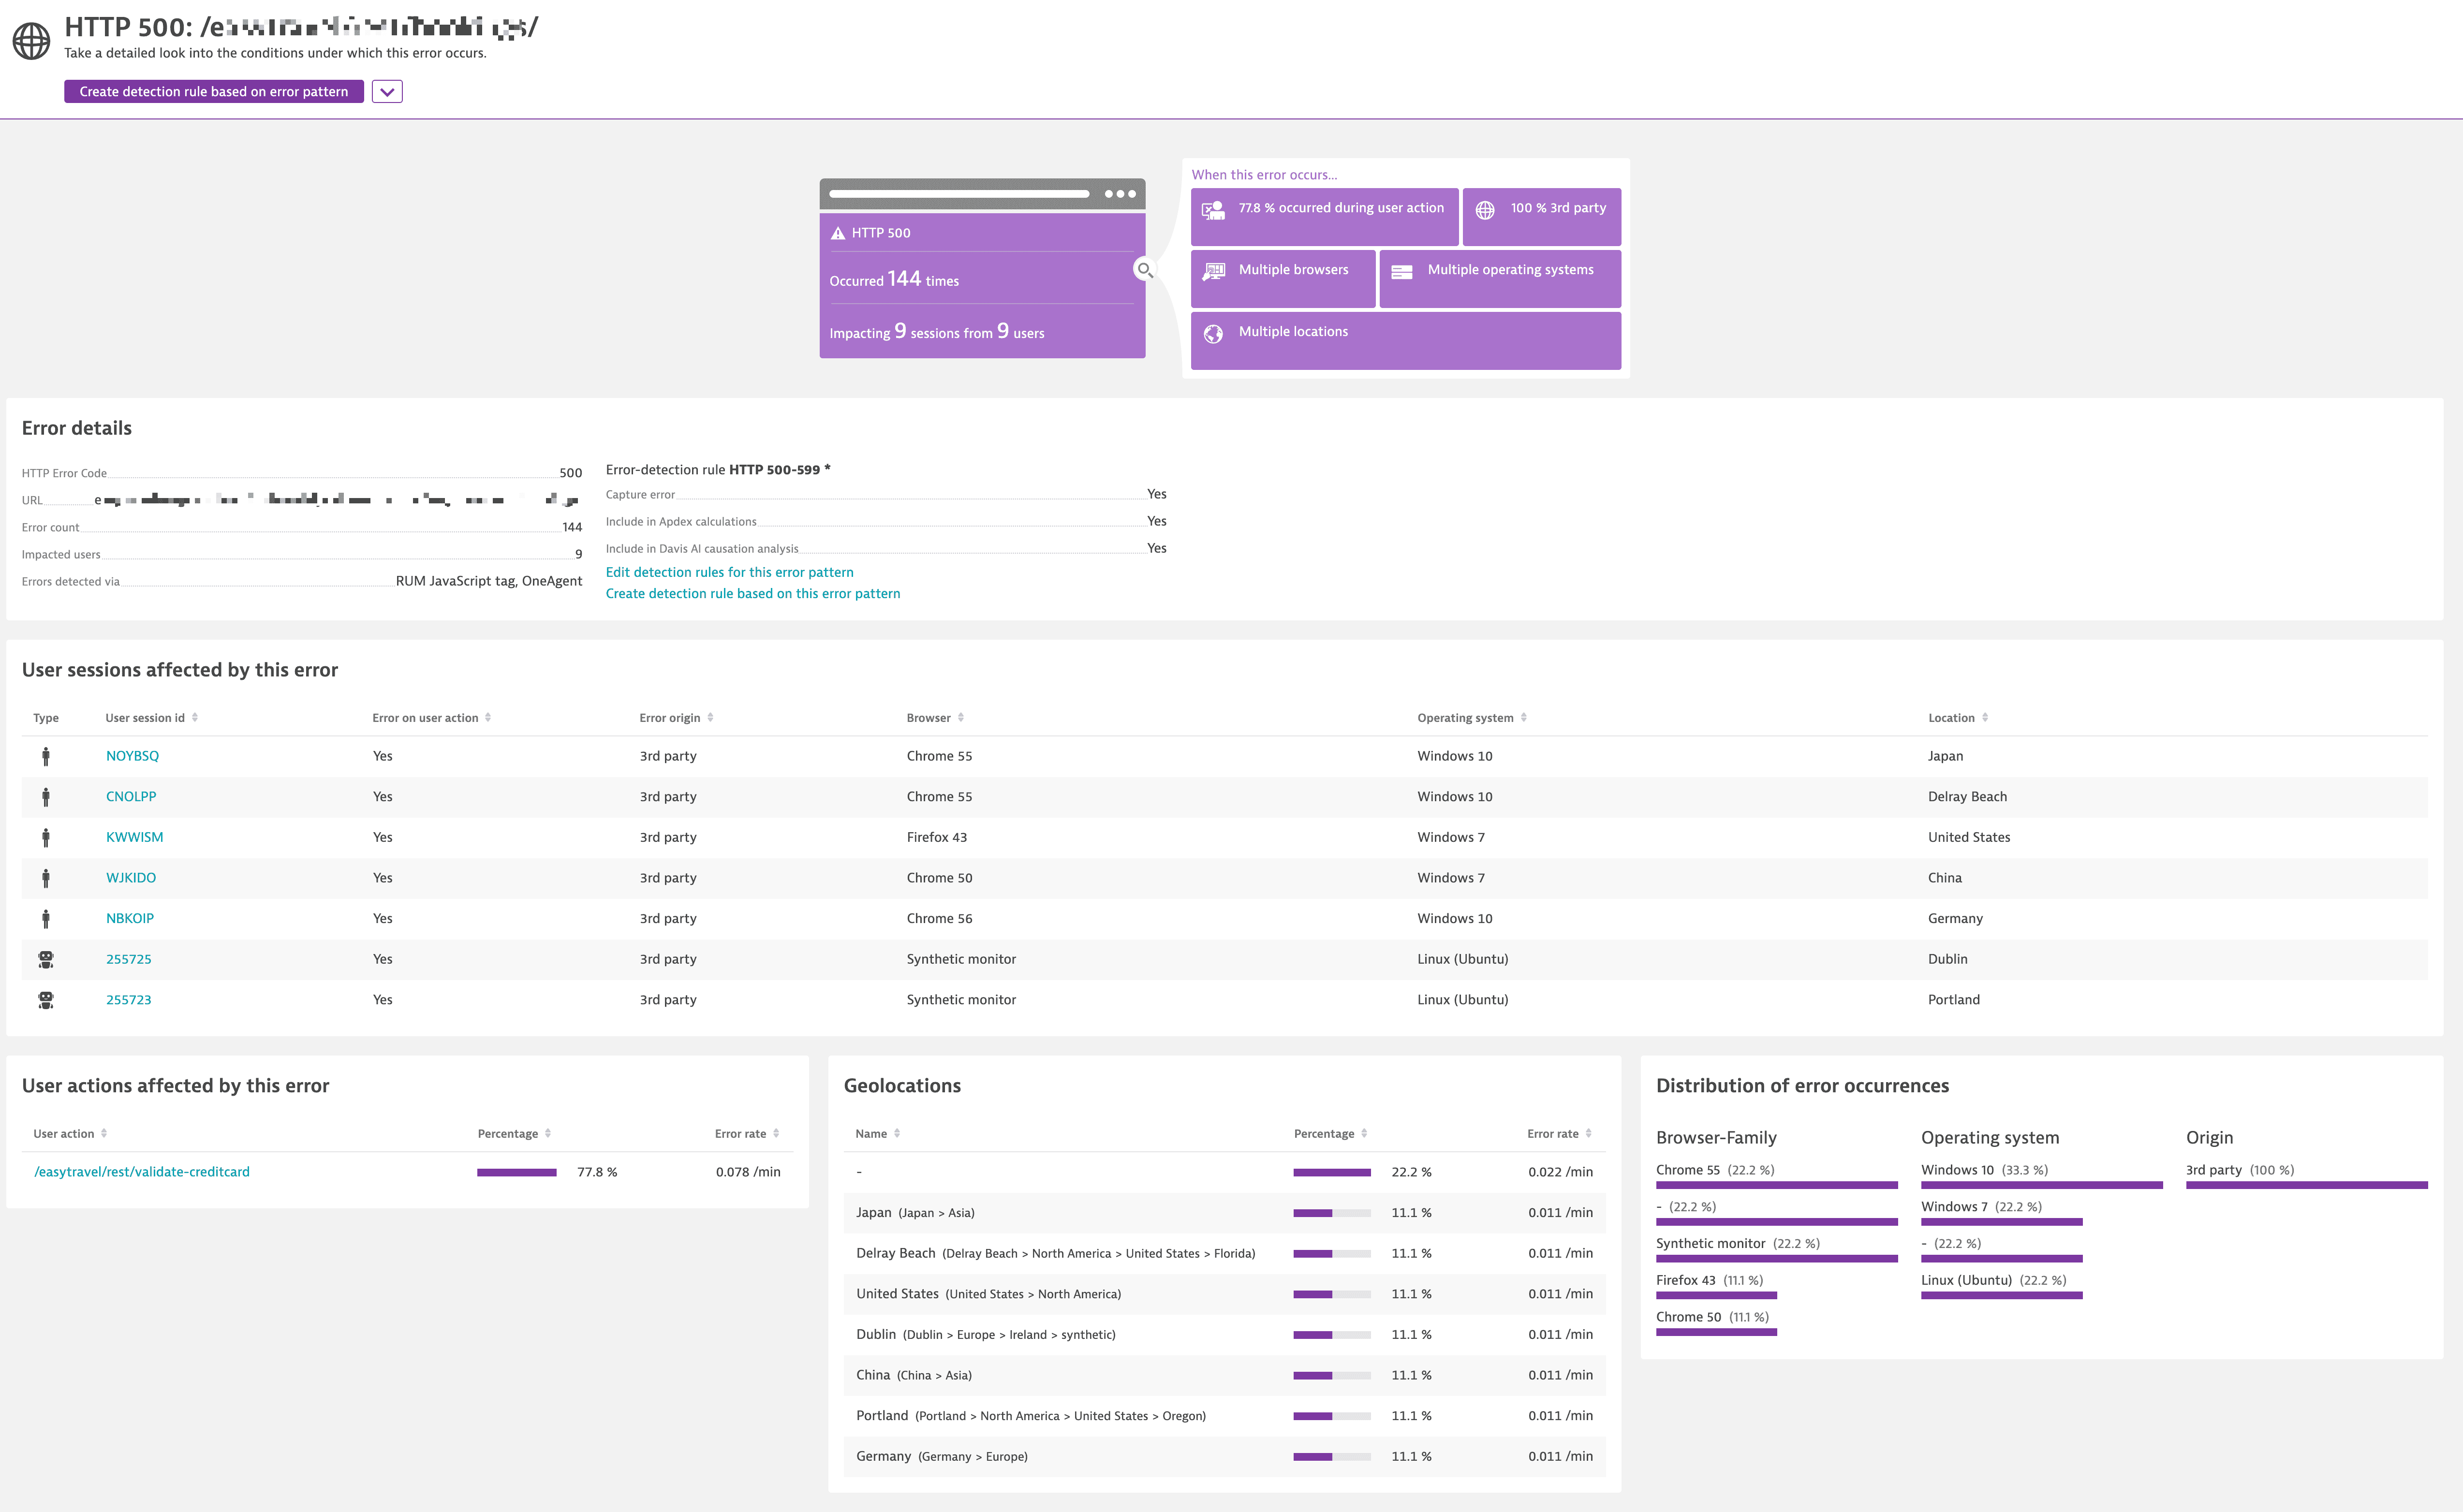
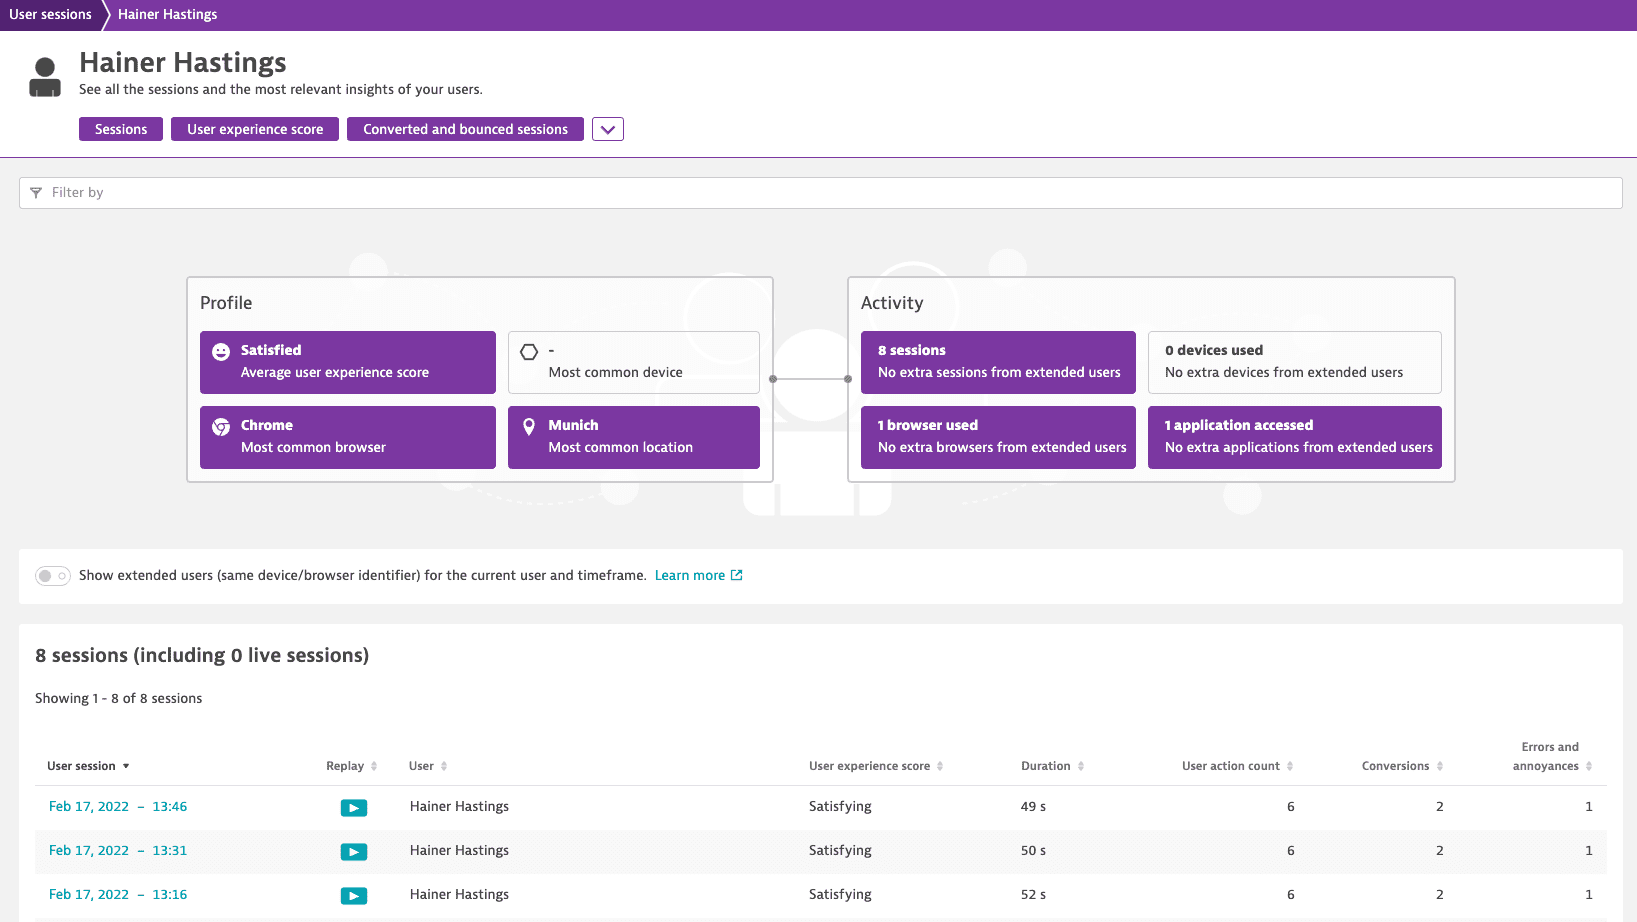
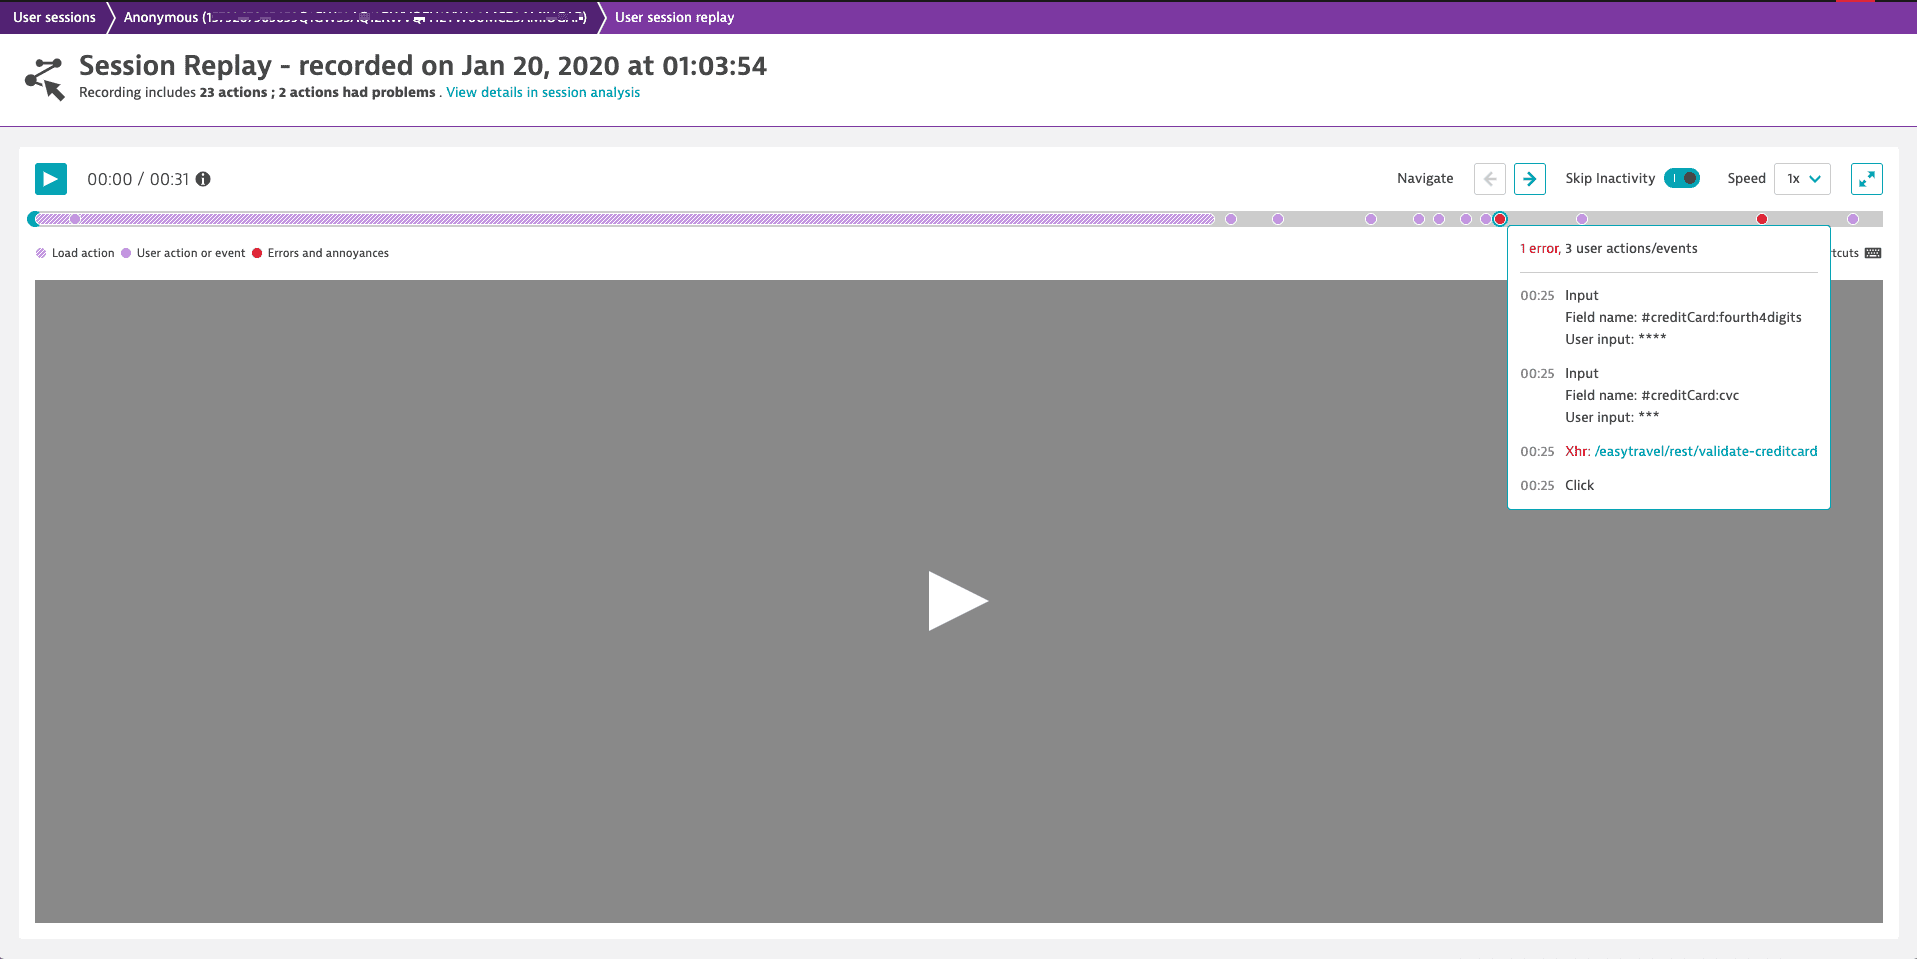
To further investigate the error you can conduct an in-depth session analysis of one of the affected sessions listed under User sessions affected by the error to find out more about where and how the error occurred. Features such as Session Replay make it easy to find and communicate the errors of these users throughout your organization.
Another way to further investigate an error is to look at it from the user action perspective. Use a filter on a certain error found in the Detail analysis for the selected timeframe card to refine the errors of interest, and then scroll down to Key user actions or Top 100 user actions to find related user actions. Select a user action of interest, and select it to analyze individual user actions.
As as example, the following page shows that errors can be integrated into a waterfall analysis as either a bar or a marker at the time where an error occurs.