Service flows for applications and user actions
- Dynatrace Classic
- How-to guide
- 1-min read
- Published Oct 04, 2017
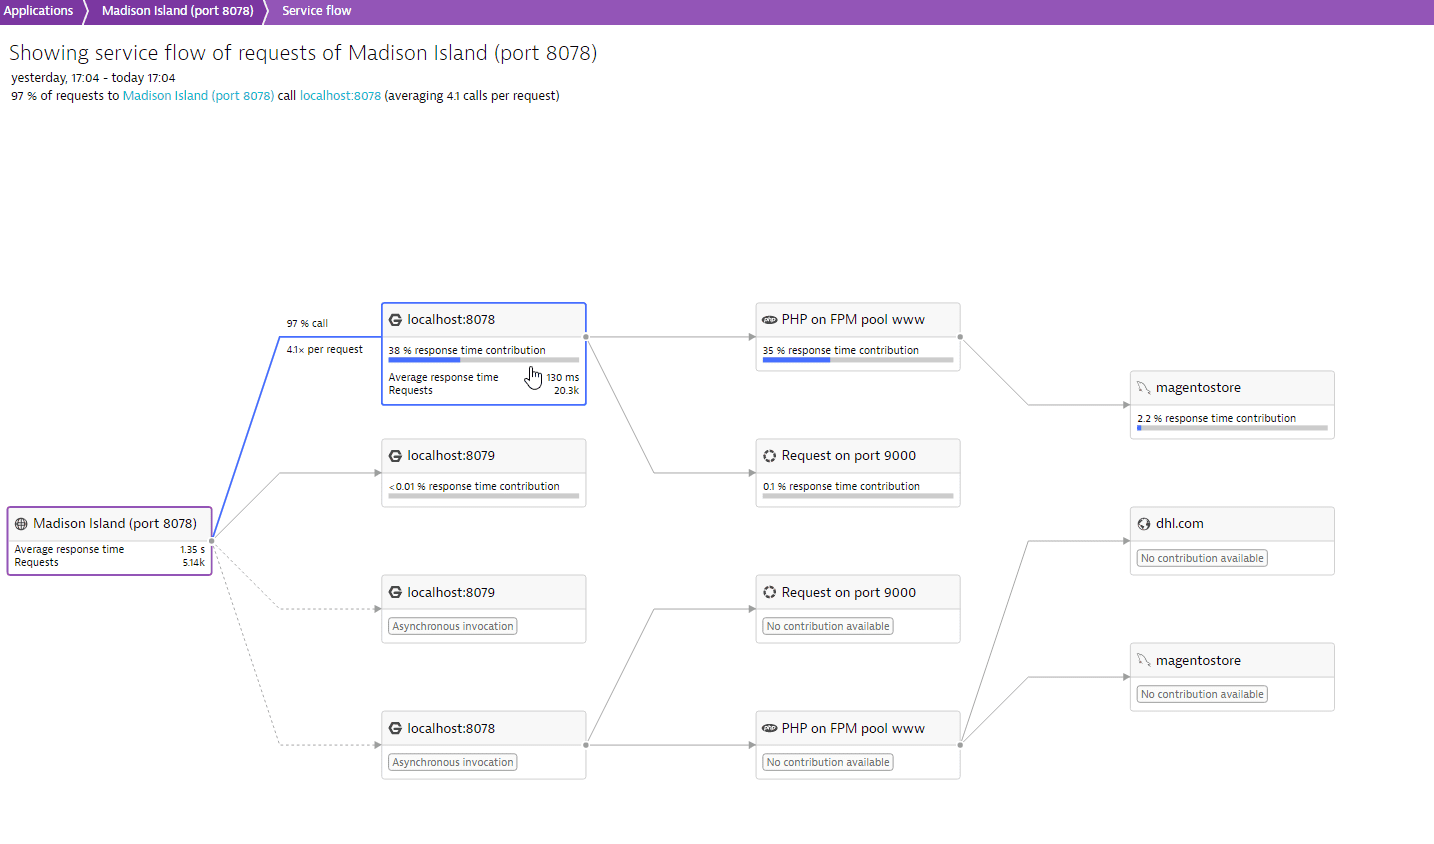
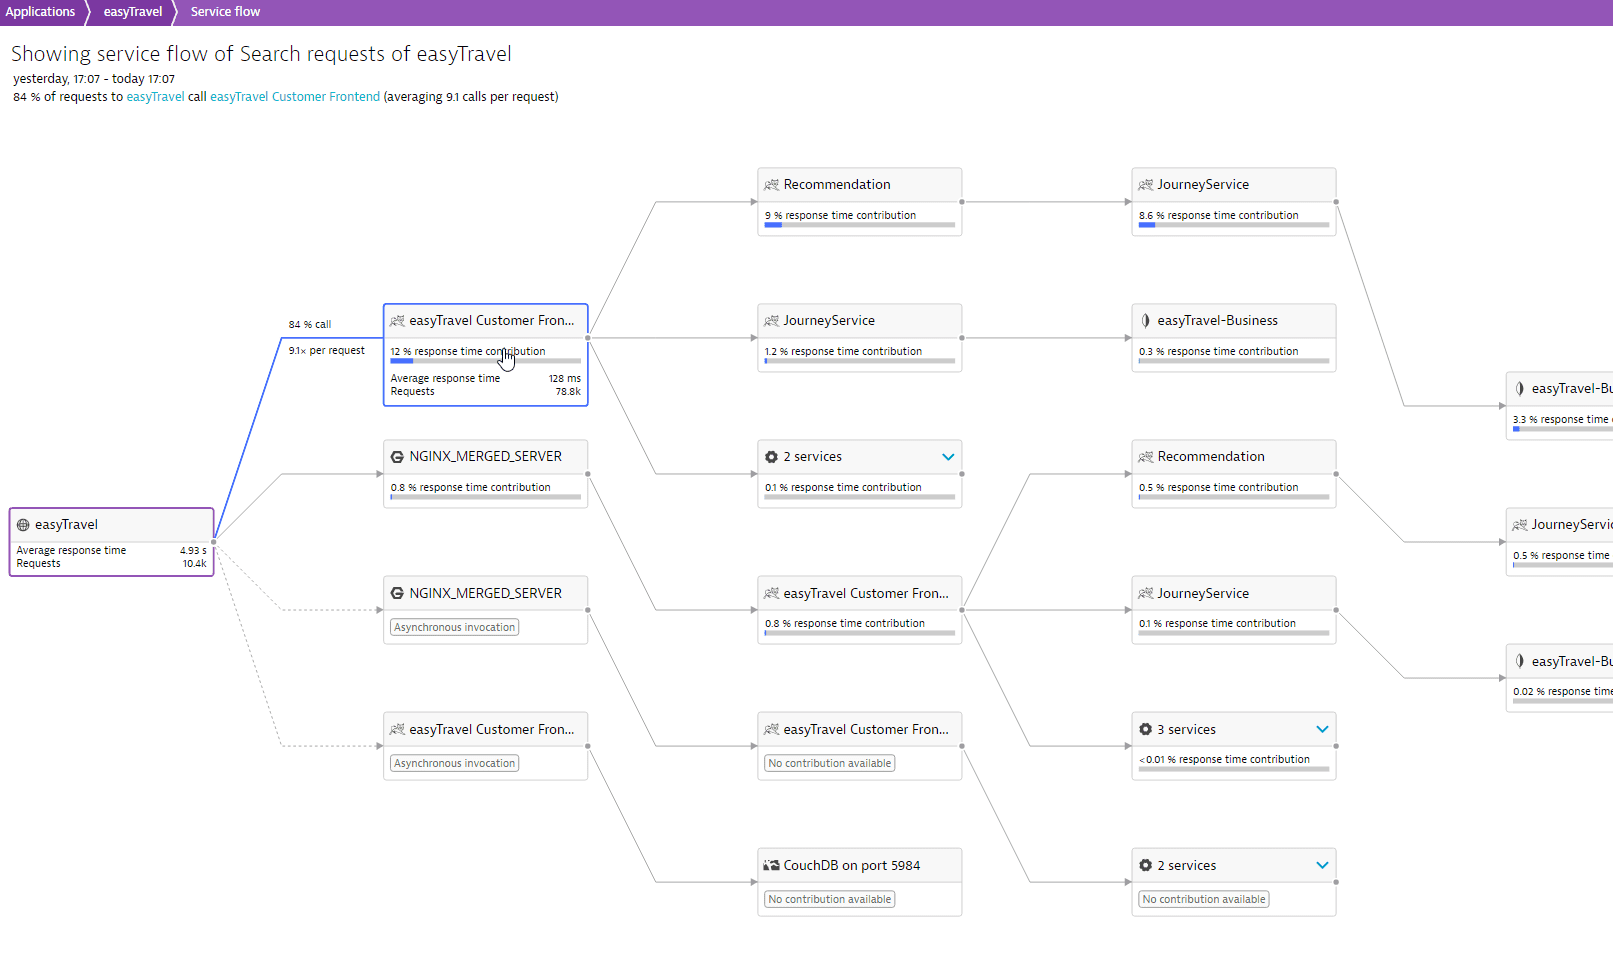
Dynatrace enables you to easily grasp the service flow chain within the context of your application and even within the context of individual user actions. Service flow shows you which services are called by each application or individual user action and helps you understand how these services call each other.
Access service flow for an application
To access the service flow for an application
-
Go to Web.
-
Select the application you want to analyze.
-
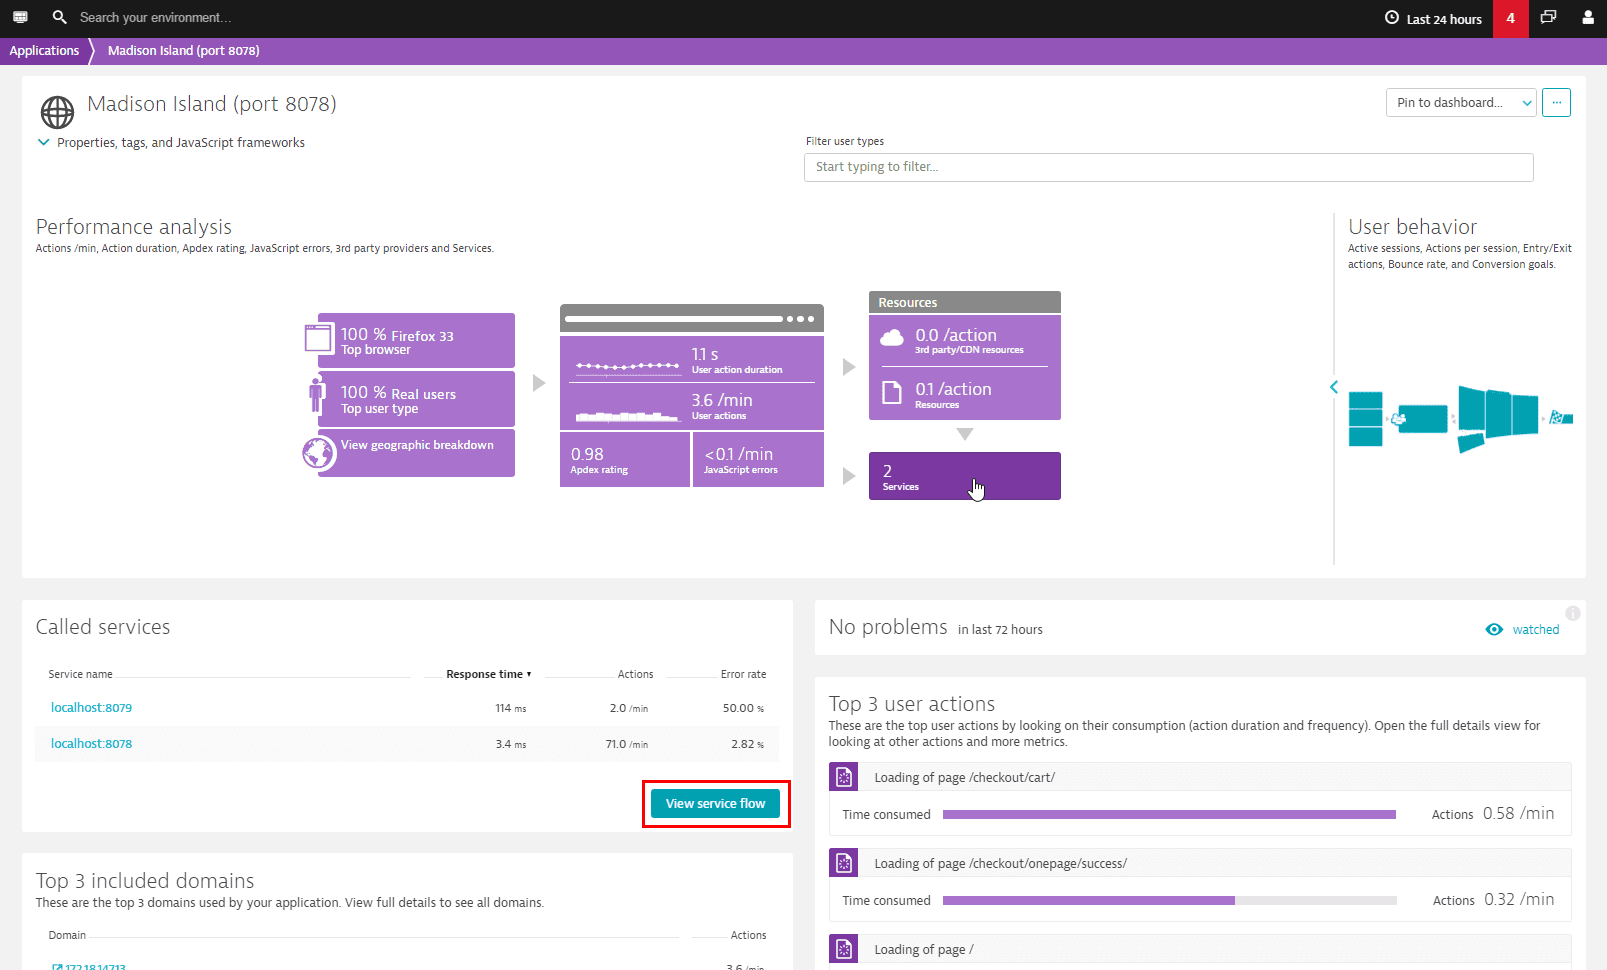
Select the Services tile in the lower-right corner of the Performance analysis infographic.
-
Within the Called services section below, select View service flow.
 Serviceflow app 1
 Serviceflow app 2
Access service flow for a user action
To access the service flow for a user action
-
Go to Web.
-
Select the application that includes the user action you want to analyze.
-
Scroll down to the Top 3 user actions section, and select View full details.
-
On the User actions page, select the user action you want to analyze from the Top 100 user actions or the Key user actions lists.
-
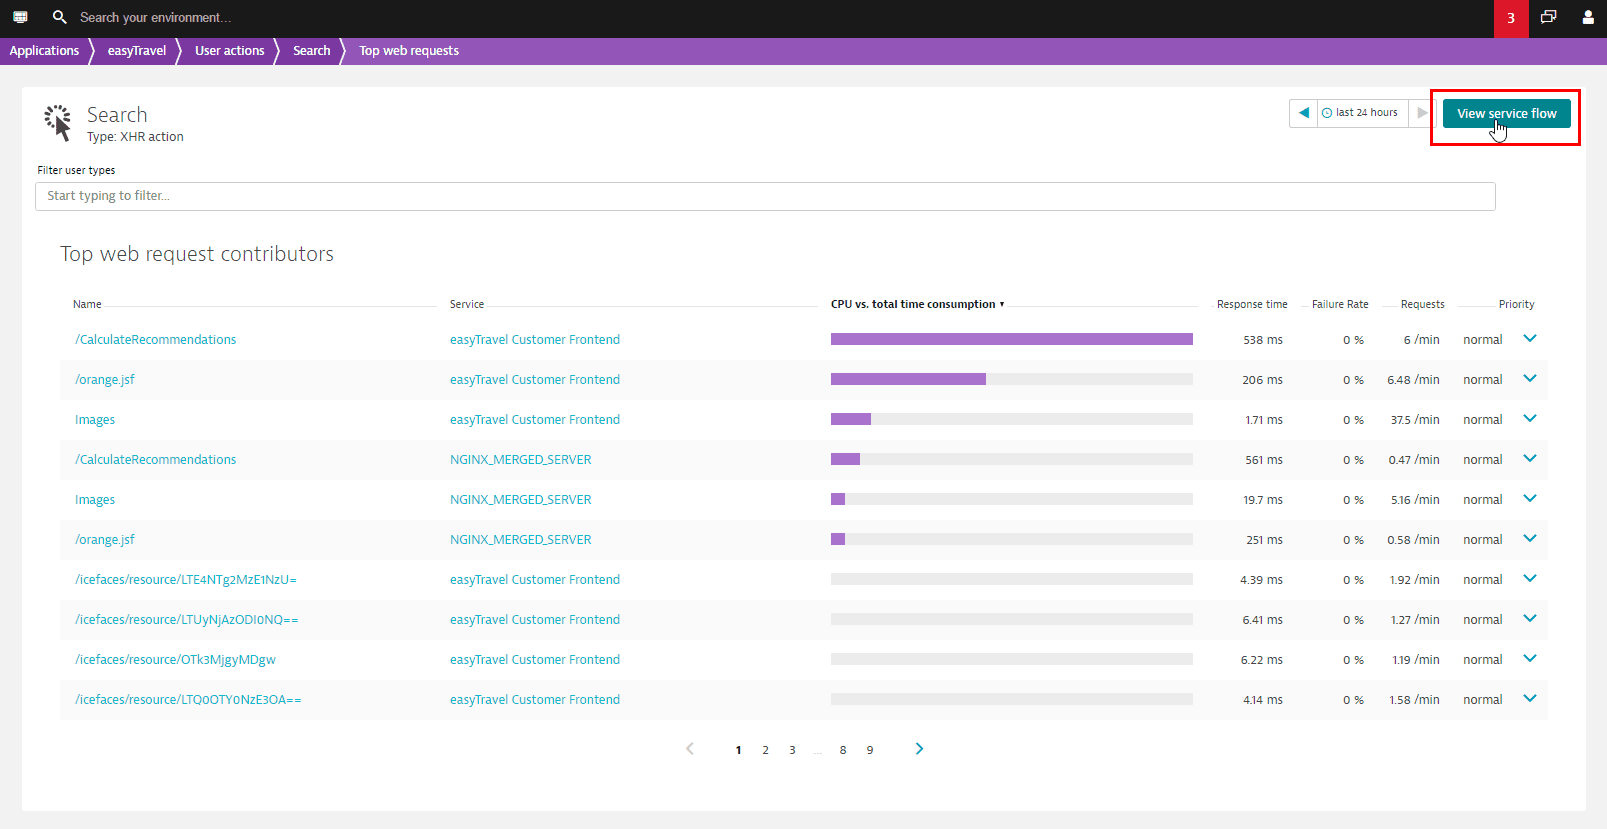
On the User action page, scroll down to the Top 3 web request contributors section, and select View full details.
-
Select View service flow.
 Useraction serviceflow 1
 Useraction serviceflow 2