.NET
- Latest Dynatrace
- Reference
- 3-min read
Dynatrace OneAgent instruments your .NET applications by placing trace statements at strategic locations in your code for code tracing, performance metrics, error detection, dependency tracking, and more.
Not every detected .NET application is instrumented by default. Dynatrace maintains a set of rules to instrument specific processes (for example, IIS application-pools, which you can extend with our own rules). To learn the basics about process group monitoring setup (automatic deep monitoring, custom monitoring rules, and built-in monitoring rules), see Set up process group monitoring.
Capabilities
Dynatrace provides extensive .NET monitoring capabilities:
- OpenTelemetry support for capturing traces and ingesting metrics.
For more information, see Instrument your .NET application with OpenTelemetry - End-to-end transaction tracing of requests to web services, remoting services, queues, and databases. Learn more about services
- OneAgent SDK for custom tracing
- Garbage collection, process metrics, and much more
- Always-on 24x7 production grade CPU profiling
See our supported technologies matrix for details on supported frameworks.
Supported .NET versions
| Version | Vendor released | Vendor End of life | First supported Dynatrace OneAgent version | Last supported Dynatrace OneAgent version | Dynatrace support until | Dynatrace support level |
|---|---|---|---|---|---|---|
| 10 | 2025-11-11 | - | 1.325 | - | - | Supported |
| 9 | 2024-11-12 | - | 1.305 | - | - | Supported |
| 8 | 2023-11-14 | - | 1.277 | - | - | Supported |
| 7 | 2022-11-08 | - | 1.263 | - | - | Supported |
| 6 | 2021-11-08 | - | 1.229 | - | - | Supported |
| 5 | 2020-11-10 | - | 1.203 | - | - | Supported |
| Core 3.1 | 2019-12-03 | - | 1.183 | - | - | Supported |
| Core 3.0 | 2019-09-23 | - | 1.177 | - | - | Supported |
| Core 2.2 | - | 2019-12-23 | - | - | - | Supported |
| Core 2.1 | - | - | - | - | - | Supported |
| Core 2.0 | - | 2018-10-01 | - | 1.297 | 2024-08-31 | Limited1 |
| Core 1.1 | - | 2019-06-27 | - | 1.177 | 2019-12-01 | Not supported |
| Core 1.0 | - | 2019-06-27 | - | 1.177 | 2019-12-01 | Not supported |
Supported .NET Framework versions
| Version | Vendor released | Vendor End of life | First supported Dynatrace OneAgent version | Last supported Dynatrace OneAgent version | Dynatrace support until | Dynatrace support level |
|---|---|---|---|---|---|---|
| 4.5.2 - 4.8 | - | - | - | - | - | Supported |
| 4.5.1 | - | 2016-01-12 | - | - | - | Limited1 |
| 4.5 | - | 2016-01-12 | - | - | - | Limited1 |
| 4 | - | 2016-01-12 | - | - | - | Limited1 |
| 3.5 SP1 | - | - | - | - | - | Supported |
Process logs with technology bundle parsers
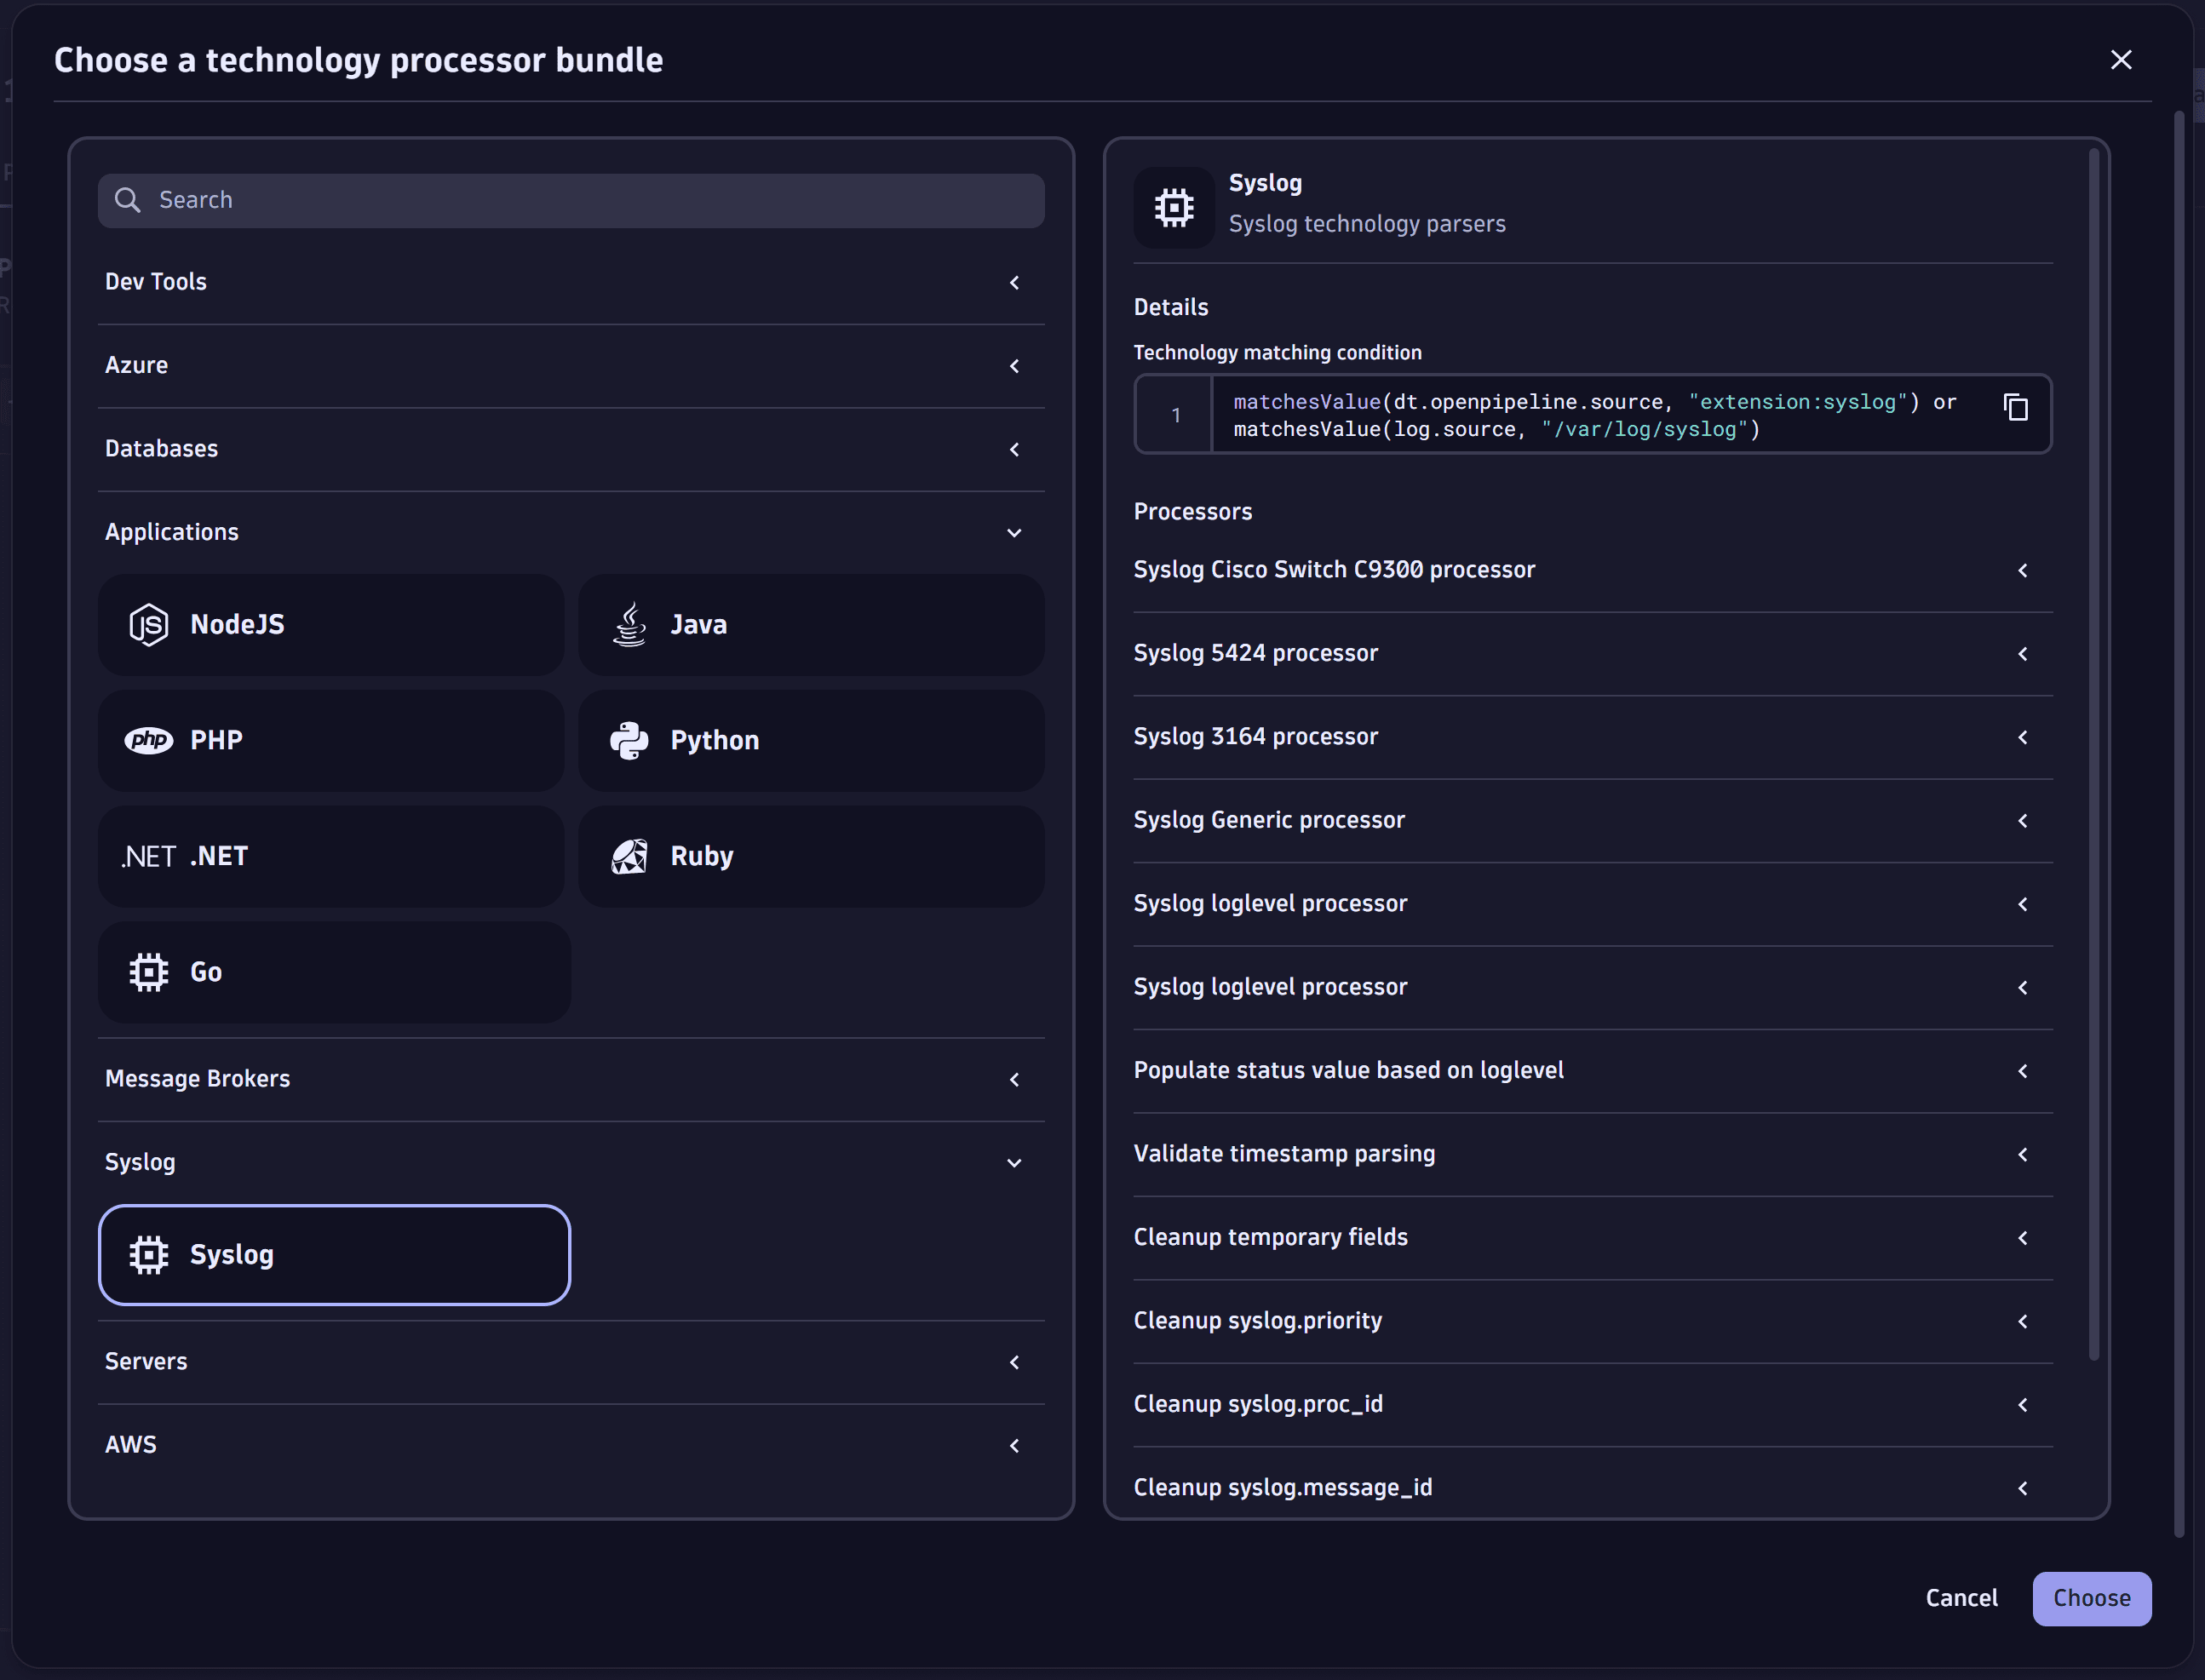
Through OpenPipeline, you can use and configure technology bundles. A technology bundle is a library of parsers (processing rules) that process logs from various technologies, such as Java, .NET, and Microsoft IIS.
Parsers help you to improve filtering, troubleshooting, metrics, alerts, and dashboards by efficiently extracting log levels and relevant attributes. You can also use technology bundles to structure logs from technologies that are not supported by Dynatrace out of the box.

For more information, see Process logs with technology bundle parsers.
Support lifecycle
Dynatrace is committed to support each version according to its support lifetime:
Limitations
Method hotspots on Linux
The .NET code module uses POSIX signals to capture stack traces for the method hotspots feature.
Because those signals can interrupt the application at arbitrary times, certain applications/libraries (in particular, .NET libraries with native dependencies) might not work correctly with method hotspots features enabled.
An affected application might show symptoms such as:
- Connectivity problems
- Mangled text data
- Kubernetes readiness and liveness probes failing
The only current solution is to disable the corresponding OneAgent features for the affected process group:
- Capture method hotspot information in PurePaths
- Capture background CPU method hotspot information
- .NET Async Method Hotspots
Method hotspots might not be able to correctly capture stack traces on musl-libc based operating systems such as Alpine. This is because certain debug information is removed by the musl-libc library. Moving to a glibc-based operating system (Debian/Ubuntu) can mitigate this specific issue.
- .NET method hotspots are not available for Linux on ARM64 (AArch64).
Trimming
The optional .NET feature trimmed self-contained deployments and executables was introduced to optimize the size of packaged applications. Trimmed applications are not supported by OneAgent therefore this option must be turned off. UiPath, for example, uses trimming, which makes it impossible to instrument with OneAgent.
Single-file applications
The .NET SDK supports building your application as a single file that bundles all dependencies into one platform-dependent executable.
Depending on whether you use framework-dependent deployment or self-contained applications, the runtime will also be bundled into the executable.
Consider also the following information:
- OneAgent doesn't support the instrumentation of modules bundled into the executable, which results in applications built as single files and self-contained not being supported at all.
- Applications built as single file and framework-dependent can be partly instrumented.
- .NET assemblies bundled into the single-file executable can't be instrumented (tracing logic can't be placed for those assemblies).