Process deep monitoring
- Dynatrace Classic
- How-to guide
- 6-min read
Installing OneAgent provides you with process group monitoring capabilities such as:
- Automatic monitoring of all process groups that are detected in your environment after you restart all processes that have been running during the OneAgent installation.
- End-to-end visibility into requests of all auto-detected server-side services, including database services.
- A fully automated monitoring process with no configuration required, thus simplifying monitoring of large-scale environments with hundreds of hosts and thousands of processes, where manual monitoring configuration of all entities isn't feasible.
Optionally, you can set up monitoring rules to selectively specify which processes Dynatrace monitors. For example, consider the following common scenarios:
- You have a number of unimportant or short-lived processes that you don’t want to monitor at the code level.
- You aren't able to run deep monitoring on applications that belong to your customers and are out of your control.
- You want to have better control over which processes are monitored.
- You want to perform deep monitoring on .NET and Go processes (Dynatrace doesn't automatically perform deep monitoring on them, as there are many arbitrary processes that rely on these processes). For instance you want to monitor all ASP.NET applications and all Go and .NET core applications running on Cloud Foundry or Kubernetes.
You can set up monitoring states in Settings > Processes and containers > Process group monitoring.
Enable automatic deep monitoring
-
By default, automatic deep monitoring is set to On to enable Dynatrace OneAgent to run deep monitoring on all detected processes (unless you specify exceptions for specific processes or create rules that define exceptions). Disable this setting only if your company policies require it.
-
Set to Off if you want Dynatrace OneAgent to run deep monitoring only for processes that are specified explicitly or that are covered by a deep monitoring rule. You can then manually enable monitoring at the process level or process group level, or choose to define rules about what you want to monitor.
To disable automatic deep monitoring
- Go to Settings.
- Select Processes and containers > Process group monitoring.
- Turn off Enable automatic deep monitoring.
- Select Save changes.
Enable automatic deep monitoring doesn’t take precedence over any individual process monitoring rules you may have set up. If a process monitoring rule indicates that Dynatrace should monitor a certain process, and Enable automatic deep monitoring is Off, the individual rule will take precedence and Dynatrace will monitor the respective process. Therefore, each process monitoring rule is an exception to the general monitoring policy.
Define custom process monitoring rules
Custom process monitoring rules give you fine-grained control over which processes OneAgent monitors with an approach that scales easily within large environments. You don’t need to adjust your system configuration, and a few rules can cover thousands of processes.
To add a custom monitoring rule
- Go to Settings.
- Select Processes and containers > Custom process monitoring rules.
- Select Add item.
- Set the Mode to determine the basic condition:
- Monitor the process if the condition is met
- Do not monitor the process if the condition is met
- Define the Condition:
- The condition target (see process group detection rules).
- The condition operator (for example,
contains). - The condition value.
- Select Save changes to save your configuration and add the new rule to your list of custom process monitoring rules.
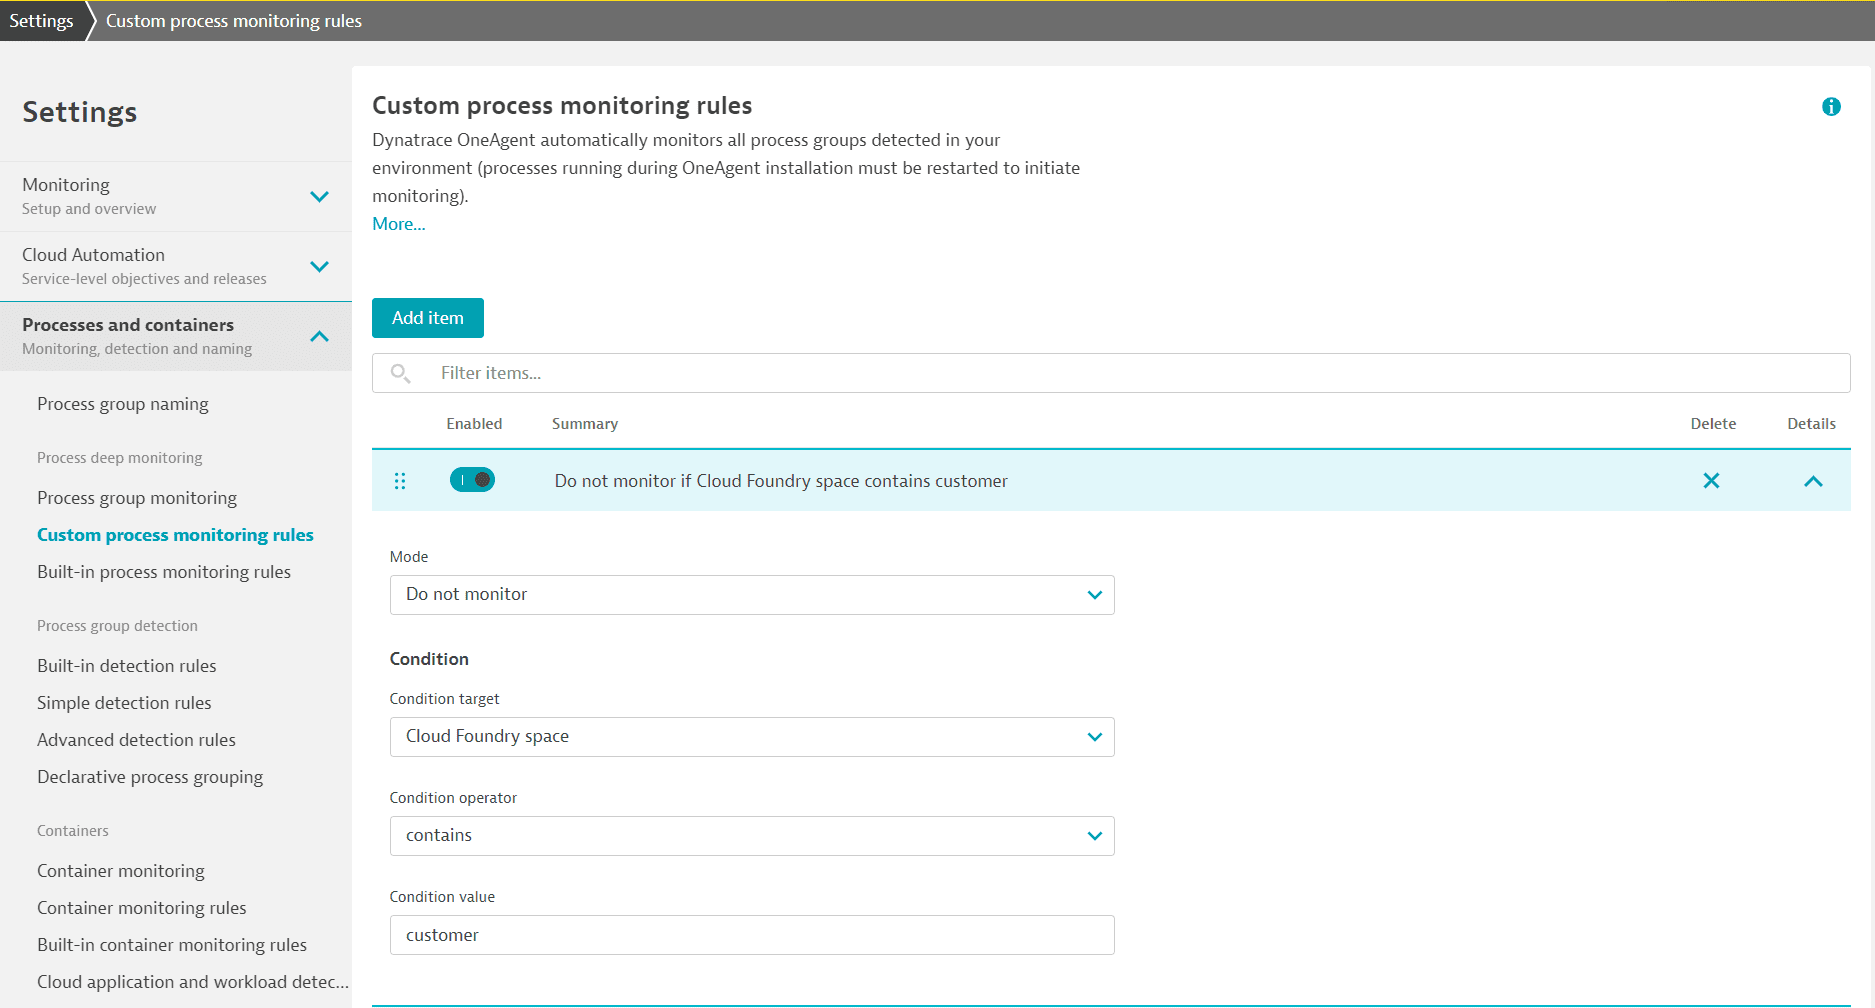
For example, you can create a rule that OneAgent shouldn't be injected into any process in Cloud Foundry spaces that contain the string customer.

To edit an existing rule
- Select the rule you want to configure.
- Select Details to edit the rule.
- Select Save changes.
To delete a rule
- Select the rule you want to delete.
- Select Delete.
- Select Save changes.
Enable or disable built-in process monitoring rules
Built-in rules apply to processes that Dynatrace monitors by default:
-
All .NET and Go Kubernetes applications
-
All .NET and Go Cloud Foundry applications
-
All .NET and Go applications deployed in Docker containers
-
ASP.NET Core applications started by IIS
-
Core components of Cloud Foundry written in Go
-
Caddy—a web server written in Go
-
InfluxDB—a timeseries database written in Go
To list all built-in rules
- Go to Settings.
- Select Processes and containers > Built-in process monitoring rules.
All built-in rules are enabled by default. You can disable them, but you can't edit the rules.
These built-in rules don't cover your own .NET and Go applications unless those applications are deployed in containers, Cloud Foundry, or Kubernetes. If this is not the case for your .NET and Go applications, you should add your own .NET and Go applications as custom monitoring rules.
Dynatrace doesn’t automatically carry out deep monitoring of all .NET and Go processes. Many popular applications such as Microsoft Office make use of .NET, and many common infrastructure components are written in Go, so Dynatrace performs deep monitoring of .NET and Go processes only if you explicitly enable it or if they are covered by monitoring rules.
Set monitoring states at the host-group level
You can set the process group monitoring states at the host-group level.
- Go to
 Hosts Classic and select the host that interests you.
 - On the host overview page, select Properties and tags.
- On the Properties and tags panel, find the Host group property to see the name of the host group to which the selected host belongs.
The Host group property is not displayed when the selected host doesn't belong to any host group.
- Select the host group name to list all hosts in that host group. This displays the OneAgent deployment page filtered by the selected host group. Each listed host has a Host group:
<group name>link, where<group name>is the name of the host group that you want to configure. - Select the host group name in any row.
- In the host group settings, expand Process monitoring and then select one of the options available to configure monitoring rules.
The process group settings on host groups override the environment-wide process group settings.
Set monitoring states at the host level
You can add a process group and define its monitoring states at the host level.
- Go to
 Hosts Classic.
 - Find and select your host to display the host overview page.
- In the upper-right corner of the host overview page, select More (…) > Settings.
-
In the host settings, select Process group monitoring.
-
Select Add process group and choose a process group from the dropdown list.
-
Set the Monitoring state (
Monitor,Do not monitor, orDefault).Monitoring state option Description Monitor
Process group settings at the host level override the corresponding settings at the host group and environment levels.
Do not monitor
Process group settings at the host level override the corresponding settings at the host group and environment levels.
Default
Monitoring state is inherited from the previous level settings.
Limitations
-
Deep monitoring rules only affect service- and code-level monitoring.
-
Deep monitoring rules are only effective when you install OneAgent on your hosts or images.
-
Application-only integrations without a full OneAgent installation don’t support monitoring rules. However, in such situations, the integrations themselves effectively provide the same level of control over your process monitoring setup.
-
Rules may work on earlier versions of OneAgent, but they’re only supported for OneAgent version 1.151+.
Enable or disable short-lived process monitoring
Short-lived processes are processes that are not detected by OneAgent in its default 10-second cycle. We are able to partially monitor them and assign them to specific process groups using the information about their parent process.
To turn monitoring of short-lived processes on or off via the OneAgent host monitoring:
- Go to Settings > Processes and containers > Built-in detection rules.
- Turn Monitor short lived processes on or off.
Additionally, short-lived processes that frequently restart and are injected by OneAgent automatic injection can be overly burdened by the injection overhead. This can lead to potential delays in these processes, with limited data collection benefits due to their short run times.
If short-lived processes that start up frequently are being injected, disable them for deep monitoring to prevent delays caused by our process injection logic.