Ingest Microsoft Defender XDR detection findings
- Latest Dynatrace
- Extension
- Published Oct 05, 2026
Ingest detection findings from Microsoft Defender XDR into Dynatrace. Dynatrace enriches the detections with the entities it monitors, so you can prioritize threats that affect your production systems.
This page covers Microsoft Defender XDR. For container vulnerability findings from Microsoft Defender for Cloud, see Ingest Microsoft Defender for Cloud security events.
Get started
Overview
The Dynatrace integration with Microsoft Defender XDR lets you unify and contextualize security detections across DevSecOps tools and products. It facilitates centralized prioritization, visualization, and automation of security findings.
Microsoft Defender XDR surfaces alerts from Microsoft security products, including Defender for Endpoint, Defender for Identity, Defender for Office 365, Defender for Cloud Apps, Microsoft 365 Defender, and other Microsoft Graph security sources.
Dynatrace observes and monitors the infrastructure and application layers to help keep your organizational services and applications performant and reliable.
By ingesting Microsoft Defender XDR detections and enriching them with the monitored entities, Dynatrace gives operations teams an additional level of security visibility and uncovers blind spots they previously had.
Use cases
With the ingested data, you can accomplish various use cases, such as:
Requirements
Microsoft Defender XDR requirements
-
A Microsoft Defender XDR tenant that exposes security alerts through Microsoft Graph
alerts_v2 -
A Microsoft Entra application registration with client-credentials authentication
-
The following Microsoft Graph application permission in the application:
SecurityAlert.Read.All
-
The Microsoft Entra tenant ID, application (client) ID, and client secret
Dynatrace requirements
-
ActiveGate version 1.310+ that must
- Run the Extensions 2.0 framework
- Reach the Microsoft Defender XDR API endpoints
-
For required permissions, open Hub, select
 Extensions, then open the Technical information tab.
 -
Generate an access token with the
openpipeline.events_securityscope and save it for later. For details, see Dynatrace API - Tokens and authentication.
Activation and setup
-
In Dynatrace, open Hub.
-
Look for Microsoft Defender XDR and select Install.
-
Follow the instructions to configure the extension.
-
To verify the configuration, run the following query in
 Notebooks:fetch security.events| filter event.provider == "Microsoft Defender XDR"AND event.type == "DETECTION_FINDING"
 -
After installation, you can access and manage the extension in
Extensions. For details, see About Extensions.
Details
How it works
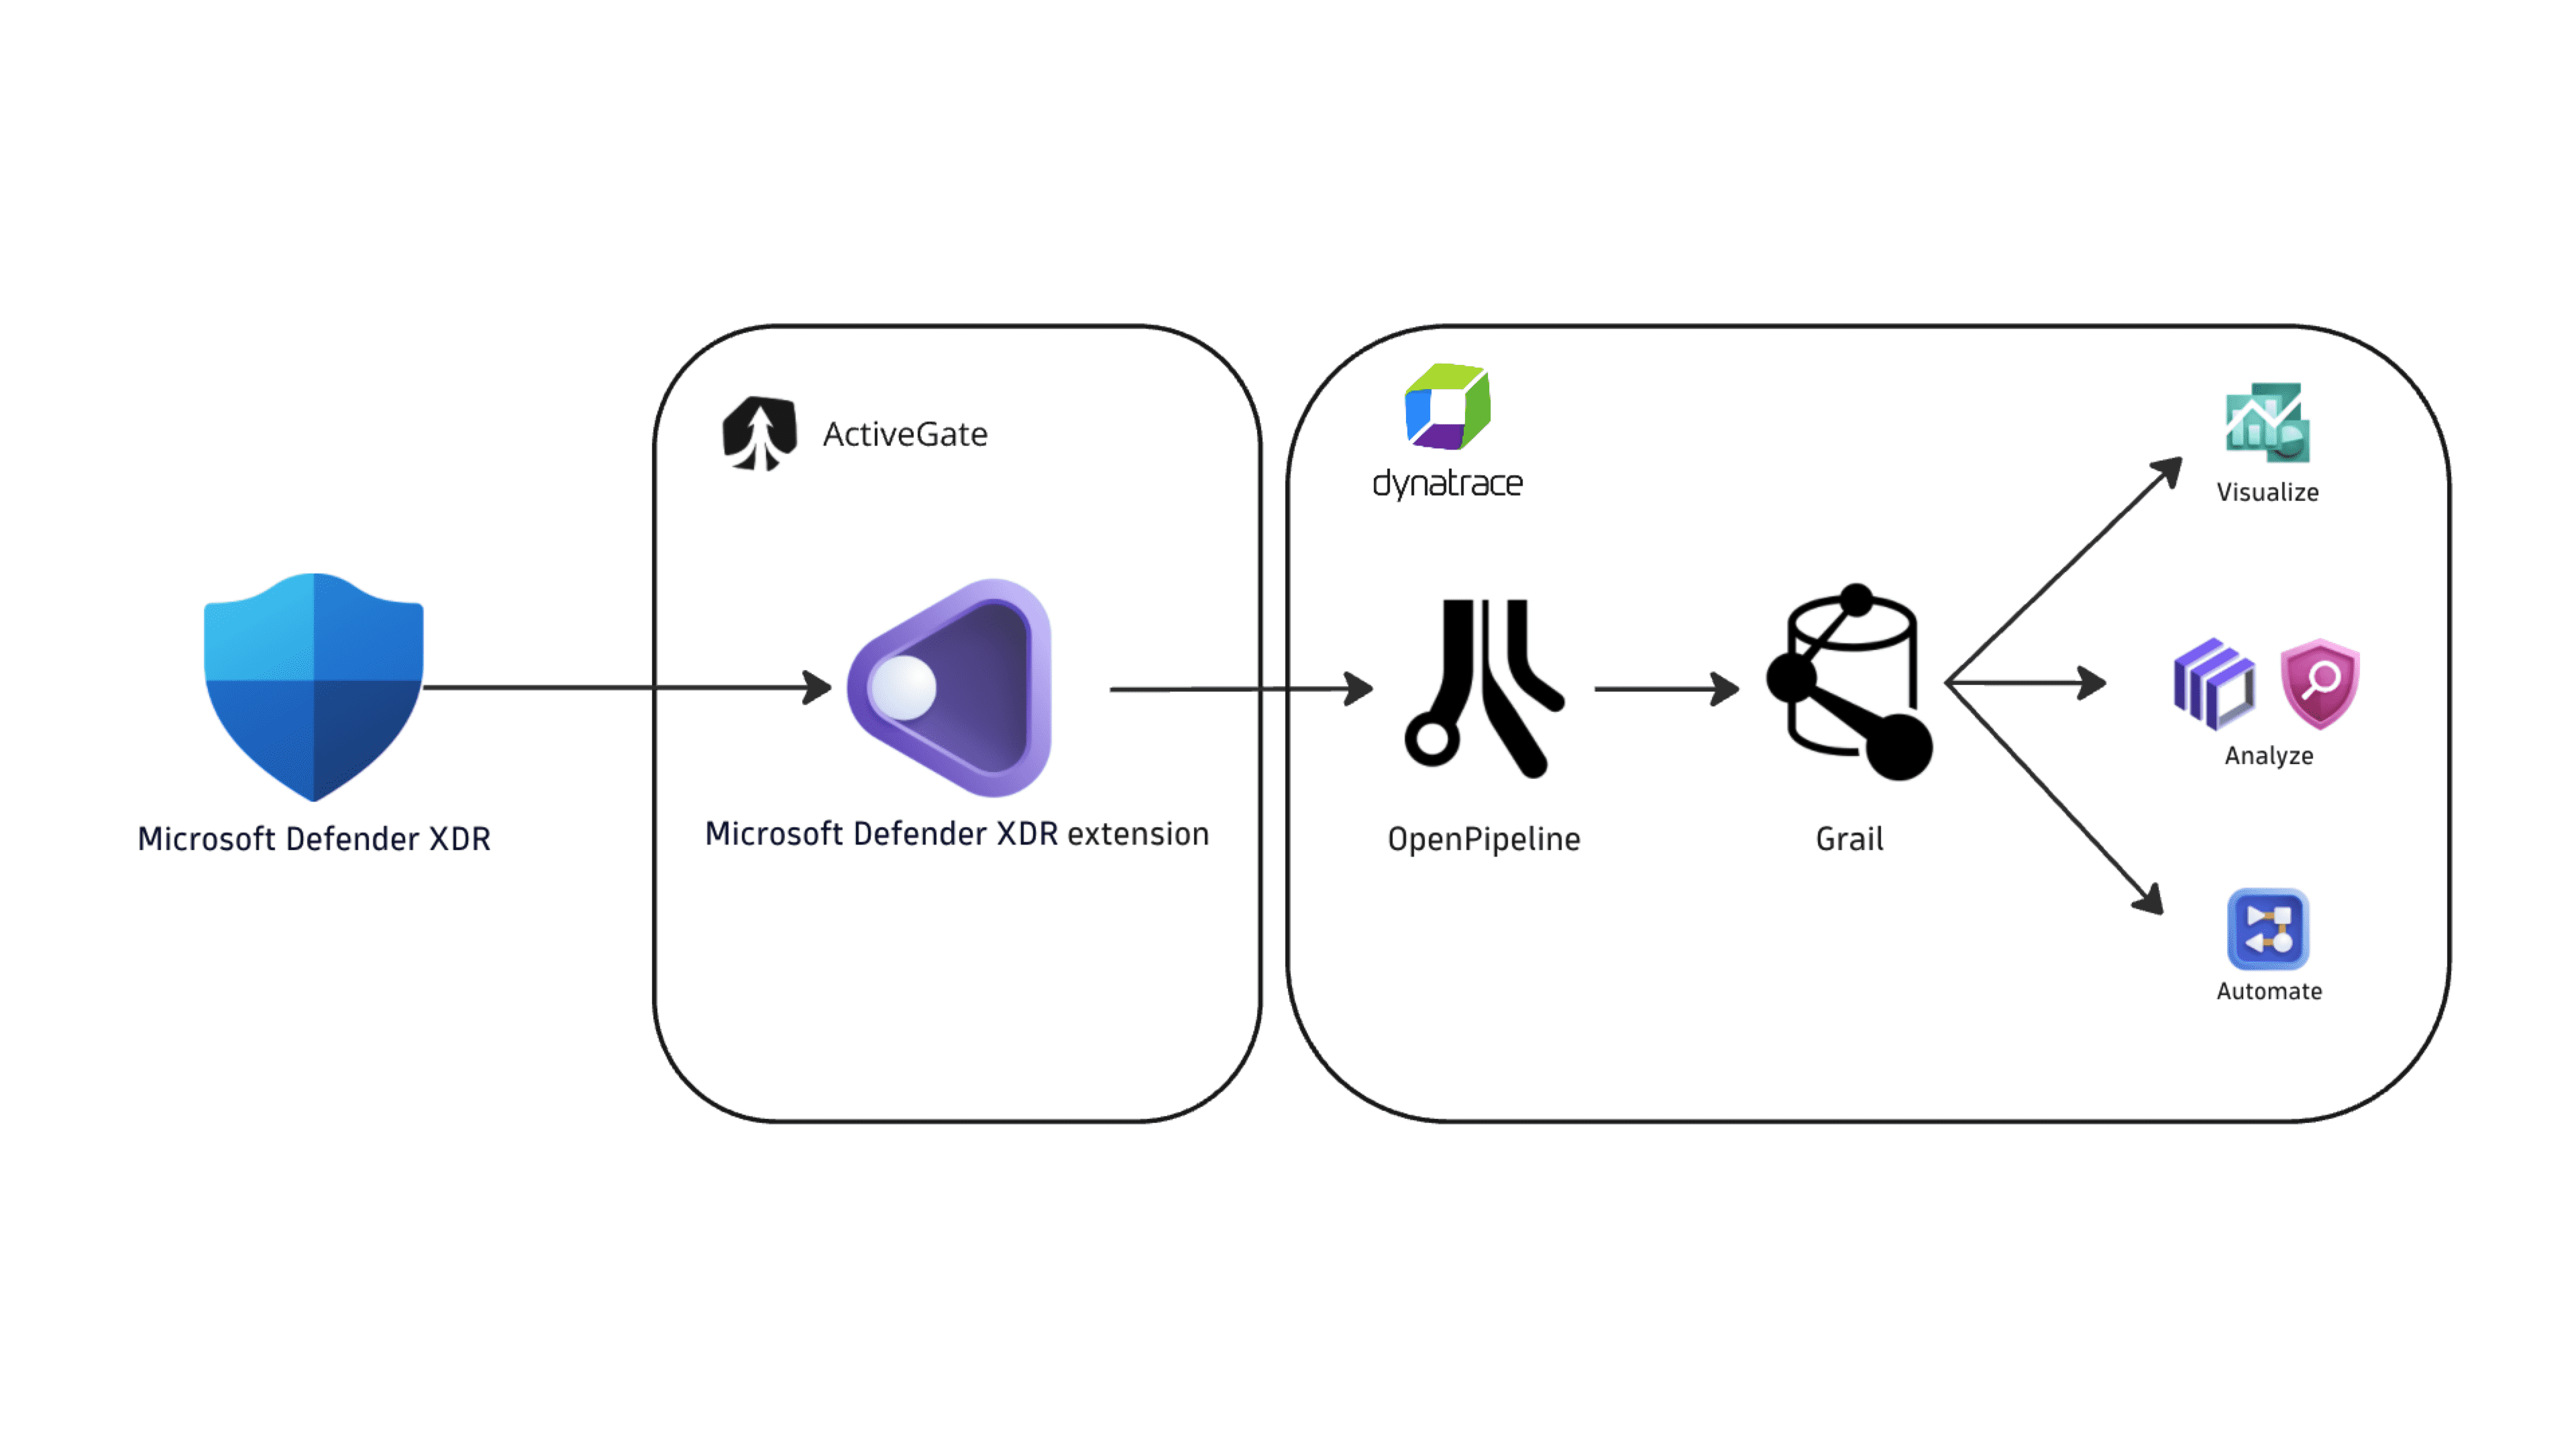
The integration runs as an extension on Dynatrace ActiveGate. After you enable and configure the Microsoft Defender XDR extension:
- The extension periodically collects security findings using the Microsoft Defender XDR APIs.
- Dynatrace ingests the fetched data and maps it to the Dynatrace Semantic Dictionary.
Licensing and costs
For billing information, see Events powered by Grail.
FAQ
Which Microsoft Defender XDR products does Dynatrace integrate with?
This integration ingests security alerts from the following products integrated into Microsoft Defender XDR:
- Microsoft Defender for Endpoint
- Microsoft Defender for Office 365
- Microsoft Defender for Identity
- Microsoft Defender for Cloud Apps
- Other security products and services supported by Microsoft Graph
alerts_v2. For the complete list, see Microsoft GraphserviceSourcevalues.
Which data model is used for the security events coming from Microsoft Defender XDR?
Detection finding events store the individual security findings retrieved from Microsoft Defender XDR. Each finding represents a Microsoft Defender alert and its associated evidence, such as affected devices, users, emails, files, or processes.
How does Dynatrace collect the Microsoft Defender XDR security findings?
The extension collects findings based on the configuration you set:
- On the first ingest, Dynatrace fetches detections generated in the last
mdays, wheremis set by the Security events initial fetch time window option in the monitoring configuration. - On subsequent runs, the extension checks for new detections every
nminutes, wherenis set by the Security events ingest frequency option in the monitoring configuration. - Only new and updated events are ingested.
Which extension fields are added on top of the core fields of the events ingested from Microsoft Defender XDR?
The ms_defender_xdr namespace stores Microsoft Defender-specific attributes on top of the core security event schema. The full upstream payload is stored in the event.original_content field.
Example fields:
ms_defender_xdr.incident.id: Microsoft Defender incident identifier.ms_defender_xdr.detection.source: Microsoft product or service that generated the detection.ms_defender_xdr.investigation.state: Current automated-investigation state reported by Microsoft.ms_defender_xdr.logged_on_users: Other logged-on accounts reported for the affected device.ms_defender_xdr.device.health_status: Health status of the affected Defender-managed device.ms_defender_xdr.device.risk_score: Risk score reported by Microsoft Defender for the device.ms_defender_xdr.device.onboarding_status: Microsoft Defender onboarding status for the device.ms_defender_xdr.device.av_status: Microsoft Defender Antivirus status.ms_defender_xdr.cloud_app.app_id: Identifier of an affected cloud application.ms_defender_xdr.cloud_app.app_name: Display name of an affected cloud application.ms_defender_xdr.mailbox_addresses: Additional mailbox addresses found in evidence.ms_defender_xdr.device_names: Additional device names found in evidence.ms_defender_xdr.user_ids: Additional user identifiers found in evidence.ms_defender_xdr.process_ids: Additional process identifiers found in evidence.
The fields are populated based on their availability in the alerts collected from different Microsoft Defender XDR sources.
Which evidence types does the integration support, and how is the object namespace populated?
The integration provides dedicated object mapping for the following Microsoft Defender XDR evidence types:
- Device evidence (
object.type=HOST) - User evidence (
object.type=USER) - Mailbox evidence (
object.type=EMAIL)
Other evidence types, such as IP, cloud application, and malware evidence, are also supported using generic object mapping logic.
The first evidence item in the alert is used to populate the object.* fields.
For these evidence types, the integration derives object.type from the evidence type and uses the first available field ending in id for object.id and object.name. If no ID is available, {evidenceType}:{createdDateTime} is used as the fallback identity.
How is risk score normalized for Microsoft Defender XDR detections?
Dynatrace normalizes severity and risk scores for all findings ingested through this integration. Normalization helps you prioritize findings consistently, regardless of their source. For details, see Severity and score normalization.
-
dt.security.risk.levelis mapped based on the severity of the Microsoft Defender XDR alert returned by the Microsoft Graphalerts_v2API. -
dt.security.risk.scoreis populated based on severity levels that are mapped to the Dynatrace 10-point security risk scale using the configured severity-to-risk mapping.
dt.security.risk.level (mapped from finding.severity) | dt.security.risk.score (mapped from dt.security.risk.level) |
|---|---|
Critical -> CRITICAL | 10.0 |
High -> HIGH | 8.9 |
Medium -> MEDIUM | 6.9 |
Low, Info -> LOW | 3.9 |
Unknown, unknownFutureValue, other -> NONE | 0.0 |