Ingest JFrog security findings and audit logs
- Latest Dynatrace
- Extension
- Published May 27, 2026
Ingest JFrog Xray vulnerability findings, scan events, and audit logs into Dynatrace as security events.
Get started
Overview
Dynatrace integration with JFrog allows you to unify and contextualize JFrog Xray security findings and audit activity across repositories and artifacts for visualization, analysis, and automation in Dynatrace.
JFrog provides security scanning capabilities through JFrog Xray, which scans artifacts and dependencies stored in JFrog Artifactory to identify security vulnerabilities, license compliance issues, and other risks.
Dynatrace ingests and enriches JFrog findings with runtime context to help DevSecOps teams filter and prioritize the risks that affect production applications and code artifacts.
Use cases
With the ingested data, you can accomplish various use cases, such as
Requirements
See below for the JFrog and Dynatrace requirements.
JFrog requirements
-
A JFrog platform account with access to the Artifactory repositories and Xray policies that should be monitored.
-
JFrog Xray enabled on your JFrog platform instance.
-
An Access Token for API authentication with the required permissions to read Xray findings and audit logs.
-
Xray watches and policies configured to generate security violations on the repositories you want to monitor.
Dynatrace requirements
-
ActiveGate version 1.310+ that needs to be able to
- Run Extensions 2.0 framework
- Reach the JFrog platform API endpoints
-
Permissions: For a list of permissions required, go to Hub, select
 Extensions, and display Technical information.
 -
Generate an access token with the
openpipeline.events_securityscope and save it for later. For details, see Dynatrace API - Tokens and authentication.
Activation and setup
-
In Dynatrace, search for JFrog and select Install.
-
Follow the on-screen instructions to configure the extension.
-
Configure audit log ingest in your JFrog Cloud Portal. For details, see the JFrog Cloud log streaming documentation.
-
The extension provides Processing in OpenPipeline to enrich the audit logs. A Configure a processing pipeline needs to be created to point the audit logs to the provided processor as follows:
- Matching condition
log.source == "jfrog_artifactory" - Target pipeline
JFrog Extension
- Matching condition
-
Verify configuration by running the following queries in
 Notebooks:
-
For audit logs:
fetch logs| filter log.source=="JFrog" -
For finding events:
fetch security.events| filter dt.system.bucket == "default_securityevents"| filter event.provider=="JFrog"AND event.type=="VULNERABILITY_FINDING" -
For scan events:
fetch security.events| filter dt.system.bucket == "default_securityevents"| filter event.provider=="JFrog"AND event.type=="VULNERABILITY_SCAN"
-
-
After the extension is installed and working, you can access and manage it in Dynatrace via
Extensions. For details, see About Extensions.
Details
How it works
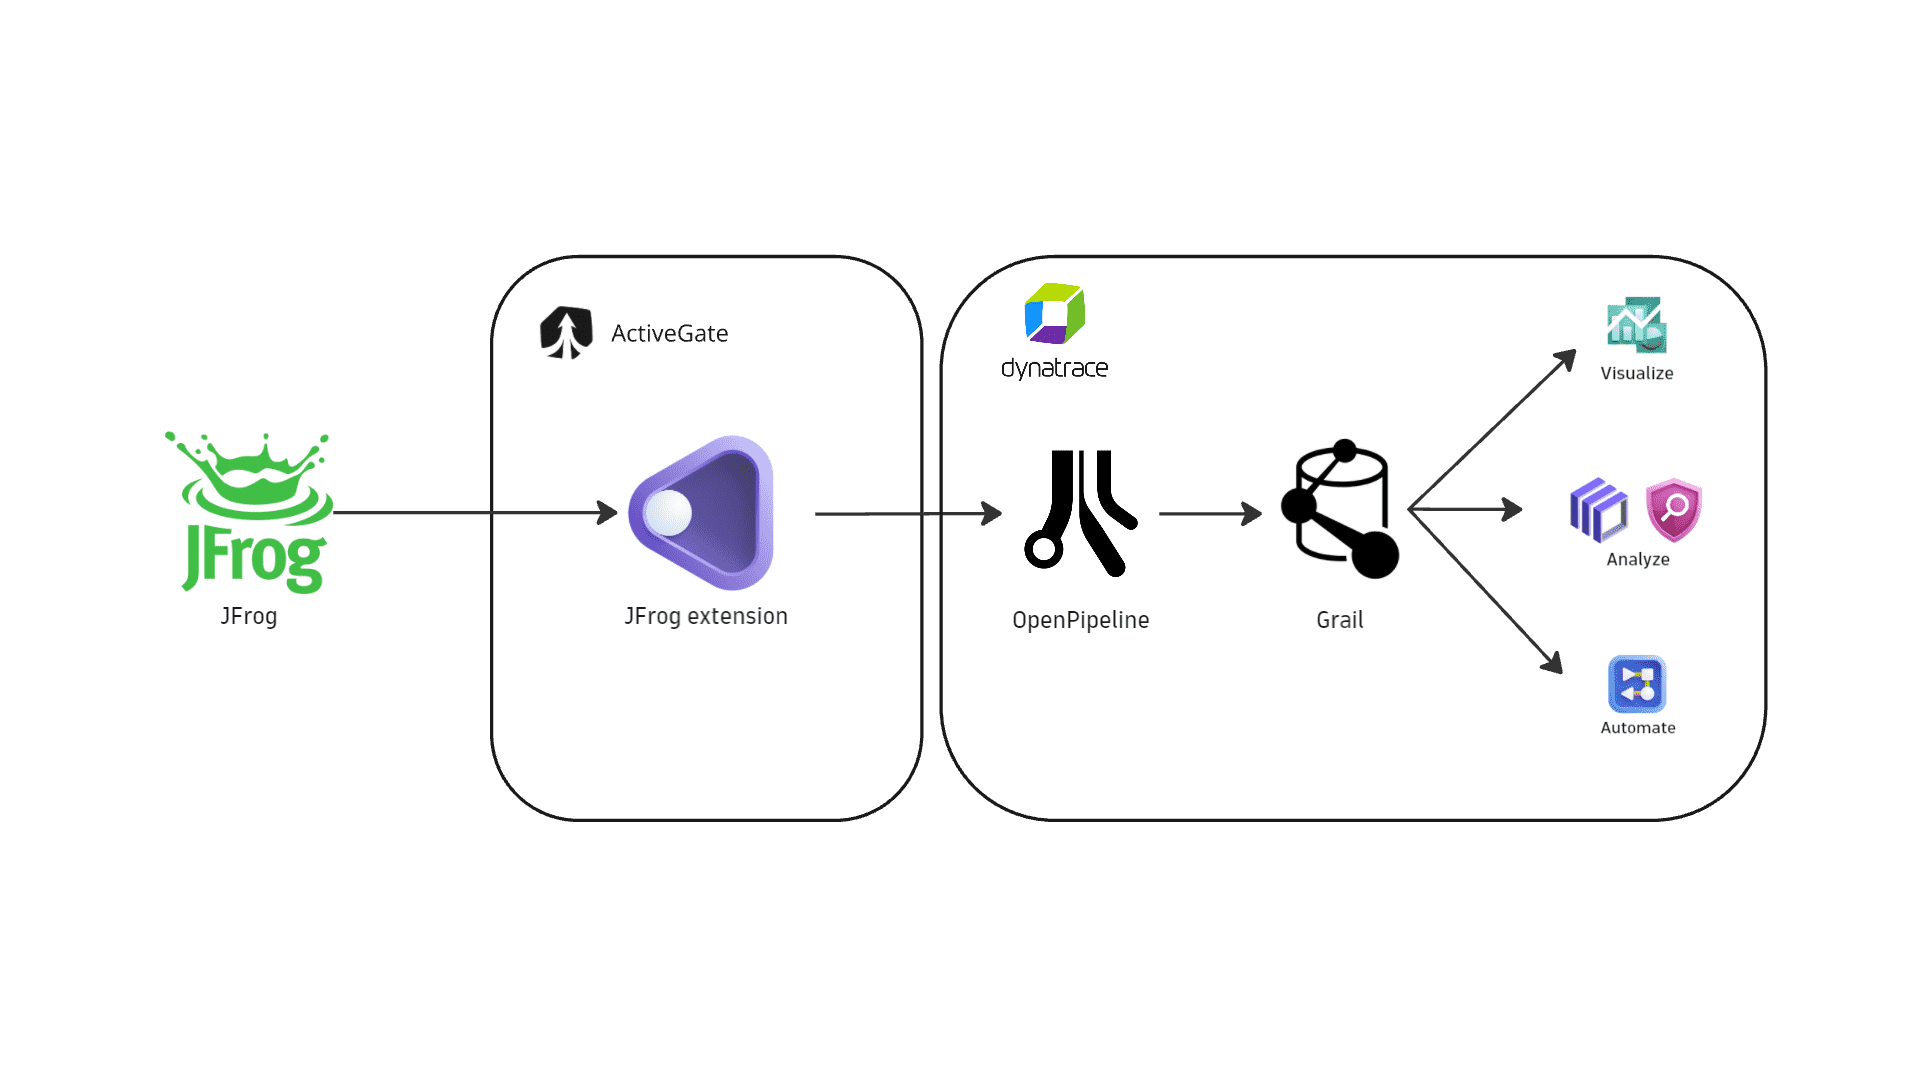
Dynatrace integration with JFrog is an extension running on Dynatrace ActiveGate. After you enable and configure the Dynatrace JFrog extension:
- It periodically collects security findings and audit logs using JFrog REST APIs.
- The fetched data is ingested into Dynatrace and mapped to the Dynatrace Semantic Dictionary.
- Data is stored in a bucket called
default_securityevents(for details, see Built-in Grail buckets).
Licensing and costs
For billing information, see Events powered by Grail.
FAQ
Which data model is used for the security logs and events coming from JFrog?
-
Vulnerability finding events store individual vulnerability findings reported by JFrog Xray for affected artifacts and components.
-
Vulnerability scan events indicate scan coverage for individual artifacts.
-
Audit logs represent user activity logs.
Which JFrog security findings are imported into Dynatrace?
-
If the extension is configured to ingest data at an interval of
nhours, then each run ingests all security events updated in the lastnhours. -
On the first ingest, Dynatrace considers findings updated in the last
mhours, wheremis the first ingest interval configured in the monitoring configuration. -
If no new or updated findings are detected, no findings are ingested.
Which extension fields are added to the core fields of events ingested from JFrog?
-
The
container_imagenamespace is added for container image related information:container_image.digestrepresents the container image digest and can be used to match runtime containers.container_image.repositoryrepresents the container repository name.container_image.registryrepresents the container registry name.
-
The
jfrognamespace is added for JFrog-specific attributes on top of the core schema. The full upstream payload is stored inevent.original_content.Example fields:
jfrog.repository.name: Artifactory repository name.jfrog.repository.type: Repository type (e.g.,local,remote,virtual).jfrog.artifact.path: Path of the affected artifact within the repository.
Which JFrog asset types are supported by Dynatrace for runtime contextualization?
-
CONTAINER_IMAGE: Findings generated by vulnerability assessments of container images stored in JFrog Artifactory are mapped with theCONTAINER_IMAGEvalue in theobject.typefield. Thecontainer_imagenamespace is added, andcontainer_image.digestis used to match ingested findings to runtime containers monitored by Dynatrace. -
CODE_ARTIFACT: Findings generated by vulnerability assessments of code artifacts are mapped with theCODE_ARTIFACTvalue in theobject.typefield. These findings aren't natively mapped to runtime entities monitored by Dynatrace.
How is risk score normalized for JFrog findings?
Dynatrace normalizes severity and risk scores for all findings ingested through this integration. This helps you prioritize findings consistently, regardless of their source. For details, see Severity and score normalization.
dt.security.risk.level is mapped from JFrog Xray severity values returned by the vulnerability findings API.
dt.security.risk.score is derived from dt.security.risk.level using Dynatrace static severity-to-score mapping.
dt.security.risk.level (mapped from finding.severity) | dt.security.risk.score (mapped from dt.security.risk.level) |
|---|---|
Critical -> CRITICAL | 10.0 |
High -> HIGH | 8.9 |
Medium -> MEDIUM | 6.9 |
Low -> LOW | 3.9 |
Unknown -> NONE | 0.0 |