Source map support for JavaScript error analysis
- How-to guide
- 4-min read
For details on mapping files for Android and symbol files for iOS or tvOS, see Upload and manage symbol files for mobile applications.
For performance improvement, JavaScript code is often transformed when it's deployed into production. A common transformation is called minification, which removes unnecessary and repetitive code without affecting how the JavaScript code is processed by the browser. The following image depicts a minified JavaScript file:

While this approach does improve performance, the disadvantage is that transformed JavaScript sources aren't human-readable. This makes the sources difficult to debug. Source maps provide immediate access to all the details of detected JavaScript errors, making it easy for you to analyze, reproduce, and fix them.

Analyze a JavaScript error using a source map
- Go to Web and select the application that you want to analyze.
- Select the Errors tile, and scroll down to the Top errors section.
- Go to the JavaScript tab, and select Analyze errors.
- Under Detail analysis for selected timeframe, select the JavaScript error that you want to analyze.
Under Error details, you can view the corresponding stack trace of the error. Error details are grouped by browser type. - Select Expand
to open a stack frame for analysis.
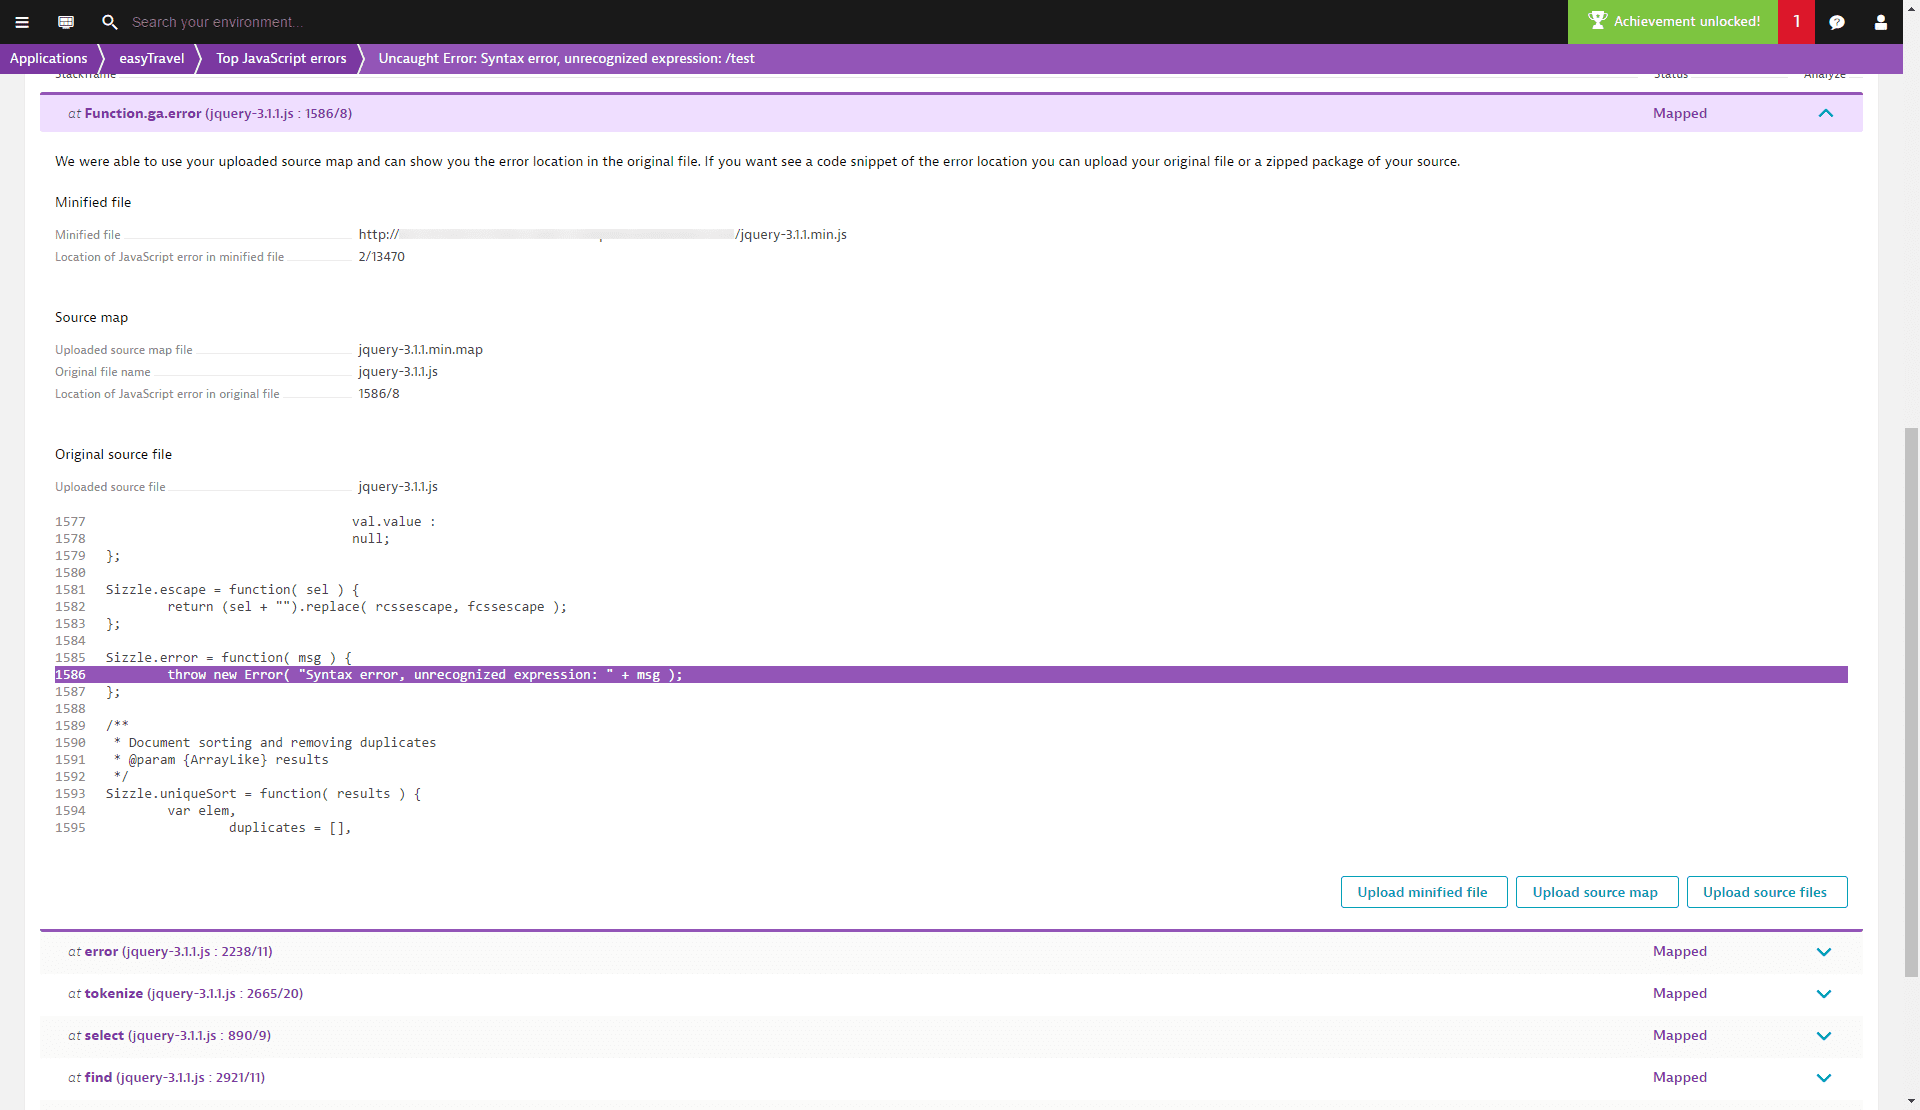
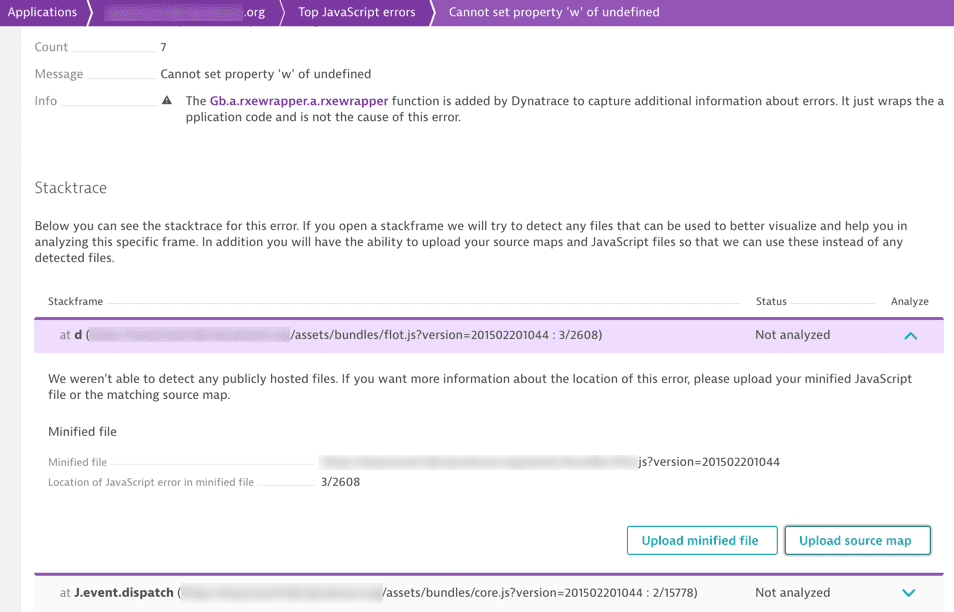
When a source map is found for your error, the origin of the detected source map and error location in the original JavaScript file are highlighted. If the source map isn't detected, you can select Upload source map and manually upload the corresponding source map.
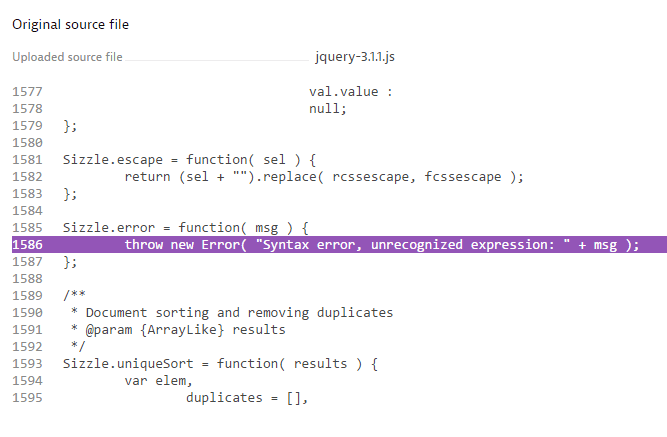
In most cases, the source maps include the original JavaScript code, and you can see the stack trace with the line of code that generated the error highlighted. The following image is one such example.

If the source map doesn't include the original JavaScript code, select Upload source files to upload the original JavaScript files.
You need the Change monitoring settings permission to upload source maps and symbol files.
Following the manual upload of a JavaScript file for the analysis of a specific stack frame, other related stack frames are automatically mapped to the same file. This saves time when you are navigating through stack frames. If you run into an error that doesn't have a corresponding source map, upload the required files.
Automatic download of source maps
Dynatrace attempts to download all available source map files automatically as follows:
- Whenever an error is triggered, Dynatrace tries to download the responsible JavaScript file.
- After the file is downloaded, Dynatrace checks whether it contains a source map reference such as
//# sourceMappingURL=http://example.com/path/to/your/sourcemap.map. Dynatrace can display the exact line number that caused the error in the successfully downloaded minified file. - If a source map contains a source map reference, Dynatrace automatically downloads it.
- With both the minified file and the corresponding source map downloaded successfully, Dynatrace can display the readable JavaScript code and the exact line number that caused the error.
For the downloads to work, both files need to be publicly accessible.
You can identify all download requests made by Dynatrace by checking the User-agent string, which is ruxit server in both cases.
Upload the source file if you're also interested in reading developer comments, which are usually stripped away during minification and obfuscation.
Upload source maps
You need the Change monitoring settings permission to upload source maps and symbol files.
All available source files are listed at Settings > Web and mobile monitoring > Source maps and symbol files.
Dynatrace automatically attempts to download all available source maps and JavaScript source files from public CDNs. You can optionally upload source maps and source files from a JavaScript error details page.
To upload a source map from a JavaScript error details page
-
Go to Web and select the application that you want to configure.
-
Select the Errors tile, and scroll down to the Top errors section.
-
Go to the JavaScript tab, and select the required error.
-
Scroll down to Stack trace, and select Expand
to open a stack frame.
-
Select Upload source map.
Note that you can upload a symbol file of up to 100 MiB compressed; the uncompressed file must not exceed 500 MiB.

Manage source maps
You can use the Dynatrace web UI to manage the previously uploaded source maps.
To list the uploaded source maps and symbol files for all your applications
- Go to Settings.
- Select Web and mobile monitoring > Source maps and symbol files.
The page displays the amount of storage that is currently used and the storage limit. When the storage limit is reached, Dynatrace begins deleting source maps and symbol files, starting with the oldest ones.
For Dynatrace SaaS, the maximum storage size for source maps and symbol files is 1 GiB.
To free up space, you can manually delete files that you no longer need. Select Delete in the row of the file you want to delete.
To prevent files from being automatically deleted when the storage limit is reached, turn on Pinned for the source maps and symbol files that you want to keep.