Add new clusters
- How-to guide
- 2-min read
- Published Jan 19, 2024
This guide walks you through the process of adding new clusters to Dynatrace.
Onboard a new cluster
Dynatrace Operator version 0.15.0+
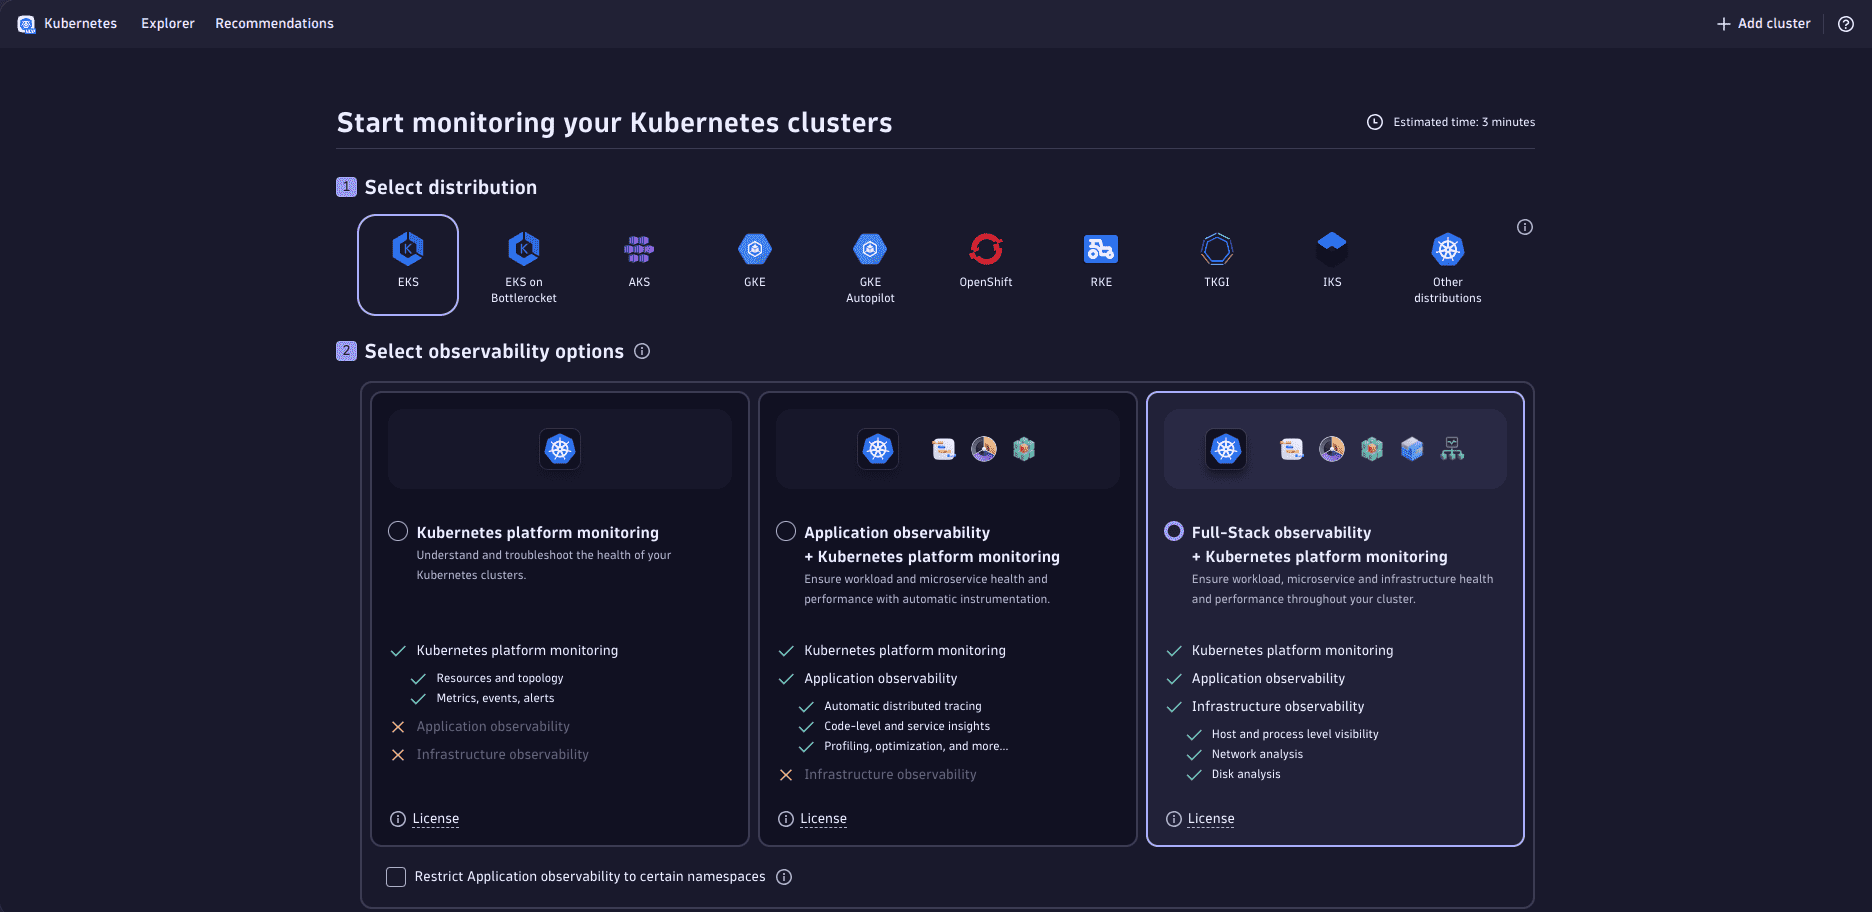
To start monitoring a new Kubernetes cluster with Dynatrace, go to Kubernetes, select Add cluster in the upper-right corner, and follow the on-screen steps as outlined below.
-
Select your distribution.
-
Select your observability options. By default, Full-Stack observability and Log Management and Analytics are enabled. If the selected distribution is GKE Autopilot or EKS on Bottlerocket, Full-Stack observability is not available and Application observability is the default option.
- optional If you want to deploy Application observability to certain namespaces only, select Restrict Application observability to certain namespaces and provide a Kubernetes namespace selector.
- optional If you want to deploy Log Management and Analytics to certain resources only, select Restrict Log monitoring to certain resources and provide the Namespaces and/or Pod Annotation to select the pods you want to monitor. When both filters are applied, only logs from pods that are in the specified namespaces and have the specified pod annotation will be ingested.
-
In Configure cluster, provide the following information.
- required Cluster name is used as display name in the Kubernetes app.
- recommended Network zone helps you to route the traffic efficiently, avoiding unnecessary traffic across data centers and network regions.
- recommended Host group enables you to categorize and manage multiple hosts that share similar characteristics or purposes within your environment. This is only available for Full-Stack observability.
-
In Install Dynatrace Operator, provide your Dynatrace Operator token, and, optionally, data ingest token.
- Select Download dynakube.yaml.
- Execute the commands provided in Install Dynatrace Operator.
- optional Verify the deployment's success. The status should be
Running.
kubectl get dynakubes -n dynatraceFor more information, see Set up Dynatrace on Kubernetes.
To collect logs, we recommend using the Dynatrace log module. However, if you decided to run your own Fluent Bit for log collection in the Log Management and Analytics section, this step guides you through a pre-configured Fluent Bit setup.
-
optional The Install Fluent Bit step is only available when Run your own Fluent Bit for log collection is selected in Log Management and Analytics. This is not available for GKE Autopilot distribution.
- Generate a token or enter an existing token with the
Ingest logsscope enabled. - Download the
fluent-bit-values.yamlfile. The download button is enabled when at least Cluster name and Fluent Bit token are set. - Execute the provided commands to complete the installation. The commands will install a fresh Fluent Bit installation (DaemonSet) on your cluster to stream enriched logs to Dynatrace.
- optional View the ingested logs. For workload enrichment, Dynatrace Operator version 1.1.0+ is required.
- Generate a token or enter an existing token with the
-
optional Wait to get successful connection signal from your cluster. Once a signal from the ActiveGate installed on your cluster is received, you can go to the cluster by selecting Go to new cluster.