Stream Kubernetes logs with Fluent Bit
- Latest Dynatrace
- Tutorial
- 5-min read
changelog:
- 2025-05-02 Move page to Log ingestion via OneAgent
We recommend Stream Kubernetes logs with Dynatrace Log Module for log ingestion as it provides improved log detection, streamlined configuration, and better support for Kubernetes environments.
This page provides instructions for deploying and configuring Fluent Bit in your Kubernetes environment for log collection.
Prerequisites
- Setup security context constraints (SCC) properly if you use OpenShift.
- Helm is required. Use Helm version 3.
- Egress traffic must be allowed from the namespace in which Fluent Bit is installed (
dynatrace-fluent-bit), to Dynatrace. - For workload enrichment, Dynatrace Operator version 1.1.0+ is required.
Customize Fluent Bit configuration
Follow the step-by-step guide to prepare the configuration for Fluent Bit.
-
Copy the sample
values.yamlfile and open it with your preferred editor.Container logs example (values.yaml)
openShift:# set to true for OpenShiftenabled: falsesecurityContext:capabilities:drop:- ALLreadOnlyRootFilesystem: true# uncomment the line below for OpenShift#privileged: truerbac:nodeAccess: trueconfig:inputs: |[INPUT]Name tailTag kube.*Path /var/log/containers/*.logDB /fluent-bit/tail/kube.dbDB.Sync Normalmultiline.parser criMem_Buf_Limit 15MBSkip_Long_Lines Onfilters: |[FILTER]Name kubernetesMatch kube.*Merge_Log OnKeep_Log OffK8S-Logging.Parser OffK8S-Logging.Exclude OffLabels OffAnnotations OnUse_Kubelet OnKubelet_Host ${NODE_IP}tls.verify OffBuffer_Size 0# Only include logs from pods with the annotation#[FILTER]# Name grep# Match kube.*# Regex $kubernetes['annotations']['logs.dynatrace.com/ingest'] ^true$# Only include logs from specific namespaces, remove the whole filter section to get all logs#[FILTER]# Name grep# Match kube.*# Logical_Op or# Regex $kubernetes['namespace_name'] ^my-namespace-a$# Regex $kubernetes['namespace_name'] ^my-namespace-b$[FILTER]Name nestMatch kube.*Operation liftNested_under kubernetesAdd_prefix kubernetes.[FILTER]Name nestMatch kube.*Operation liftNested_under kubernetes.annotationsAdd_prefix kubernetes.annotations.[FILTER]Name nestMatch kube.*Operation nestNest_under dt.metadataWildcard kubernetes.annotations.metadata.dynatrace.com/*[FILTER]Name parserMatch kube.*Key_name kubernetes.annotations.metadata.dynatrace.comParser dockerPreserve_Key falseReserve_Data true[FILTER]Name nestMatch kube.*Operation liftNested_under dt.metadataRemove_prefix kubernetes.annotations.metadata.dynatrace.com/[FILTER]Name modifyMatch kube.*# Map data to Dynatrace log formatRename time timestampRename log contentRename kubernetes.host k8s.node.nameRename kubernetes.namespace_name k8s.namespace.nameRename kubernetes.pod_id k8s.pod.uidRename kubernetes.pod_name k8s.pod.nameRename kubernetes.container_name k8s.container.nameAdd k8s.cluster.name ${K8S_CLUSTER_NAME}Add k8s.cluster.uid ${K8S_CLUSTER_UID}# deprecated, but still in useAdd dt.kubernetes.cluster.name ${K8S_CLUSTER_NAME}Add dt.kubernetes.cluster.id ${K8S_CLUSTER_UID}Remove_wildcard kubernetes.outputs: |# Send data to Dynatrace log ingest API[OUTPUT]Name httpMatch kube.*host ${DT_INGEST_HOST}port 443tls Ontls.verify Onuri /api/v2/logs/ingestformat jsonallow_duplicated_headers falseheader Authorization Api-Token ${DT_INGEST_TOKEN}header Content-Type application/json; charset=utf-8json_date_key timestampjson_date_format iso8601log_response_payload falsedaemonSetVolumes:- hostPath:path: /var/lib/fluent-bit/name: positions- hostPath:path: /var/log/containersname: containers- hostPath:path: /var/log/podsname: podsdaemonSetVolumeMounts:- mountPath: /fluent-bit/tailname: positions- mountPath: /var/log/containersname: containersreadOnly: true- mountPath: /var/log/podsname: podsreadOnly: truepodAnnotations:dynatrace.com/inject: "false"# Uncomment this to collect Fluent Bit Prometheus metrics# metrics.dynatrace.com/path: "/api/v1/metrics/prometheus"# metrics.dynatrace.com/port: "2020"# metrics.dynatrace.com/scrape: "true"envWithTpl:- name: K8S_CLUSTER_UIDvalue: '{{ (lookup "v1" "Namespace" "" "kube-system").metadata.uid }}'env:- name: K8S_CLUSTER_NAMEvalue: "{ENTER_YOUR_CLUSTER_NAME}"- name: DT_INGEST_HOSTvalue: "{your-environment-id}.live.dynatrace.com"- name: DT_INGEST_TOKENvalue: "{ENTER_YOUR_INGEST_TOKEN}"- name: NODE_IPvalueFrom:fieldRef:apiVersion: v1fieldPath: status.hostIP -
Get a Dynatrace API token with the
logs.ingest(Ingest Logs) scope for theDT_INGEST_TOKENenvironment variable. -
Update the
K8S_CLUSTER_NAME,DT_INGEST_HOST, andDT_INGEST_TOKENenvironment variables in thevalues.yamlfile. Use the same cluster name that you have configured in Dynatrace forK8S_CLUSTER_NAME, and specify your SaaS or Managed endpoint asDT_INGEST_HOST. -
Optional Adapt the filter section in the
values.yamlfile to target specific namespaces or pods. -
Optional Be sure to remove or mask any sensitive information in the logs.
-
Save the file.
Install and configure Fluent Bit with Helm
-
Add the fluent repository to your local Helm repositories
helm repo add fluent https://fluent.github.io/helm-charts -
Update the Fluent Bit repository
helm repo update -
Install Fluent Bit with the prepared configuration
helm install fluent-bit fluent/fluent-bit -f values.yaml --create-namespace --namespace dynatrace-fluent-bit
View ingested logs
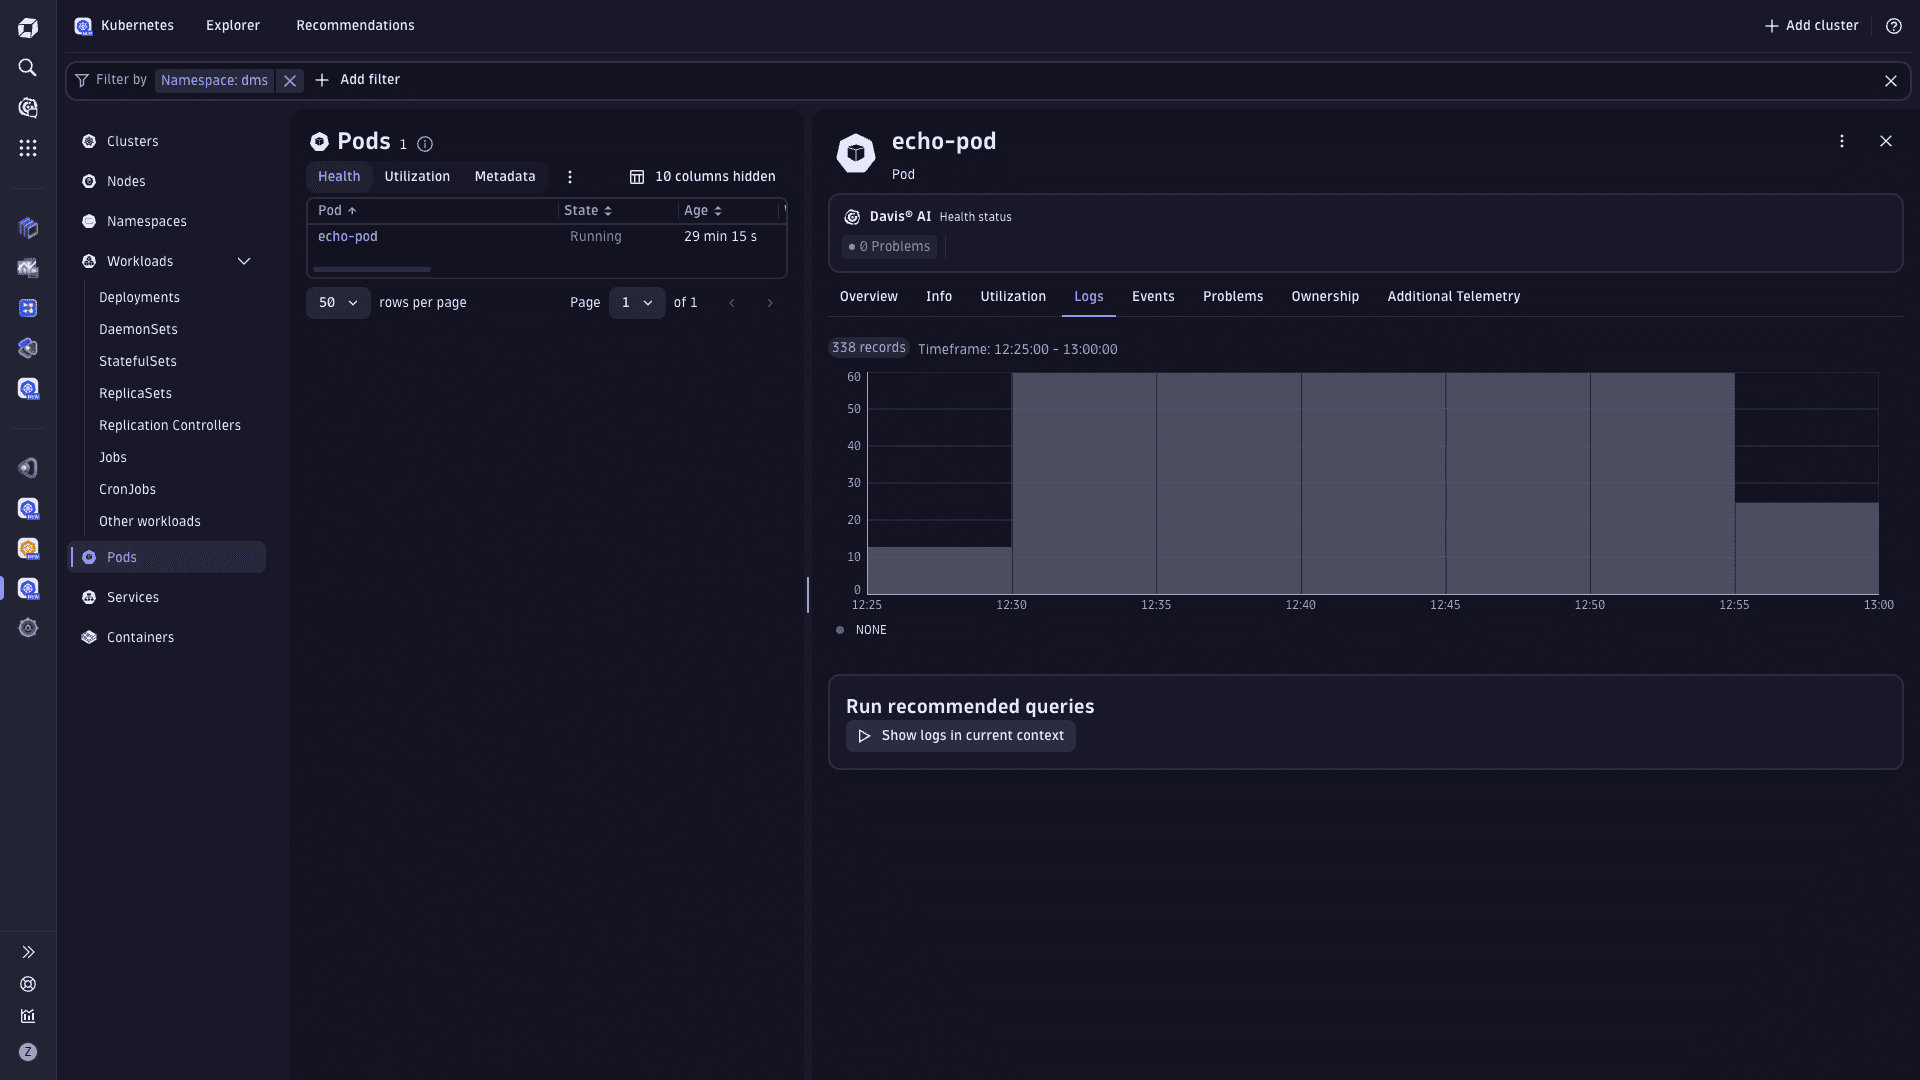
Ingested logs are accessible at the cluster, namespace, workload, and pod levels. They can be inspected on the object's details page by selecting Explorer in the Kubernetes app and selecting a cluster, namespace, workload, or pod from the list. The Logs tab displays logs either as a graph or a list.

Limitations
- GKE Autopilot is not supported.
fluentbit.io/parserandfluentbit.io/excludeannotations are disabled by default.
Troubleshooting
Visit Troubleshooting logs ingested via Fluent Bit in the Dynatrace Community, as well as see Troubleshooting Log Management and Analytics.
Check that Fluent Bit pods are running
kubectl get pods -n dynatrace-fluent-bit
NAME READY STATUS RESTARTS AGEfluent-bit-5jzlr 0/1 CrashLoopBackOff 1 (7s ago) 11sfluent-bit-8zfr4 1/1 Running 0 38sfluent-bit-qxjzh 1/1 Running 0 39s
If pods are in an error state, then the helm values file might contain errors. Check logs of the non-running pods for details.
kubectl logs fluent-bit-5jzlr -n dynatrace-fluent-bit
Check Fluent Bit health and metrics
Fluent Bit metrics give you insights into how the logs are being collected (fluentbit_input_*), filtered (fluentbit_filter_*) and sent to Dynatrace (fluentbit_output_*).
-
Find the node on which the pod you are troubleshooting is running.
kubectl get pod pod-with-logs -o wide -n dmsNAME READY STATUS RESTARTS AGE IP NODE NOMINATED NODE READINESS GATESpod-with-logs 1/1 Running 0 31m 10.28.2.41 some-node-782e86b8-mnoz <none> <none> -
Find the Fluent Bit pod that runs on the same node.
kubectl get pods -o wide -n dynatrace-fluent-bitNAME READY STATUS RESTARTS AGE IP NODE NOMINATED NODE READINESS GATESfluent-bit-5jzlr 1/1 Running 0 30m 10.28.3.44 some-node-782e86b8-zdb1 <none> <none>fluent-bit-8zfr4 1/1 Running 0 30m 10.28.4.23 some-node-782e86b8-mkjw <none> <none>fluent-bit-qxjzh 1/1 Running 0 30m 10.28.2.42 some-node-782e86b8-mnoz <none> <none> -
Set up Fluent Bit pod metrics port forwarding to your localhost.
kubectl port-forward fluent-bit-qxjzh 2020:2020 -n dynatrace-fluent-bit -
Check the health endpoint.
curl http://127.0.0.1:2020/api/v1/healthok -
Examine the metrics.
fluentbit_output_proc_*metrics indicate how many logs are being ingestedfluentbit_*metrics give you more insights into what happens before that
curl http://127.0.0.1:2020/api/v2/metrics | grep fluentbit_output_proc2024-06-11T07:05:37.257418778Z fluentbit_output_proc_records_total{name="http.0"} = 7672024-06-11T07:05:37.257418778Z fluentbit_output_proc_bytes_total{name="http.0"} = 359630 -
When
fluentbit_output_errors_totalorfluentbit_output_retries_failed_totalmetrics indicate problems, a potential reason is that you have reached log monitoring limits.