Stream NetFlow to Dynatrace with Fluentd
- Latest Dynatrace
- Tutorial
- 4-min read
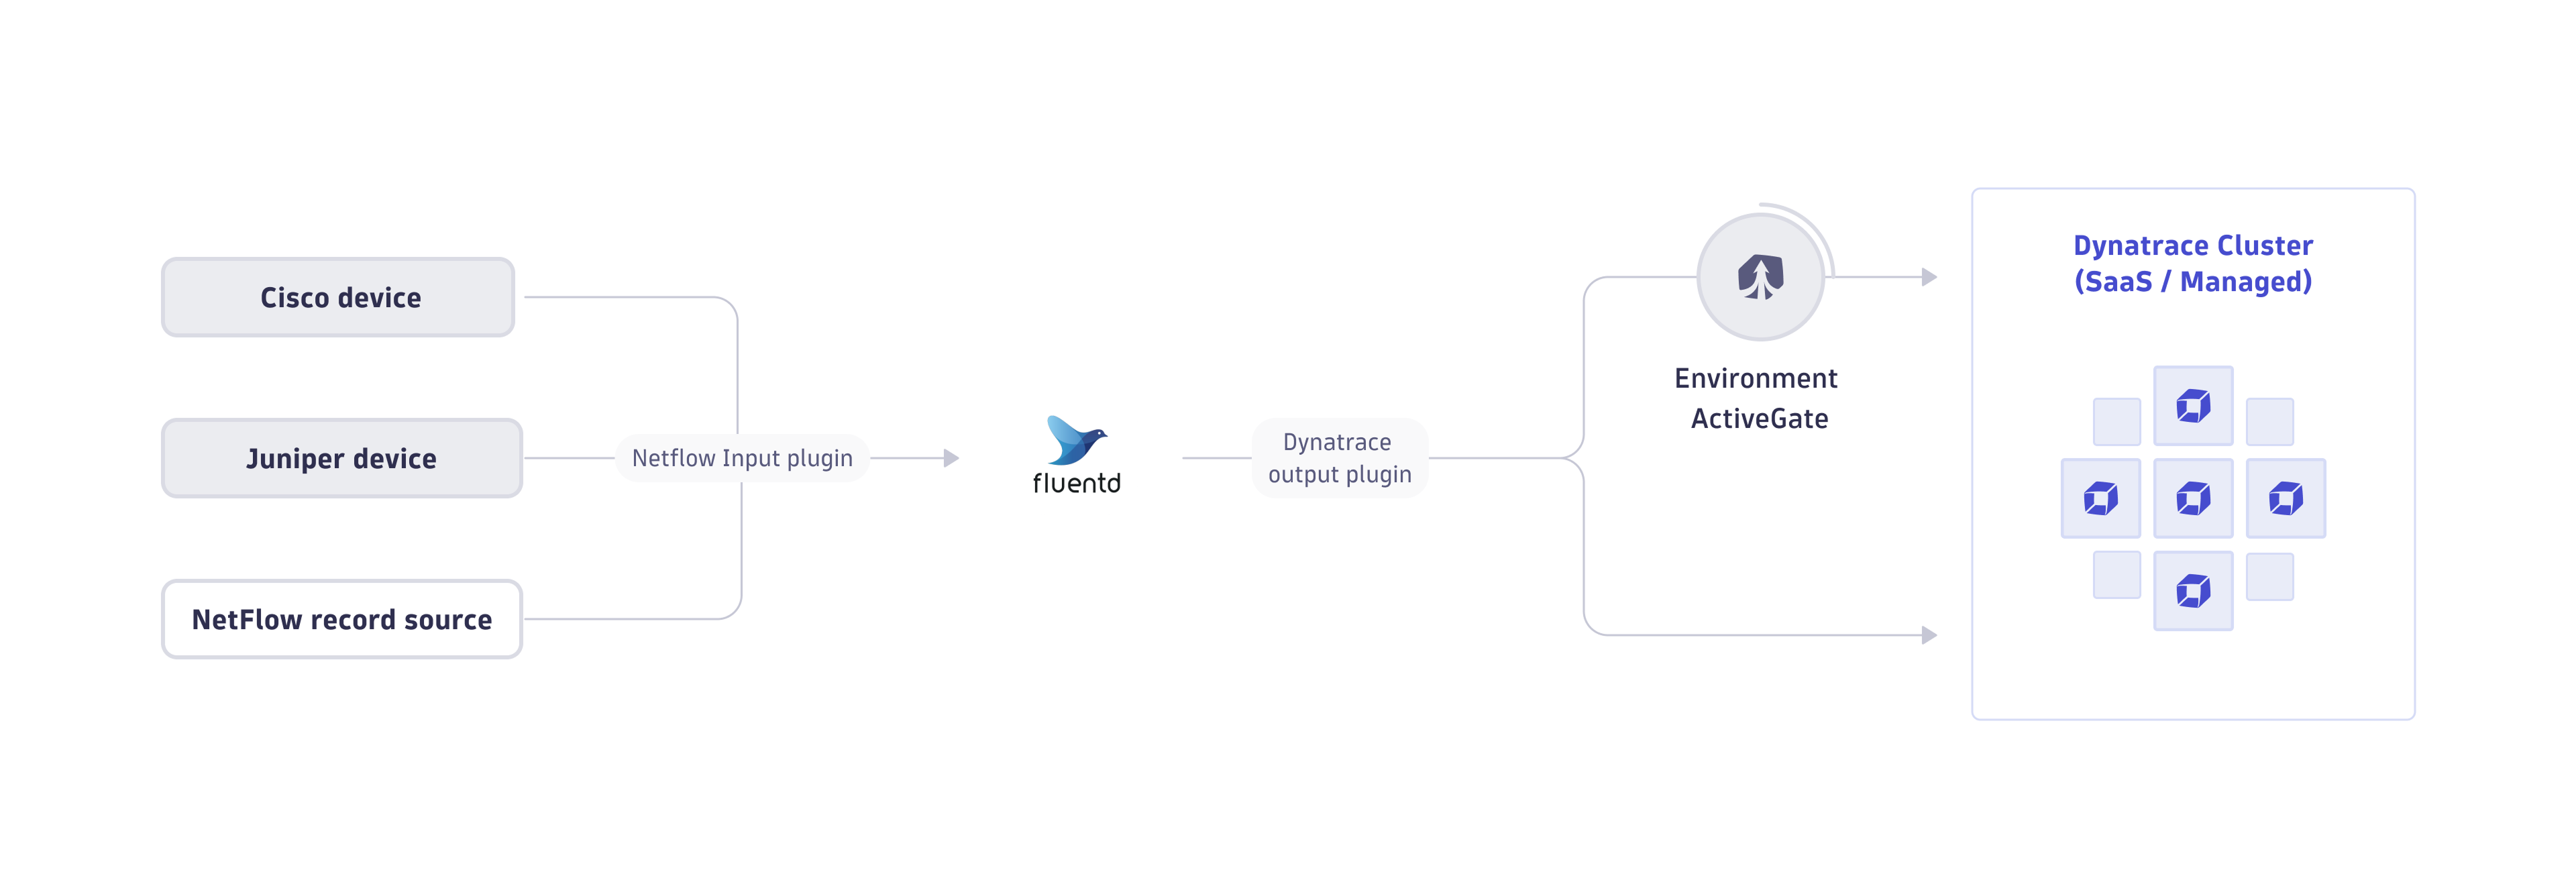
You can send network flows to Dynatrace using Fluentd. Configure the Fluentd plugin to send NetFlow records to Dynatrace generic ingest API. Other Fluentd plugins, which offer support for other NetFlow protocols like IPFIX or sFlow, are available as well.
Capabilities
- NetFlow is a network protocol that collects IP traffic information and monitors network flows. By analyzing the data provided by NetFlow, a network administrator can determine the source and destination of traffic, class of service, and causes of congestion.
- A network device with NetFlow enabled listens to the traffic and aggregates the data, which can then be processed using the capabilities of Dynatrace Log Management, Analytics powered by Grail, and Dynatrace AI-driven root cause analysis.
Configuration
Set up the pipeline from NetFlow records producer over Fluentd to Dynatrace with the following steps:
- Get a Dynatrace API token with the
logs.ingest(Ingest Logs) scope. - Deploy Fluentd according to your preferences.
- Deploy Fluentd. Fluentd can also run as a DaemonSet in a Kubernetes cluster. Built-in resiliency ensures data completeness and consistency even if Fluentd or an endpoint service temporarily goes down.
- Install a NetFlow Fluentd plugin, for example, repeatedly.
- Configure the NetFlow plugin:
By default, the plugin is configured to receive NetFlow v9 packets from any source (0.0.0.0) on port 5140, with a 4000-second cache refresh timeout. If these parameters meet the requirements, nothing else is needed. However, the following parameters can be modified to fit specific needs:<source>@type netflowtag netflow.event# optional parametersbind 0.0.0.0port 5140cache_ttl 4000versions 9definitions /path/to/custom_fields.yaml</source>
- Use the Dynatrace Fluentd plugin to stream logs created by the NetFlow Fluentd plugin to Dynatrace. The open-source Dynatrace Fluentd plugin uses generic log ingestion via Log Monitoring API v2 - POST ingest logs.
- Point your network devices to send NetFlow records to Fluentd.
Send NetFlow records to a remote endpoint
In the example below, you can configure a Cisco network device to send NetFlow records to Fluentd. The actual NetFlow configuration may vary between Cisco device models and versions.
-
Configuration at the global level:
ip flow-export destination 192.168.0.1 2055ip flow-export source lo0ip flow-export version 9ip flow-cache timeout active 1ip flow-cache timeout inactive 15snmp-server ifindex persist -
Enable NetFlow on each layer-3 interface you're interested in monitoring traffic for:
interface <interface>ip flow ingress
Add attributes to NetFlow in Fluentd
The Dynatrace unified observability platform and Dynatrace Intelligence depend on context-rich, quality data. You can provide the context for your data ingested via Generic log ingest API that supports a set of keys and semantic attributes. You can also provide custom attributes that don't require indexing in Grail.
Example
Add the log.source attribute based on the source of the NetFlow records in Fluentd. The NetFlow records often need additional context to differentiate sources during analysis. In this example, two separate NetFlow endpoints are exposed in Fluentd: one for the firewall devices belonging to the DMZ (demilitarized zone) network using UDP port 2055 and the other for the edge routers using another port. This helps decorate log streams with meaningful log.source attribute. The Fluentd configuration file needs to look like this:
<source>@type netflowport 2055bind 0.0.0.0tag dmz</source><source>@type netflowport 9995bind 10.10.10.1tag edge</source>
You need to add log.source attribute based on the Fluentd tag.
<filter dmz.**>@type record_transformer<record>log.source "cisco dmz"</record></filter><filter edge.**>@type record_transformer<record>log.source "cisco edge"</record></filter>
Refer to the Fluentd record_transformer filter plugin documentation for more details.
Conclusion
Once Fluentd is configured to send NetFlow records to Dynatrace, the network flow records will appear on the Log and Events page or in the Log & Events app.
Grail users can create metrics out of NetFlow records found in logs. This further enhances the value of the network flows by leveraging  Anomaly Detection.