Getting started with Kubernetes experience
- Latest Dynatrace
- Explanation
- 4-min read
To take advantage of the new Kubernetes experience, you can either add new Kubernetes clusters or enable existing Kubernetes clusters for the new experience.
Add new clusters
Start monitoring Kubernetes clusters with Dynatrace.
Enable existing clusters
Enable existing clusters that are already monitored with Kubernetes Classic for the new Kubernetes experience.
Prerequisites
- Dynatrace SaaS environment powered by Grail and AppEngine
- DPS license that includes the Kubernetes Platform Monitoring capability
- Sufficient permissions to use
") Kubernetes within your Dynatrace environment
Kubernetes within your Dynatrace environment - ActiveGate version 1.279+
FAQ
What if I don't have Dynatrace Platform Subscription (DPS) or I'm not on the SaaS platform powered by Grail?
You can’t access the new Kubernetes experience. You can continue to use Kubernetes Classic pages. We continue to support and innovate the existing product, but we encourage you to switch to the new platform to benefit from the latest platform innovations.
What if I do have DPS but miss the Kubernetes Platform Monitoring capability?
If you are already using DPS, reach out to your Dynatrace representative to add pricing for Kubernetes Platform Monitoring to your rate card. Customers who sign their DPS contract after February 2024 will have this capability included by default on their rate card.
Can I still use the Kubernetes classic pages after I activate clusters for the Kubernetes?
Until further notice, the existing Kubernetes pages (Kubernetes Classic) will still be available and show the data for your Kubernetes clusters.
Do I need to change my rollout with Dynatrace Operator to use the Kubernetes?
Kubernetes doesn't require mandatory changes to the rollout. The minimum requirement is an ActiveGate version 1.279 or higher configured with Kubernetes Platform Monitoring ActiveGate capability. If you use Dynatrace Operator with default configurations (no specific ActiveGate image/tag), the ActiveGate is automatically upgraded, so that you don't need to take action.
You can use the onboarding screen in Kubernetes to onboard new clusters. It will always use the latest Dynatrace Operator.
Can I use the new experience for any Kubernetes environment?
Kubernetes provides valuable insights for all Kubernetes distibutions supported by Dynatrace. There is no difference in supported distributions between Kubernetes and Kubernetes Classic. Kubernetes is optimized for customers with Kubernetes environments ranging up to 100.000 pods.
What permissions does a user need to access the Kubernetes?
Users need a set of permissions to read and access relevant data from Grail to use Kubernetes. You can find more details about required permissions in the reference section.
What is the impact on my DPS consumption if I monitor my Kubernetes clusters with the new experience?
-
Clusters monitored with Kubernetes Platform Monitoring will consume your DPS commit based on the Kubernetes Platform Monitoring price (cost per pod-hour) specified on your rate card.
-
Clusters monitored with Kubernetes Platform Monitoring and Application observability will consume your DPS commit based on the Kubernetes Platform Monitoring price (cost per pod-hour) and container-based Full-Stack price (cost per GiB-hour of used container memory) specified on your rate card.
-
Clusters monitored with Kubernetes Platform Monitoring and Full-Stack observability will consume your DPS commit based on the host-based Full-Stack price (cost per GiB-hour of host memory) specified on your rate card.
- Pods running on Full-Stack monitored Kubernetes hosts do not consume DPS Kubernetes Platform Monitoring.
- Pods that aren't running on Full-Stack monitored Kubernetes hosts (for example, pods stuck in Pending state) will still consume DPS Kubernetes Platform Monitoring.
- OneAgent version 1.301+ is required for including Kubernetes Platform Monitoring in the host-based Full-Stack package.
-
If you deactivate the new Kubernetes experience in the settings of your cluster, consumption of DPS Kubernetes Platform Monitoring will stop.
What are top-level workloads?
A top-level workload is the topmost controlling owner of a Pod. Possible top-level workload types are: Deployment, ReplicaSet, StatefulSet, DaemonSet, Job, CronJob, ReplicationController, DeploymentConfig. You can find a list of those workloads in the Top-level workloads menu entry.
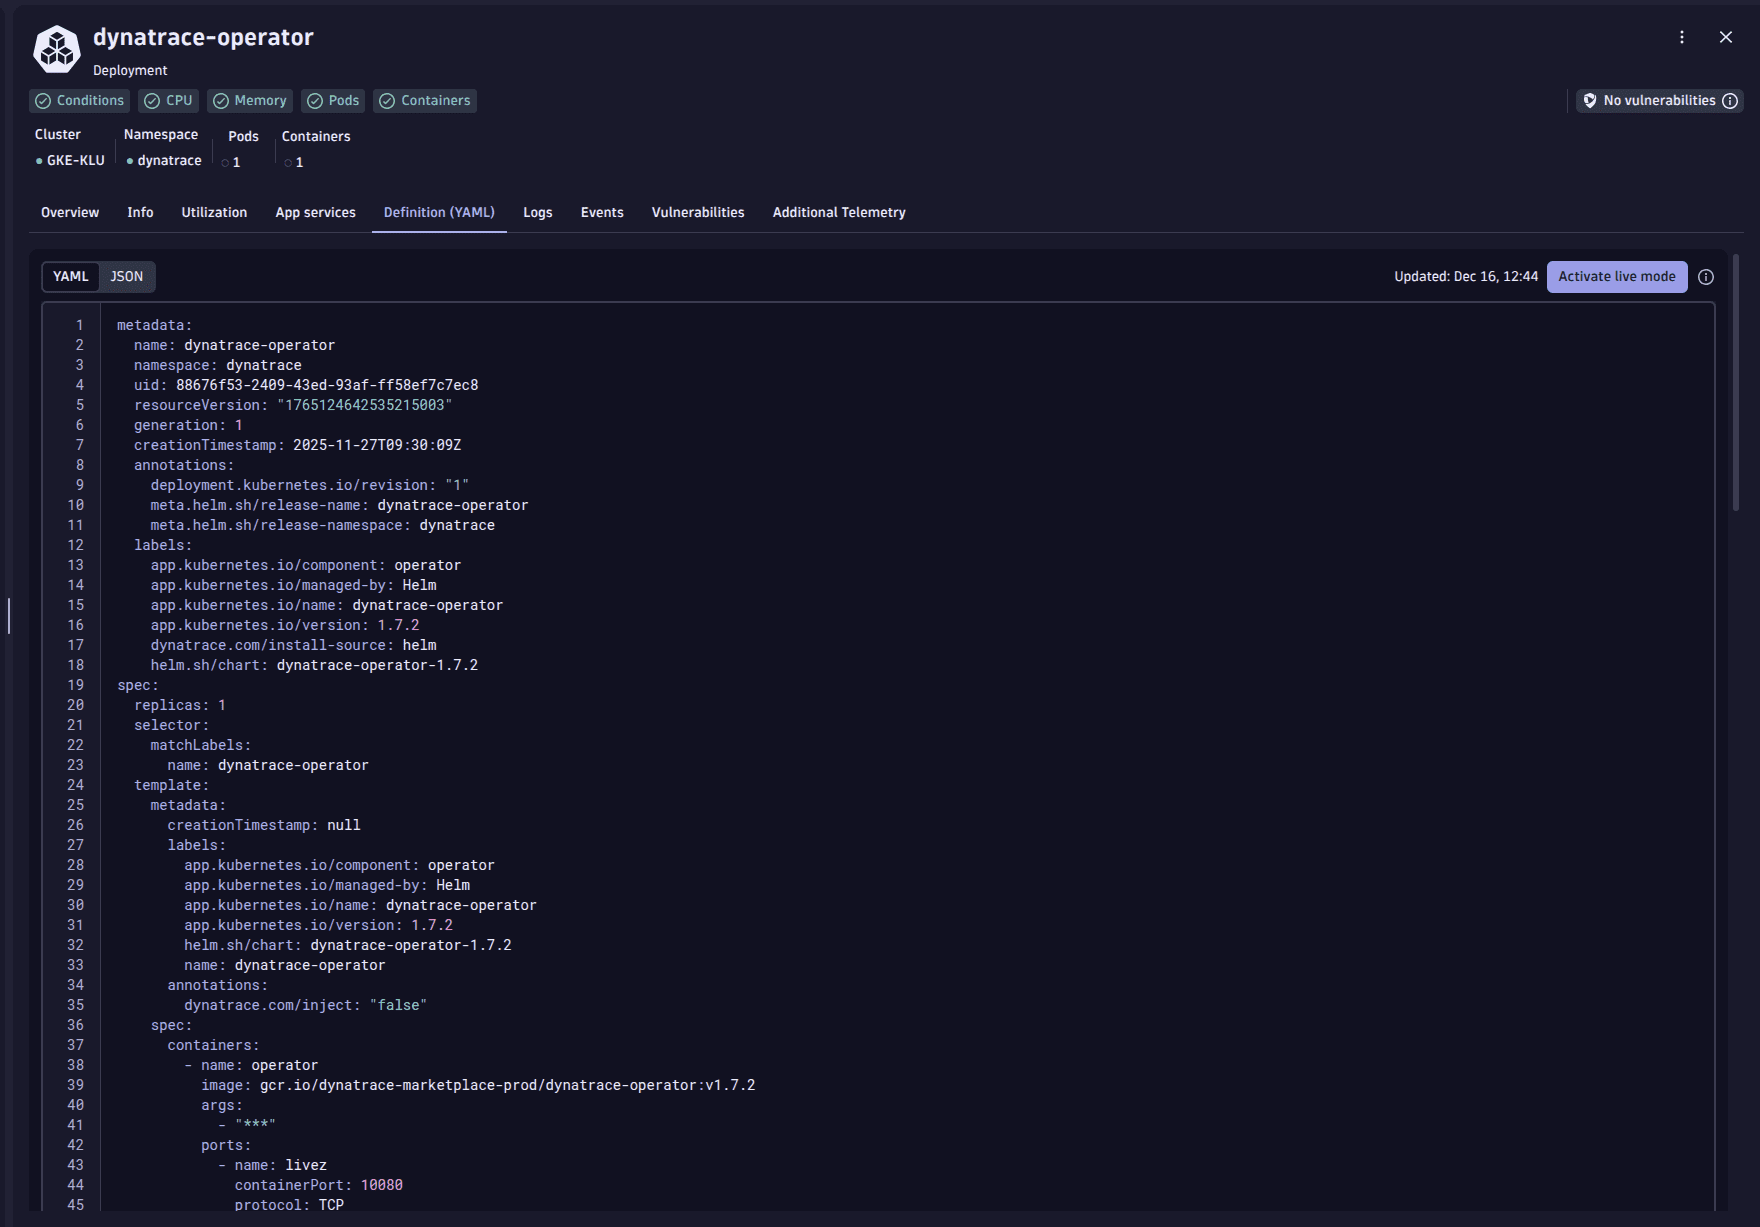
What do I see in the Definition (YAML) view?
ActiveGate version 1.327+
When you first open this view you see a reduced version of the original YAML code as available from the Kubernetes API. When you activate the live mode, you get the full YAML code directly streamed from the Kubernetes API. The reduced version of the YAML code is also available in .json format via DQL in the k8s.object field of the respective Smartscape node.
Labels and annotation are not part of this field, but are stored as tags.
The YAML code is limited to a size of 32 kB. Dynatrace automatically strips less important fields, for example, /metadata/managedFields and kubectl.kubernetes.io/last-applied-configuration annotation.
How can I unlock ConfigMaps and Secrets?
To gain visibility into ConfigMaps and Secrets, you need to grant additional permissions to ActiveGate, allowing it to access these objects. By default, this functionality is disabled because these objects might contain sensitive data. For Secrets, ActiveGate automatically applies data masking.
-
For new clusters, deployed with Dynatrace Operator version 1.8.0+, these permissions are automatically set when checking Monitor potentially sensitive data on the Add cluster page.
-
When opting into this feature for existing clusters, deployed with Dynatrace Operator version 1.8.0+, you need to manually grant these permissions by applying the following YAML with
kubectl.Apply the following YAML with
kubectlto enable these objects:apiVersion: rbac.authorization.k8s.io/v1kind: ClusterRoleBindingmetadata:labels:dynatrace.com/created-by: "dynatrace.kubernetes"name: dynatrace-kubernetes-monitoring-sensitiveroleRef:apiGroup: rbac.authorization.k8s.iokind: ClusterRolename: dynatrace-kubernetes-monitoring-sensitivesubjects:- kind: ServiceAccountname: dynatrace-activegatenamespace: dynatrace---apiVersion: rbac.authorization.k8s.io/v1kind: ClusterRolemetadata:labels:dynatrace.com/created-by: "dynatrace.kubernetes"name: dynatrace-kubernetes-monitoring-sensitiverules:- apiGroups:- ""resources:- configmaps- secretsverbs:- list- watch- get -
For existing cluster, deployed with Dynatrace Operator version 1.7.0 and earlier you need to manually grant these permissions by applying the following YAML with
kubectl.Apply the following YAML with
kubectlto enable these objects:apiVersion: rbac.authorization.k8s.io/v1kind: ClusterRoleBindingmetadata:name: dynatrace-kubernetes-monitoring-sensitiveroleRef:apiGroup: rbac.authorization.k8s.iokind: ClusterRolename: dynatrace-kubernetes-monitoring-sensitivesubjects:- kind: ServiceAccountname: dynatrace-kubernetes-monitoringnamespace: dynatrace---apiVersion: rbac.authorization.k8s.io/v1kind: ClusterRolemetadata:name: dynatrace-kubernetes-monitoring-sensitivelabels:rbac.dynatrace.com/aggregate-to-monitoring: "true"rules:- apiGroups:- ""resources:- configmaps- secretsverbs:- list- watch- get
How can I add permissions to ClusterRoles?
To extend the permissions for Kubernetes monitoring, create a ClusterRole with the required permissions and bind it to the dynatrace-activegate service account using a ClusterRoleBinding:
apiVersion: rbac.authorization.k8s.io/v1kind: ClusterRolemetadata:name: dynatrace-kubernetes-monitoring-customrules:- apiGroups:- example.api.groupresources:- custom-resource-exampleverbs:- list- watch- get---apiVersion: rbac.authorization.k8s.io/v1kind: ClusterRoleBindingmetadata:name: dynatrace-kubernetes-monitoring-customroleRef:apiGroup: rbac.authorization.k8s.iokind: ClusterRolename: dynatrace-kubernetes-monitoring-customsubjects:- kind: ServiceAccountname: dynatrace-activegatenamespace: dynatrace
In Dynatrace Operator version 1.8, permissions were extended using label-based ClusterRole aggregation instead. For details, see ClusterRole aggregation.
Extend monitoring of custom resources (CRs)
Configure custom resource monitoring by setting the ActiveGate property kubernetes_smartscape_monitored_custom_resources in your DynaKube. When ActiveGate is deployed via Dynatrace Operator, define this property in your DynaKube.
Starting with ActiveGate version 1.335+, ActiveGate supports monitoring up to five CRs.
The resource value must be the lowercase plural name of the resource, and kind must match the Kubernetes kind exactly (PascalCase). Optionally, set usePreferredApiVersion for ActiveGate to use the preferred API version (in the preferred version can’t be determined, the version specified in version is used as a fallback).
customProperties:value: |[kubernetes_monitoring]kubernetes_smartscape_monitored_custom_resources = [{ "resource": "databases"\, "kind": "Database"\, "apiGroup": "data.io"\, "version": "v1"\, "namespaced": true\, "usePreferredApiVersion": true }]
How is data masked on the ActiveGate?
No sensitive data is forwarded to the Dynatrace Cluster, as masking happens directly on the ActiveGate side.
The ActiveGate masks:
- Secret values (keys remain visible).
- Environment variable values (names remain visible).
- Container
commandandargsvalues.
Starting with ActiveGate version 1.335, only sensitive values are masked for environment variable values and container command and args values.
Sensitive data is detected based on heuristics, for example, if the name of the environment variable contains password.
Secret values are still fully masked.
Why do I see two Explorer tabs inside the Kubernetes?
Some environments might have two Explorer tabs in Kubernetes. This happens for environments that were created before the transition to Dynatrace's new storage layer, Smartscape on Grail. The second Explorer (Classic) shows clusters that are not yet ready as per the prerequisites. This explorer is in maintenance-only support mode. Upgrade your ActiveGates to see your Kubernetes clusters in the new Explorer.
Once you meet the prerequisites, your Kubernetes clusters are visible in the new Explorer. If all of your clusters are in the new Explorer, a 7-day period starts to ingest enough data to make a comparison between the old and new views efficient. Once that period ends, Explorer (Classic) is automatically removed.
Why do I not see data in the new Explorer tab?
If you don't see (all) data in the new Explorer, verify that you meet requirements and have no issues with permissions or policy boundaries:
- ActiveGate version 1.327+ is required
- Dynatrace Operator version 1.8+ is required
- Required permissions (such as
storage:smartscape:read) are listed in the Hub:davis:analyzers:executeShowing problem detailsdavis-copilot:conversations:executeCalling Davis CoPilot intentsettings:objects:readRead settings (anomaly detectors)settings:objects:writeWrite settings (Ownerships)state:user-app-states:readRead column visibilitystate:user-app-states:writeStore column visibilitystate:app-states:readRead feature flag values from app statestate:app-states:writeWrite feature flag values to app statestate:user-app-states:deleteDelete user app statestorage:buckets:readRead health state via DQL - Policy boundaries could be in place; review your IAM policies