The Container groups overview page allows you to list all the containers in your environment and filter them by the process group, container group, or Kubernetes properties.
Go to Containers to list all container groups in your environment.
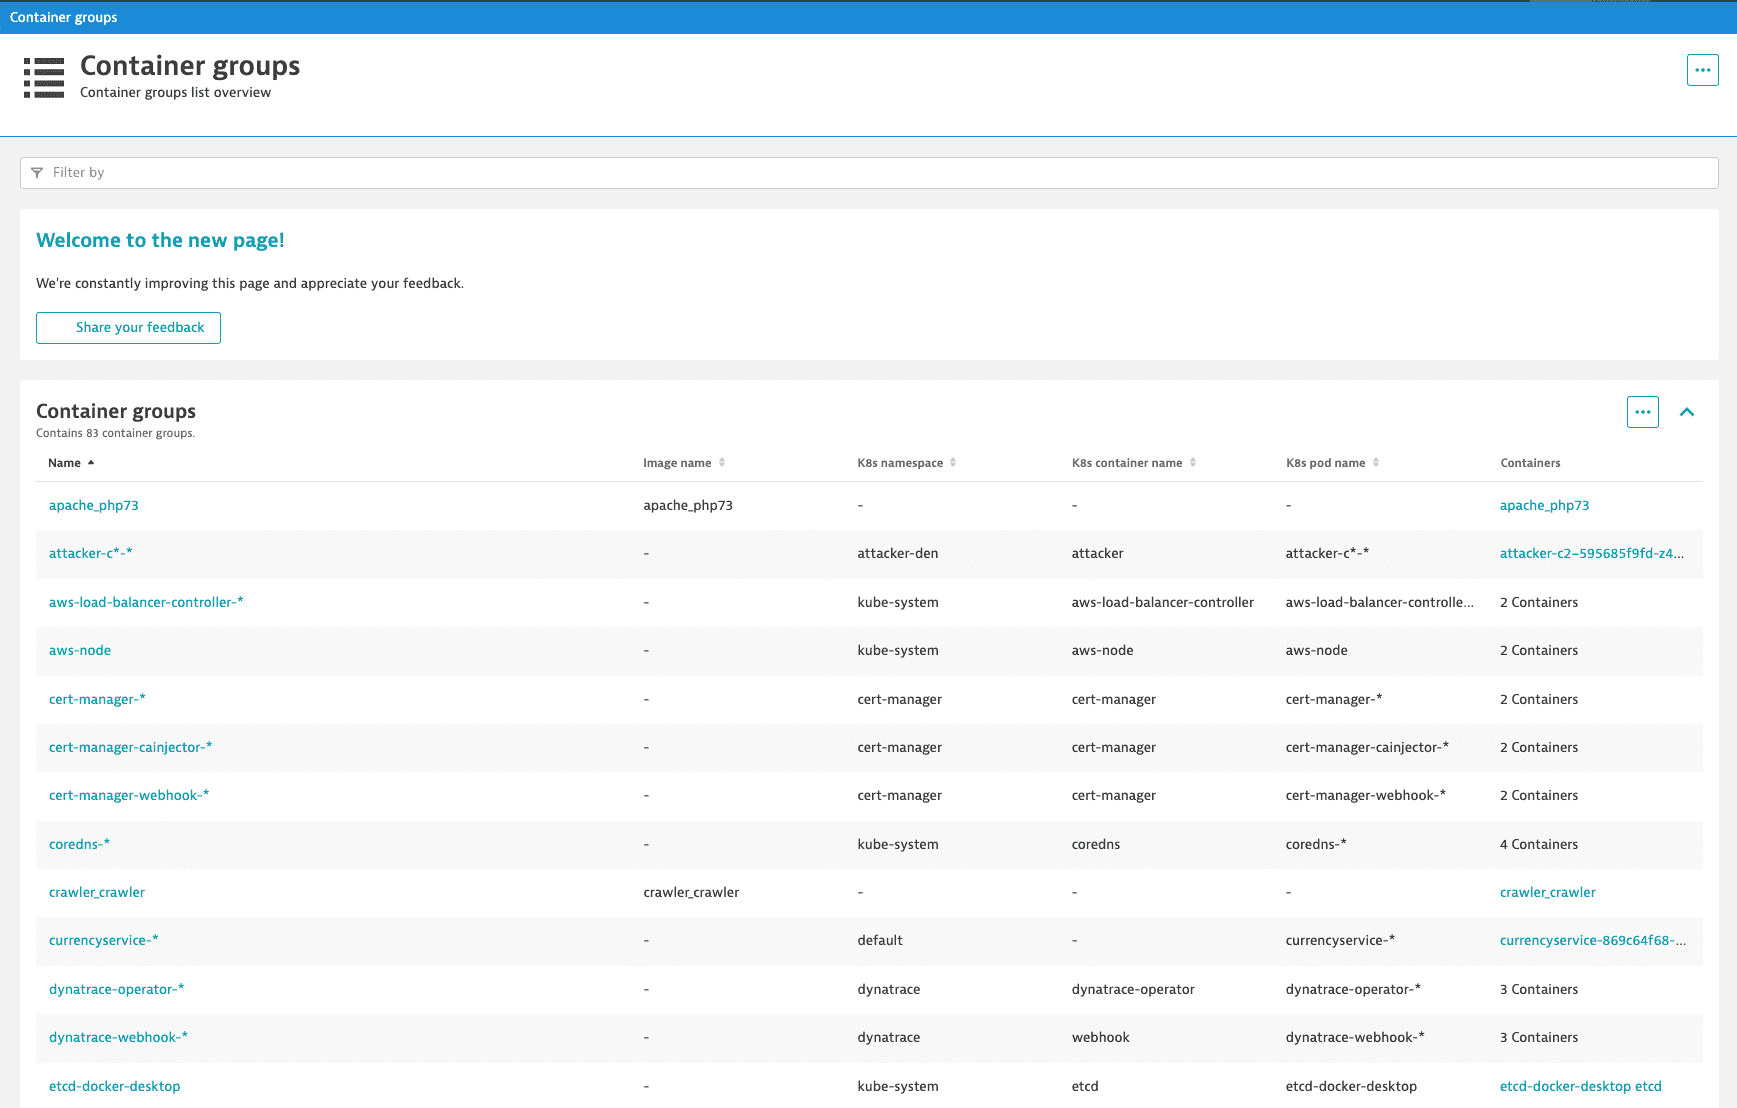
The Container groups table shows the properties of individual container groups. You can filter this table by:
Name: the container group name.
Image name: the image name assigned to the specific Docker container group. Docker containers only
K8s namespace: the Kubernetes namespace to which the containers are assigned. Kubernetes containers only
K8s container name: the name of the Kubernetes container. Kubernetes containers only
K8s pod name: the full name of the Kubernetes pod to which the container belongs. Kubernetes containers only
Select a container group from the table to go to the container group overview page.
Container analysis
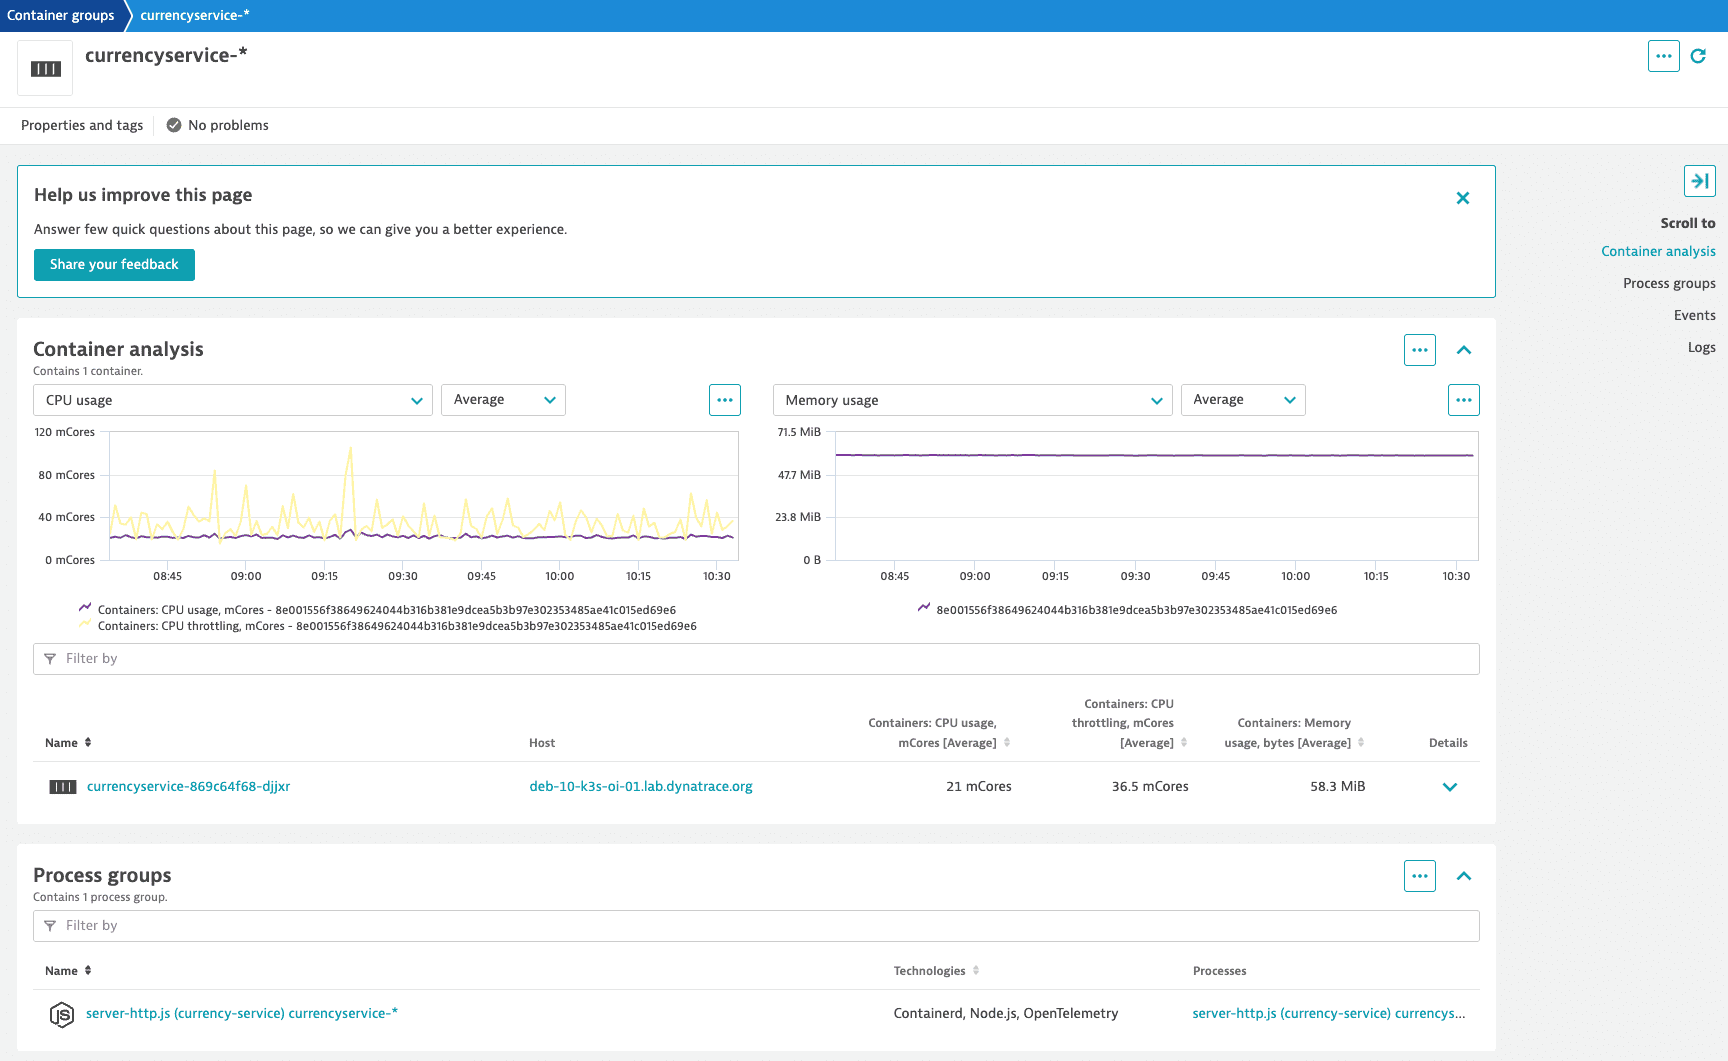
To get a better understanding of container behavior, go to the Container analysis section. You’ll see all the containers assigned to the selected container group.
Provided metrics include:
CPU usage, mCores: CPU usage per container in millicores.
CPU throttling, mCores: CPU throttling per container in millicores.
Memory usage, bytes: resident set size (Linux) or private working set size (Windows) per container in bytes.
Select the container to access the container overview page, where you can view the details and available metrics for the selected container.
Select in the upper-right corner of a chart to:
Show in Data Explorer—Opens Data Explorer for the associated query, so you can view the associated query, explore the data more in-depth, adjust the chart settings, and pin the chart to your own dashboard.
Create metric event—Opens the Metric events for the selected metric.
Pin to dashboard—Pins a copy of the selected chart to any classic dashboard you can edit. For example, if certain hosts are particularly important to your business, create a dashboard designated to monitoring only those hosts, and then pin charts from their host overview pages to that dashboard, all with almost no typing. For details, see Pin tiles to your dashboard.
Process groups
The Process groups section shows all process groups for the selected container group. Select a process group from the table to go to the dedicated overview page. For more information, see Overview of all technologies running in your environment.
Events
The Events tile charts the distribution of events, such as service deployments, process crash details, and memory dumps. Expand the tile to list events.
Logs
The log viewer timeline is interactive, allowing a global timeline selection. Use it to identify issues around a specific log event and see how it relates to the container performance.
Select in the upper-right corner of a chart to:
Go to Log Viewer—Opens the Log Viewer page filtered by the selected container group.
Create metric—Opens the Log metrics page with the Query value set to the selected container group.
Docker limitations
There are performance limitations related to the number of running containers. The total number of containers that can be monitored in parallel isn't strictly defined though; this depends on the type of monitored applications and host resources.
Docker containers on Linux can run in any of the following network modes: Host, Bridge, Container, Overlay, None, Macvlan. The default network mode is Bridge. From the available network modes, OneAgent is capable of reporting topology and network metrics for containers running in network modes: Host, Bridge, and Container. Topology for other network modes isn't reported. However, OneAgent is able to detect and report other network modes (with the exception of Macvlan).
The Container mode will only work if the linked network is also in one of the supported modes. The final referenced container must be in Bridge or Host mode. If the final referenced container is in one of the unsupported network modes (None, Overlay, Macvlan), the topology will not be reported.
Non-standard Docker binary file locations aren't supported on Linux.
Container monitoring isn't supported when OneAgent is deployed on Linux in non-privileged mode (in absence of ambient capabilities and with the DISABLE_ROOT_FALLBACK flag enabled).
Only UNIX sockets and unencrypted TCP connections are supported when accessing the Docker API. Encrypted TLS connections aren't supported at this time. Ensure that your Daemon Socket Options don't include the --tlsverify parameter.
If the Docker socket file isn't owned by the docker group, then OneAgent in non-root mode won't be able to read from the Docker API. For such deployments, Docker metrics won't be reported on the Docker overview page.
As Openshift doesn't allow OneAgent in non-root mode to access the Docker API, there are no metrics for Openshift containers on the Docker page. Use the Kubernetes overview page instead. See Monitor Kubernetes workloads and cloud applications for more information.
If Docker API metrics are still required, set OneAgent to root mode.
OneAgent version 1.145+
If you customize your OneAgent installation path, we support OneAgent installation only in a directory on drive C. Note that we don't support OneAgent installation in the root of drive C.
For containers deployed on hosts running the Windows operating system, we support only Windows Server Containers. Hyper-V containers aren't supported.
Docker service needs to be restarted for OneAgent to be able to properly monitor the containers on Windows.
The restart is required only during the initial OneAgent installation, it's not required with subsequent OneAgent updates.
Containers inside Windows Server Container can run in one of the following network modes: NAT, Transparent, Overlay, L2Bridge, L2Tunnel. The default network mode is NAT.
From the available network modes, OneAgent is capable of reporting topology for containers that run in NAT network mode. OneAgent is able to detect and report other network modes, but doesn't report their topologies.
For containers deployed on Windows, the network module of OneAgent needs to be running for OneAgent to properly report topology.
OneAgent isn't able to report on an inter-docker connection if the containers use only the internal container's addresses (if the connection doesn't go through NAT vNIC).
Network statistics are reported for the main process detected inside containers hosted on Windows. This might lead to measurement inaccuracies when there are more processes performing network operations inside a monitored container.
Dynatrace supports monitoring Docker when it is installed in its default location. Specifically, the Docker root directory must be set to C:\ProgramData\docker. If Docker is installed in a non-default location, you can establish a hard link using the command mklink /H to link the custom installation directory to the default C:\ProgramData\docker directory.
Dynatrace supports only the default Docker API endpoint path.
The monitoring of Windows Containers is only possible if OneAgent was installed directly on Windows. We currently don't support installing OneAgent through a container on Windows machines.
We assume there's one application per container. For containers with more than one application running inside (for example, Apache and MySQL in one container), we report the same listen ports for both applications (process groups). Network traffic either is assigned to one of the process groups or it's divided between the process groups.