Lens
- Latest Dynatrace
- 5-min read
The Lens feature of Account Management provides you with insights into platform adoption and health, helping you to understand how Dynatrace is used within your organization and recommend areas for optimization.
Lens has two main pages: Adoption and Environments.
Adoption
The Lens > Adoption page gives you insight into platform adoption and health:
- User activity
- Which technologies are being monitored across Dynatrace
- How monitored hosts are deployed (license type, platform type)
- How many synthetic tests are running
- How many problem notification integrations are defined
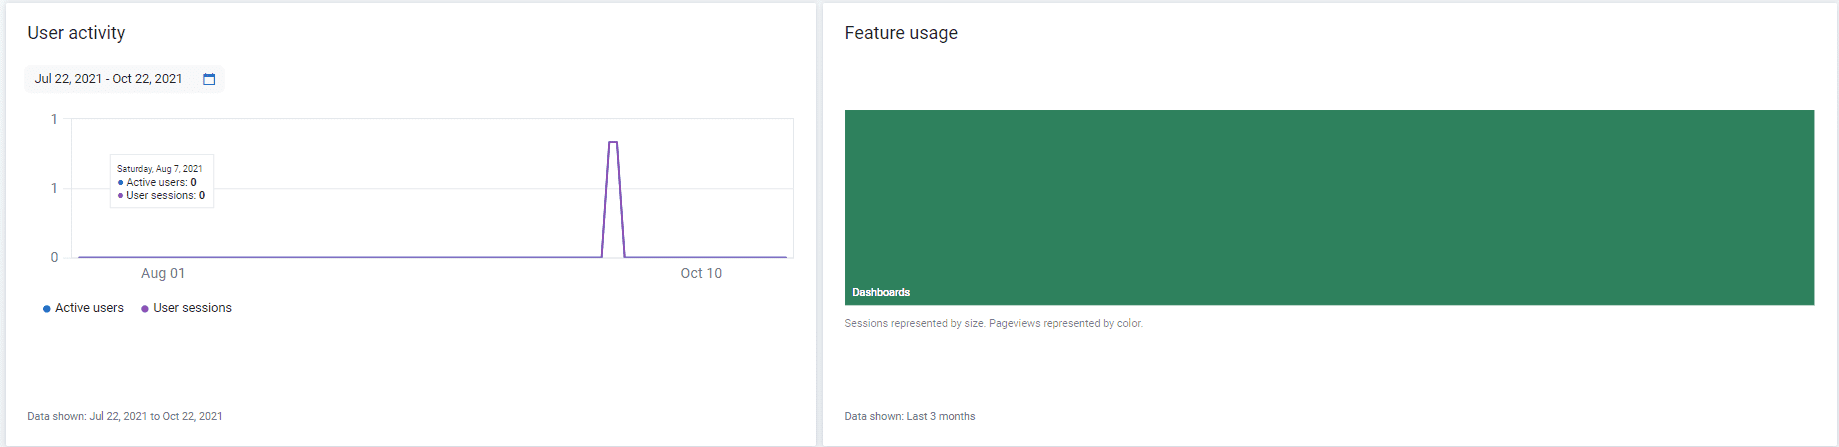
User activity and Feature usage
The User activity chart shows how many users are accessing Dynatrace over time and how many sessions are opened.
The Feature usage chart helps you to understand the top features used in Dynatrace.
- The larger the feature area is on the chart, the more times the feature is used when someone accesses Dynatrace (sessions)
- The darker the feature area is on the chart, the more page views the feature has (regardless of session count)
For instance, a user that logs into Dynatrace and navigates to  Dashboards Classic 10 times is counted as 1 session and 10 page views.
Data for these charts is powered by the automated self-management capabilities of Dynatrace. This includes collecting real-user monitoring (powered by Dynatrace) from your Dynatrace platform.
- For Dynatrace SaaS customers, this is done automatically
- For Dynatrace Managed customers, Dynatrace requires pro-active support to be enabled.
- If no data is shown, please contact a Dynatrace product expert via live chat to help you check your self-monitoring configuration.
- To learn more about Dynatrace self-monitoring for Dynatrace Managed customers, see the Pro-active support section of Managed - managed-data-exchange.
Environments
Lens > Environments offers:
- An overview of how many technologies are detected and monitored by Dynatrace over time.
- A host-centric summary of the environments in your Dynatrace deployment.
- A summary of how many monitored hosts are deployed across the cloud.
- A summary of how many public and private synthetic tests have been running across your environments.
- A high-level summary of how many API tokens are defined, how many problem notification integrations are defined, how many PaaS integrations are in use, and how many session exports are defined.
Environments
An overview of how many technologies are detected and monitored by Dynatrace over time.
Host monitoring details
Provides a host-centric summary of the environments in your Dynatrace deployment, with the number of monitored hosts broken down by host operating systems, monitoring mode, and cloud deployment. Data is based on the total number of hosts seen in the previous 24 hours. In highly elastic environments where many hosts are started and stopped during the day, this number may be higher than expected.
Cloud and virtualization details
A summary of how many monitored hosts are deployed across the cloud.
Synthetic tests
A summarized view of how many public and private synthetic tests have been running across your environments. The default period is 3 months; you can adjust this in the tile.
Inbound/outbound data integrations
A high-level summary of how many API tokens are defined, how many problem notification integrations are defined, how many PaaS integrations are in use, and how many session exports are defined.
- API tokens: Dynatrace provides powerful APIs that allow you to integrate Dynatrace within your lifecycle processes and extract information from Dynatrace. A total of
0tokens indicates that your organization is not leveraging these APIs. - Problem notifications: Problem notifications help you determine if Dynatrace is integrated with any of your internal systems for problem notifications. If the tile indicates
0problem notifications, and your organization uses a helpdesk system (like ServiceNow) or paging system (like PagerDuty) when critical alerts are found, then you may be missing an opportunity to integrate Dynatrace with your organizational processes. - PaaS tokens: PaaS tokens provide a quick indication of whether Dynatrace is configured with any of your PaaS environments (e.g. Microsoft Azure, Cloud Foundry, IBM Bluemix).
- Session Export: Session Export indicates whether any of your environments are configured to stream real user monitoring data from Dynatrace to an external data source where it can be leveraged as input for big data analytics, or for extending data retention.