What's new in Dynatrace SaaS 1.344
- Release notes
- 15-min read
- Rollout start on Jul 29, 2026
This page showcases new features, changes, and bug fixes in Dynatrace SaaS version 1.344. It contains:
Application Observability | Distributed Tracing
Explore related frontend user events and sessions directly in  Distributed Tracing
Drill down from Distributed Tracing spans into the related frontend User Events and User Sessions to get frontend context directly in your trace analysis workflow. Spans with frontend links show User Event and Session details in the span panel and provide one‑click navigation to  Users & Sessions,
  Experience Vitals, and
  Error Inspector.
This allows faster end‑to‑end root‑cause analysis and effectively closes the loop, covering frontend-to-backend and backend-to-frontend analysis directly in the span details panel. No app switch is required to get the full picture.
These drilldowns are ingest-agnostic and cover spans from both OneAgent and OpenTelemetry.
Feature updates
Account Management | Cost Management
Improved DPS forecast and cost events
Cost monitors now deliver richer cost insights. The improved calculation model logic is reflected in forecasted value adjustments when the update takes effect.
Most values will experience no significant changes; deviations are possible, though rare, and are based on your actual DPS consumption data. If a deviation occurs, you'll receive a notification email. After the adjustment, forecasts are stable and consistent.
Account Management | Cost Management
Extended details on the usage origin for DPS query consumption
There are new fields for logs, metrics, traces, and event queries to help you better identify where the query was triggered.
Account Management | Identity Access Management
Users now have default permissions to write comments in Problems app
The out-of-the-box IAM policies Standard User, Pro User, and Admin User now come with permission to write comments in  Problems.
AI Observability | AI Observability
Prompt evaluations are shown in the new AI Observability Evaluations page
In  AI Observability, prompt evaluations are shown in the new Evaluations screen.
Application Observability | Distributed Tracing
Quickly access sample traces in current app's context
You can now view trace waterfalls without leaving your current app context. This is possible in the Services, Failure Analysis, Response Time Analysis, and Logs tabs across Dynatrace. When you hover over the trace, a dedicated icon identifies what happens when you open the trace: indicates that the waterfall will open as an overlay within your current view; indicates that the trace will open in Distributed Tracing.
What's new:
- Sample Traces tab: Visible in Failure Analysis, Response Time Analysis, and Services, a set of traces matching your active filters, sorted newest-to-oldest. Select any row to open the waterfall.
- Show example traces from charts: The value context menu on time-series chart data points now includes a Show example traces action that derives filters (error state, duration percentile) from the selected point automatically.
- In-modal navigation: Use and to move between traces in the list without closing the overlay.
- View in Distributed Tracing: Escalate with the same filter context for further investigation.
Application Observability | Distributed Tracing
Support for complex OpenTelemetry data types
You can now enrich your OpenTelemetry spans with heterogeneous arrays and complex records via the OTLP ingest API.
Application Observability | Open Telemetry
OTLP trace ingest supports complex attributes
Dynatrace now preserves complex attribute values on ingested OTLP spans.
- Nested key-value list attributes (maps) are now supported, keeping their structure intact.
- Array attribute values are now ingested and retained on spans.
Application Observability | Services
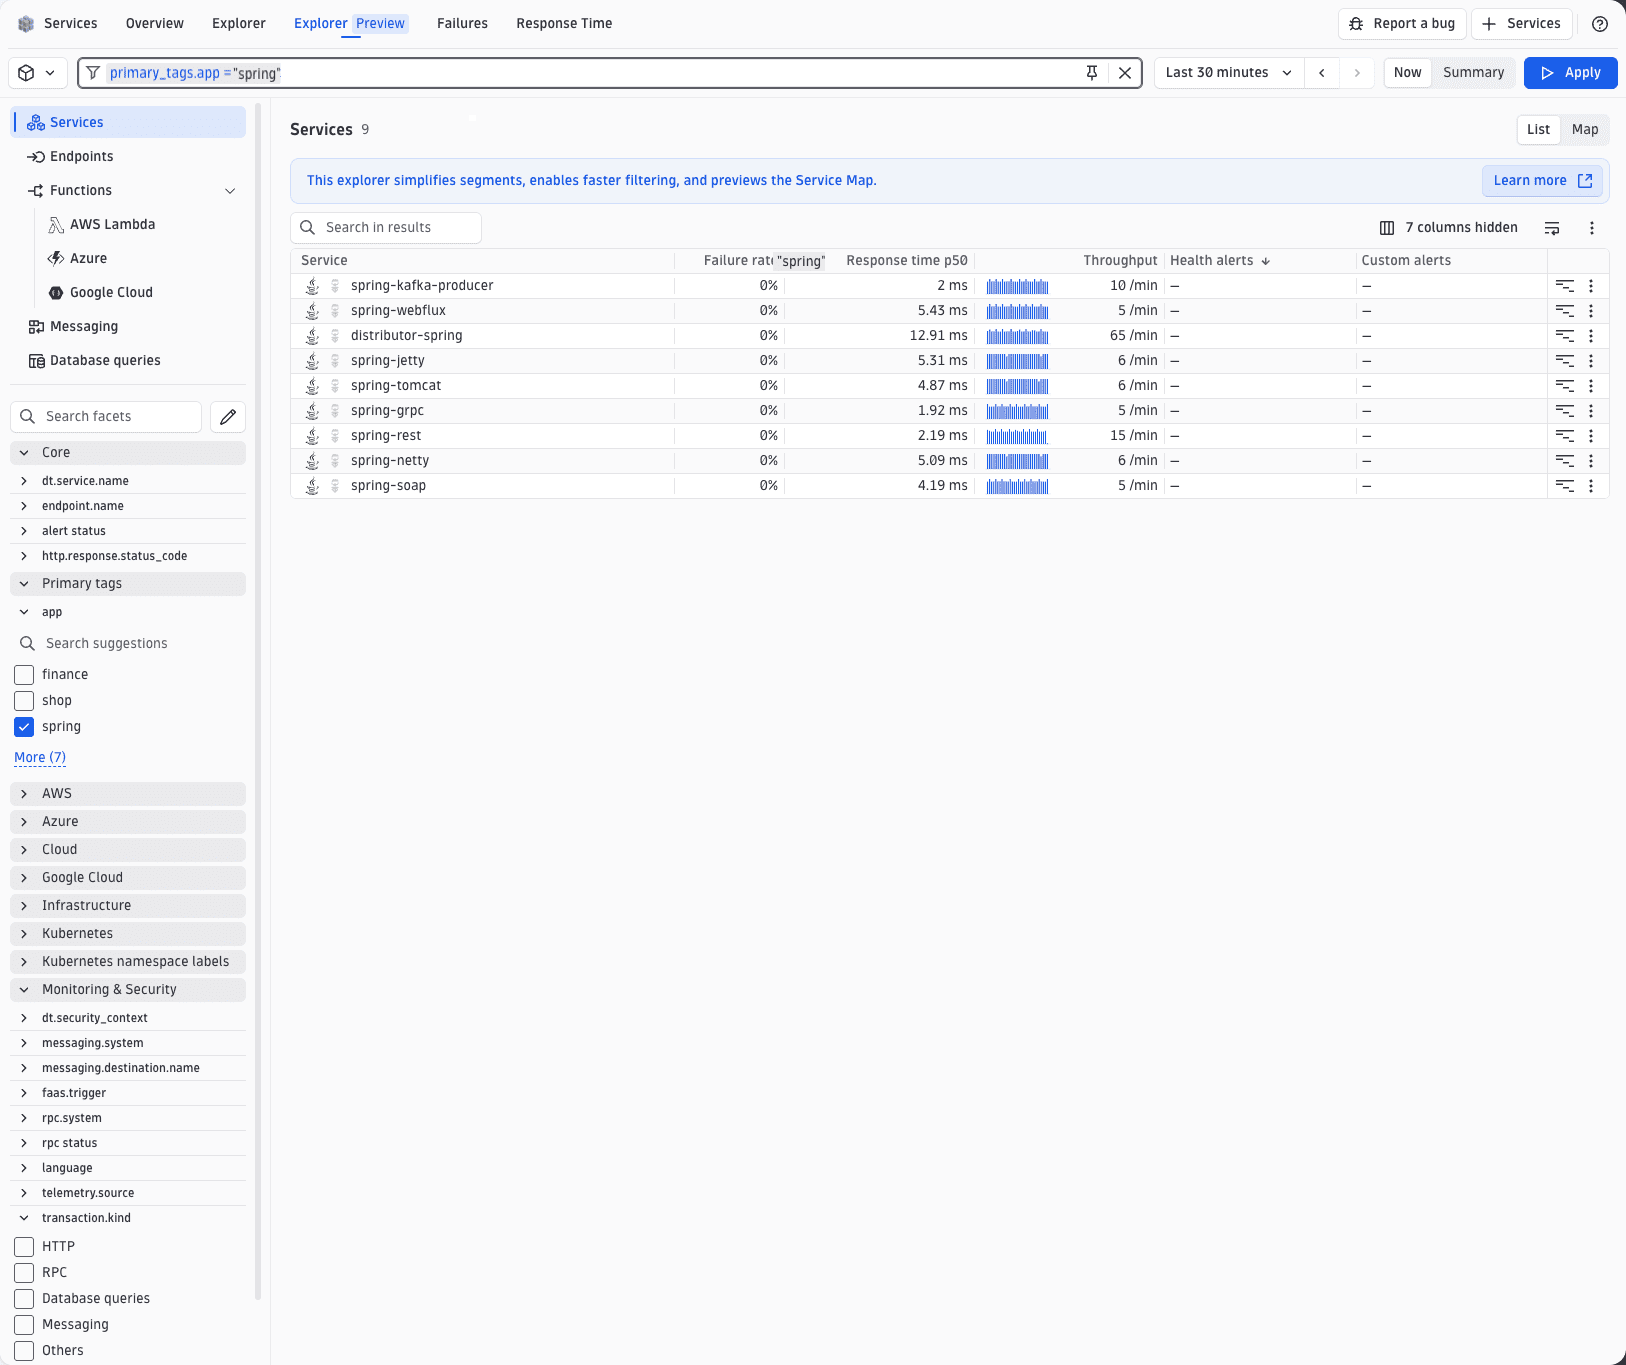
Improved filtering in the new Explorer view
Finding the services you care about in the new Explorer (Early Access) view for  Services just got easier, as you can filter by what a service does, not by its identifiers. Two new filters let you navigate even large inventories in seconds. Both are derived automatically from the telemetry Dynatrace already collects, so there is nothing to tag or configure.
- Transaction kind: HTTP, RPC, Messaging, or Database queries.
- Technology: NGINX, Apache, IIS, IBM MQ, IBM CICS, and more.
Application Observability | Services
Filter services by deployment context and your own tags
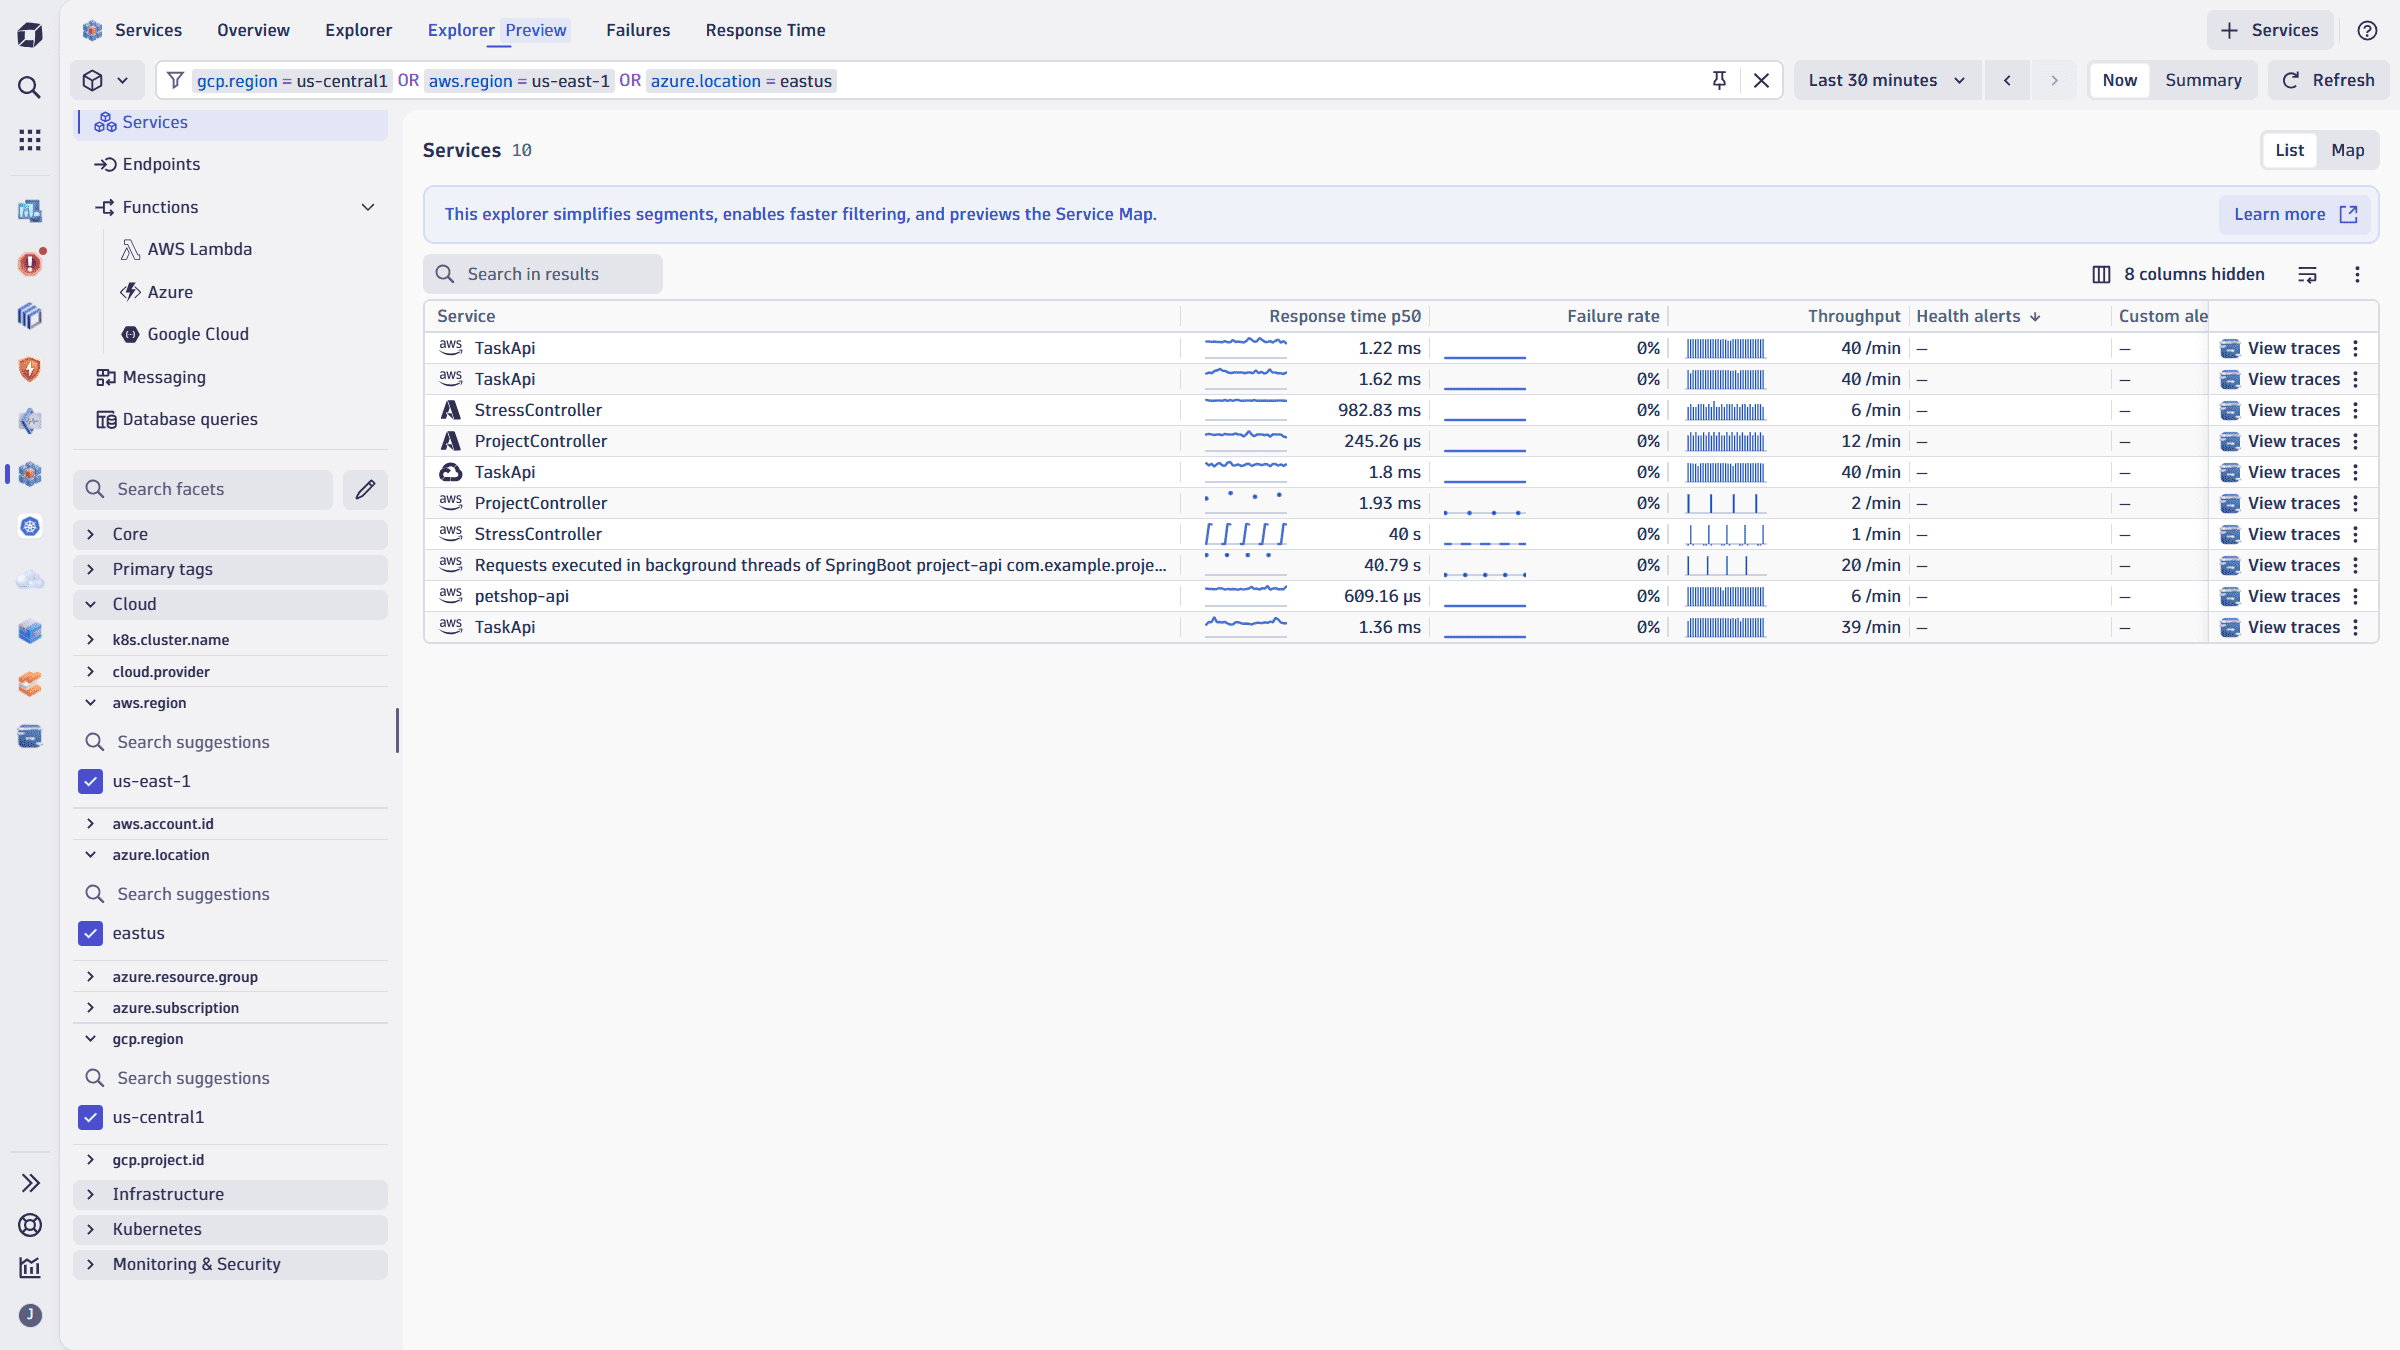
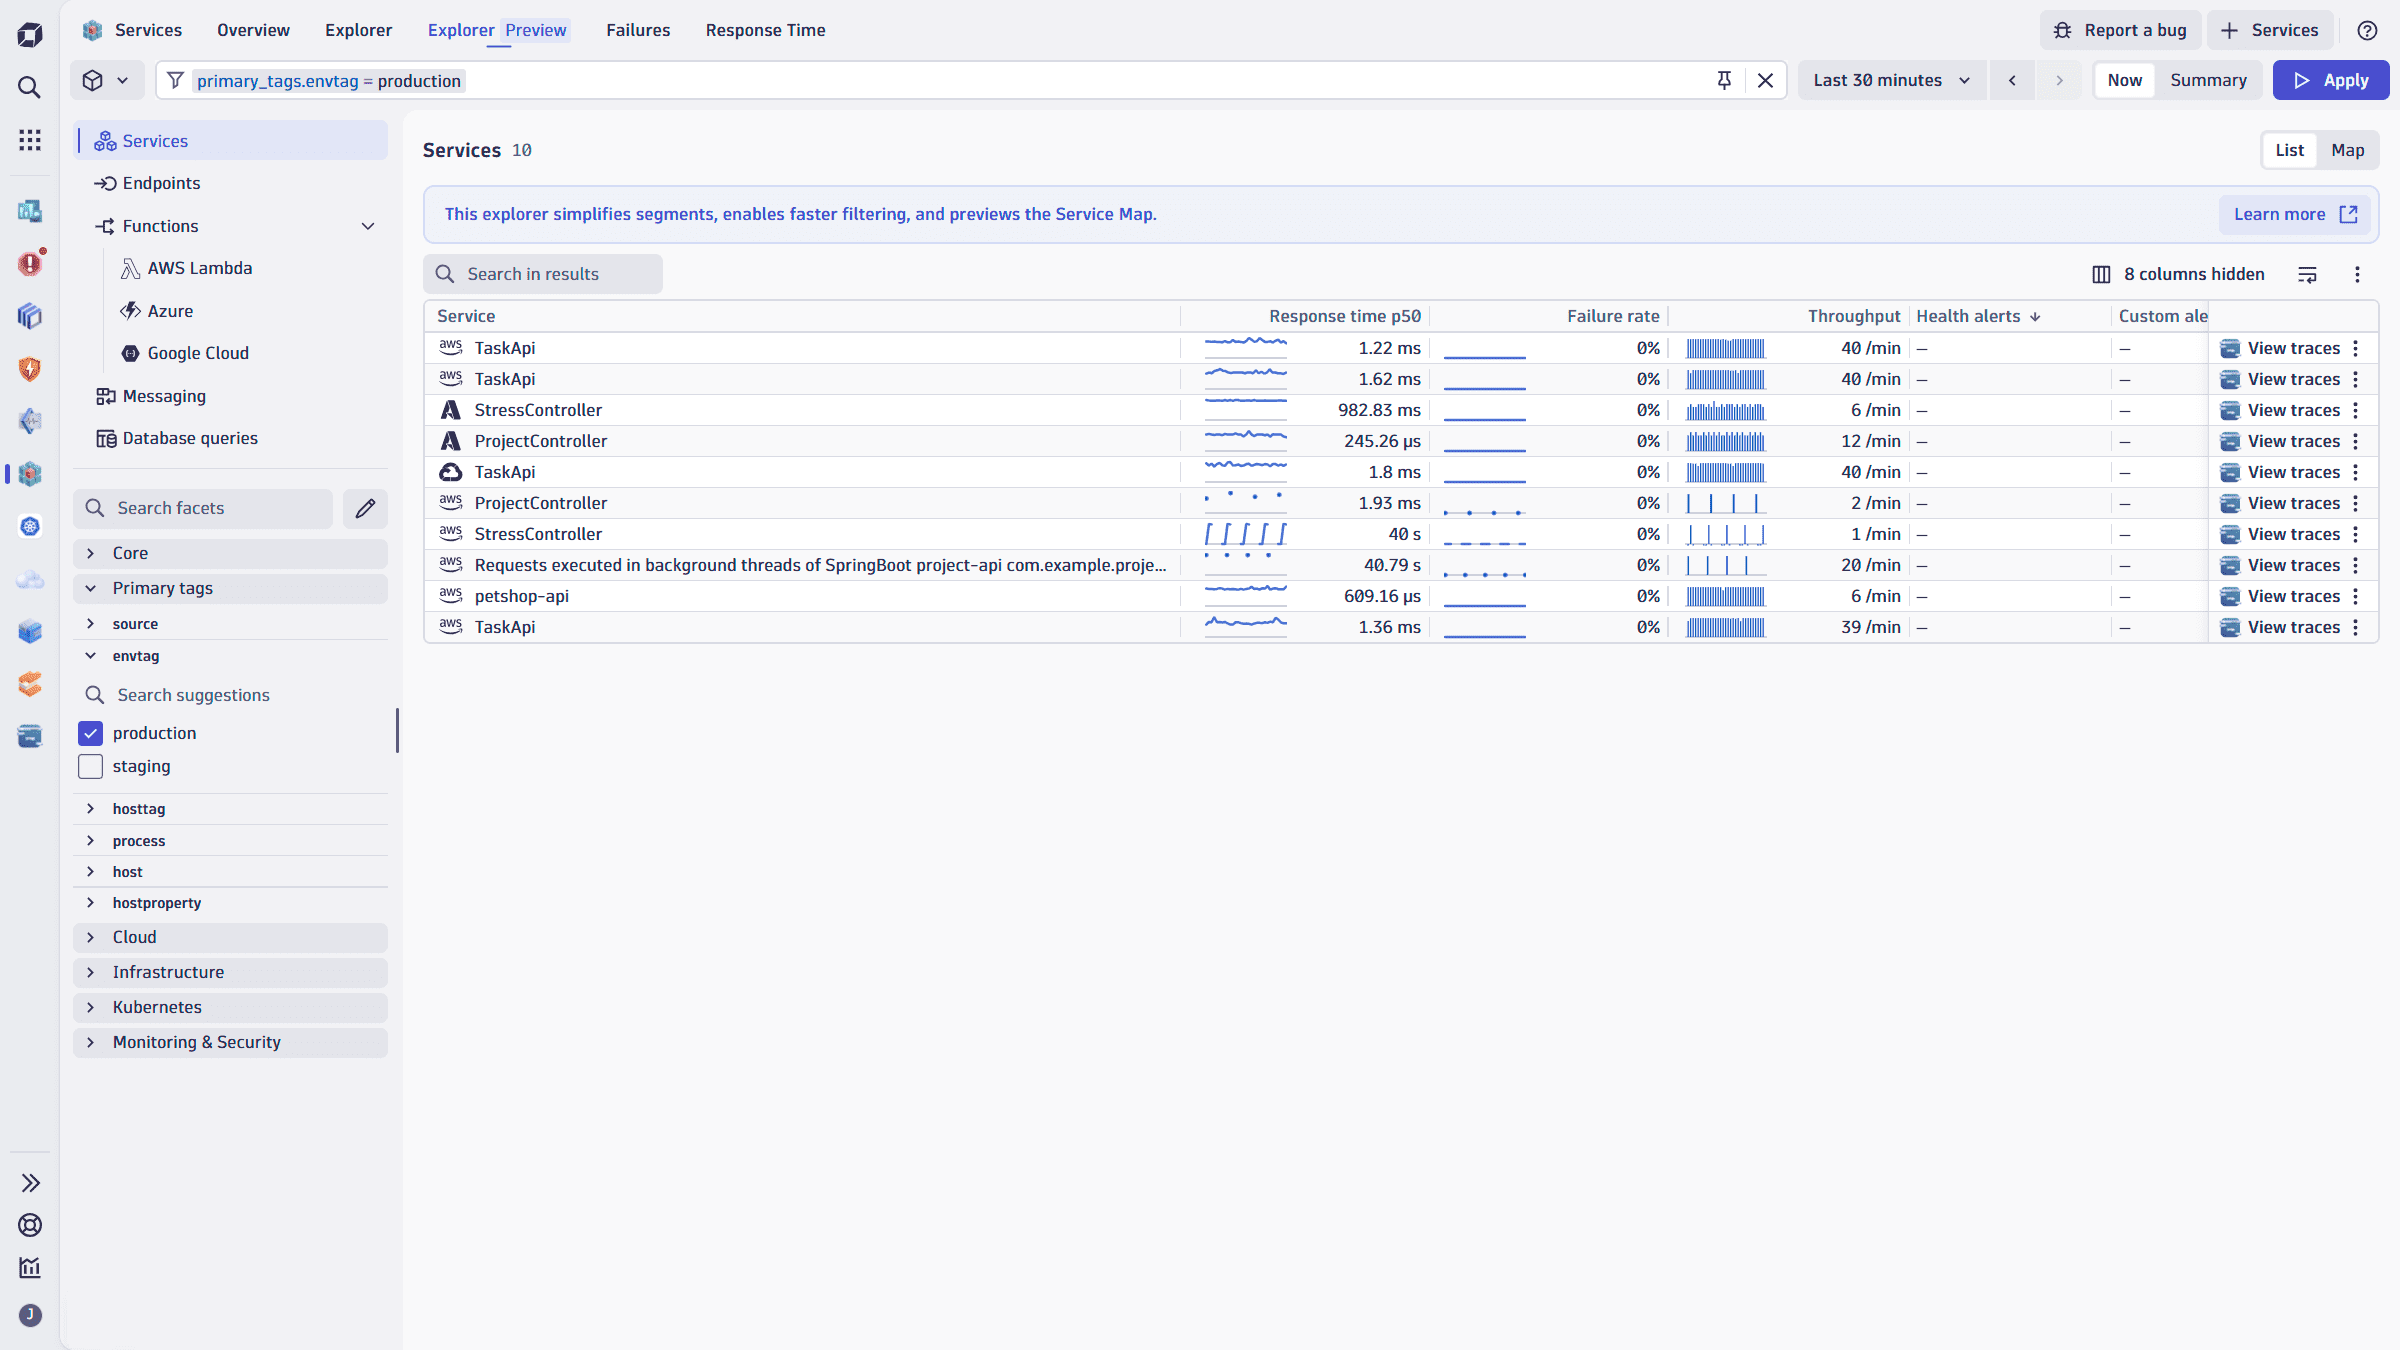
The new Explorer (Early Access) view in Services now filters and segments by primary Grail fields and primary Grail tags.
Primary Grail fields like Kubernetes namespaces, clusters, and cloud accounts let you narrow down to exactly the services that matter for a given context, fast and across any timeframe.
Primary Grail tags bring your domain perspective in. In other words, they allow filtering by team ownership, organizational boundaries, or any dimension you've defined to surface what's relevant to you and your team.
Because filters and segments behave consistently across all perspectives in Services, segments you've defined anywhere in Dynatrace work here too. This provides you with a focused view, no matter which angle you're working from.
Application Observability | Services
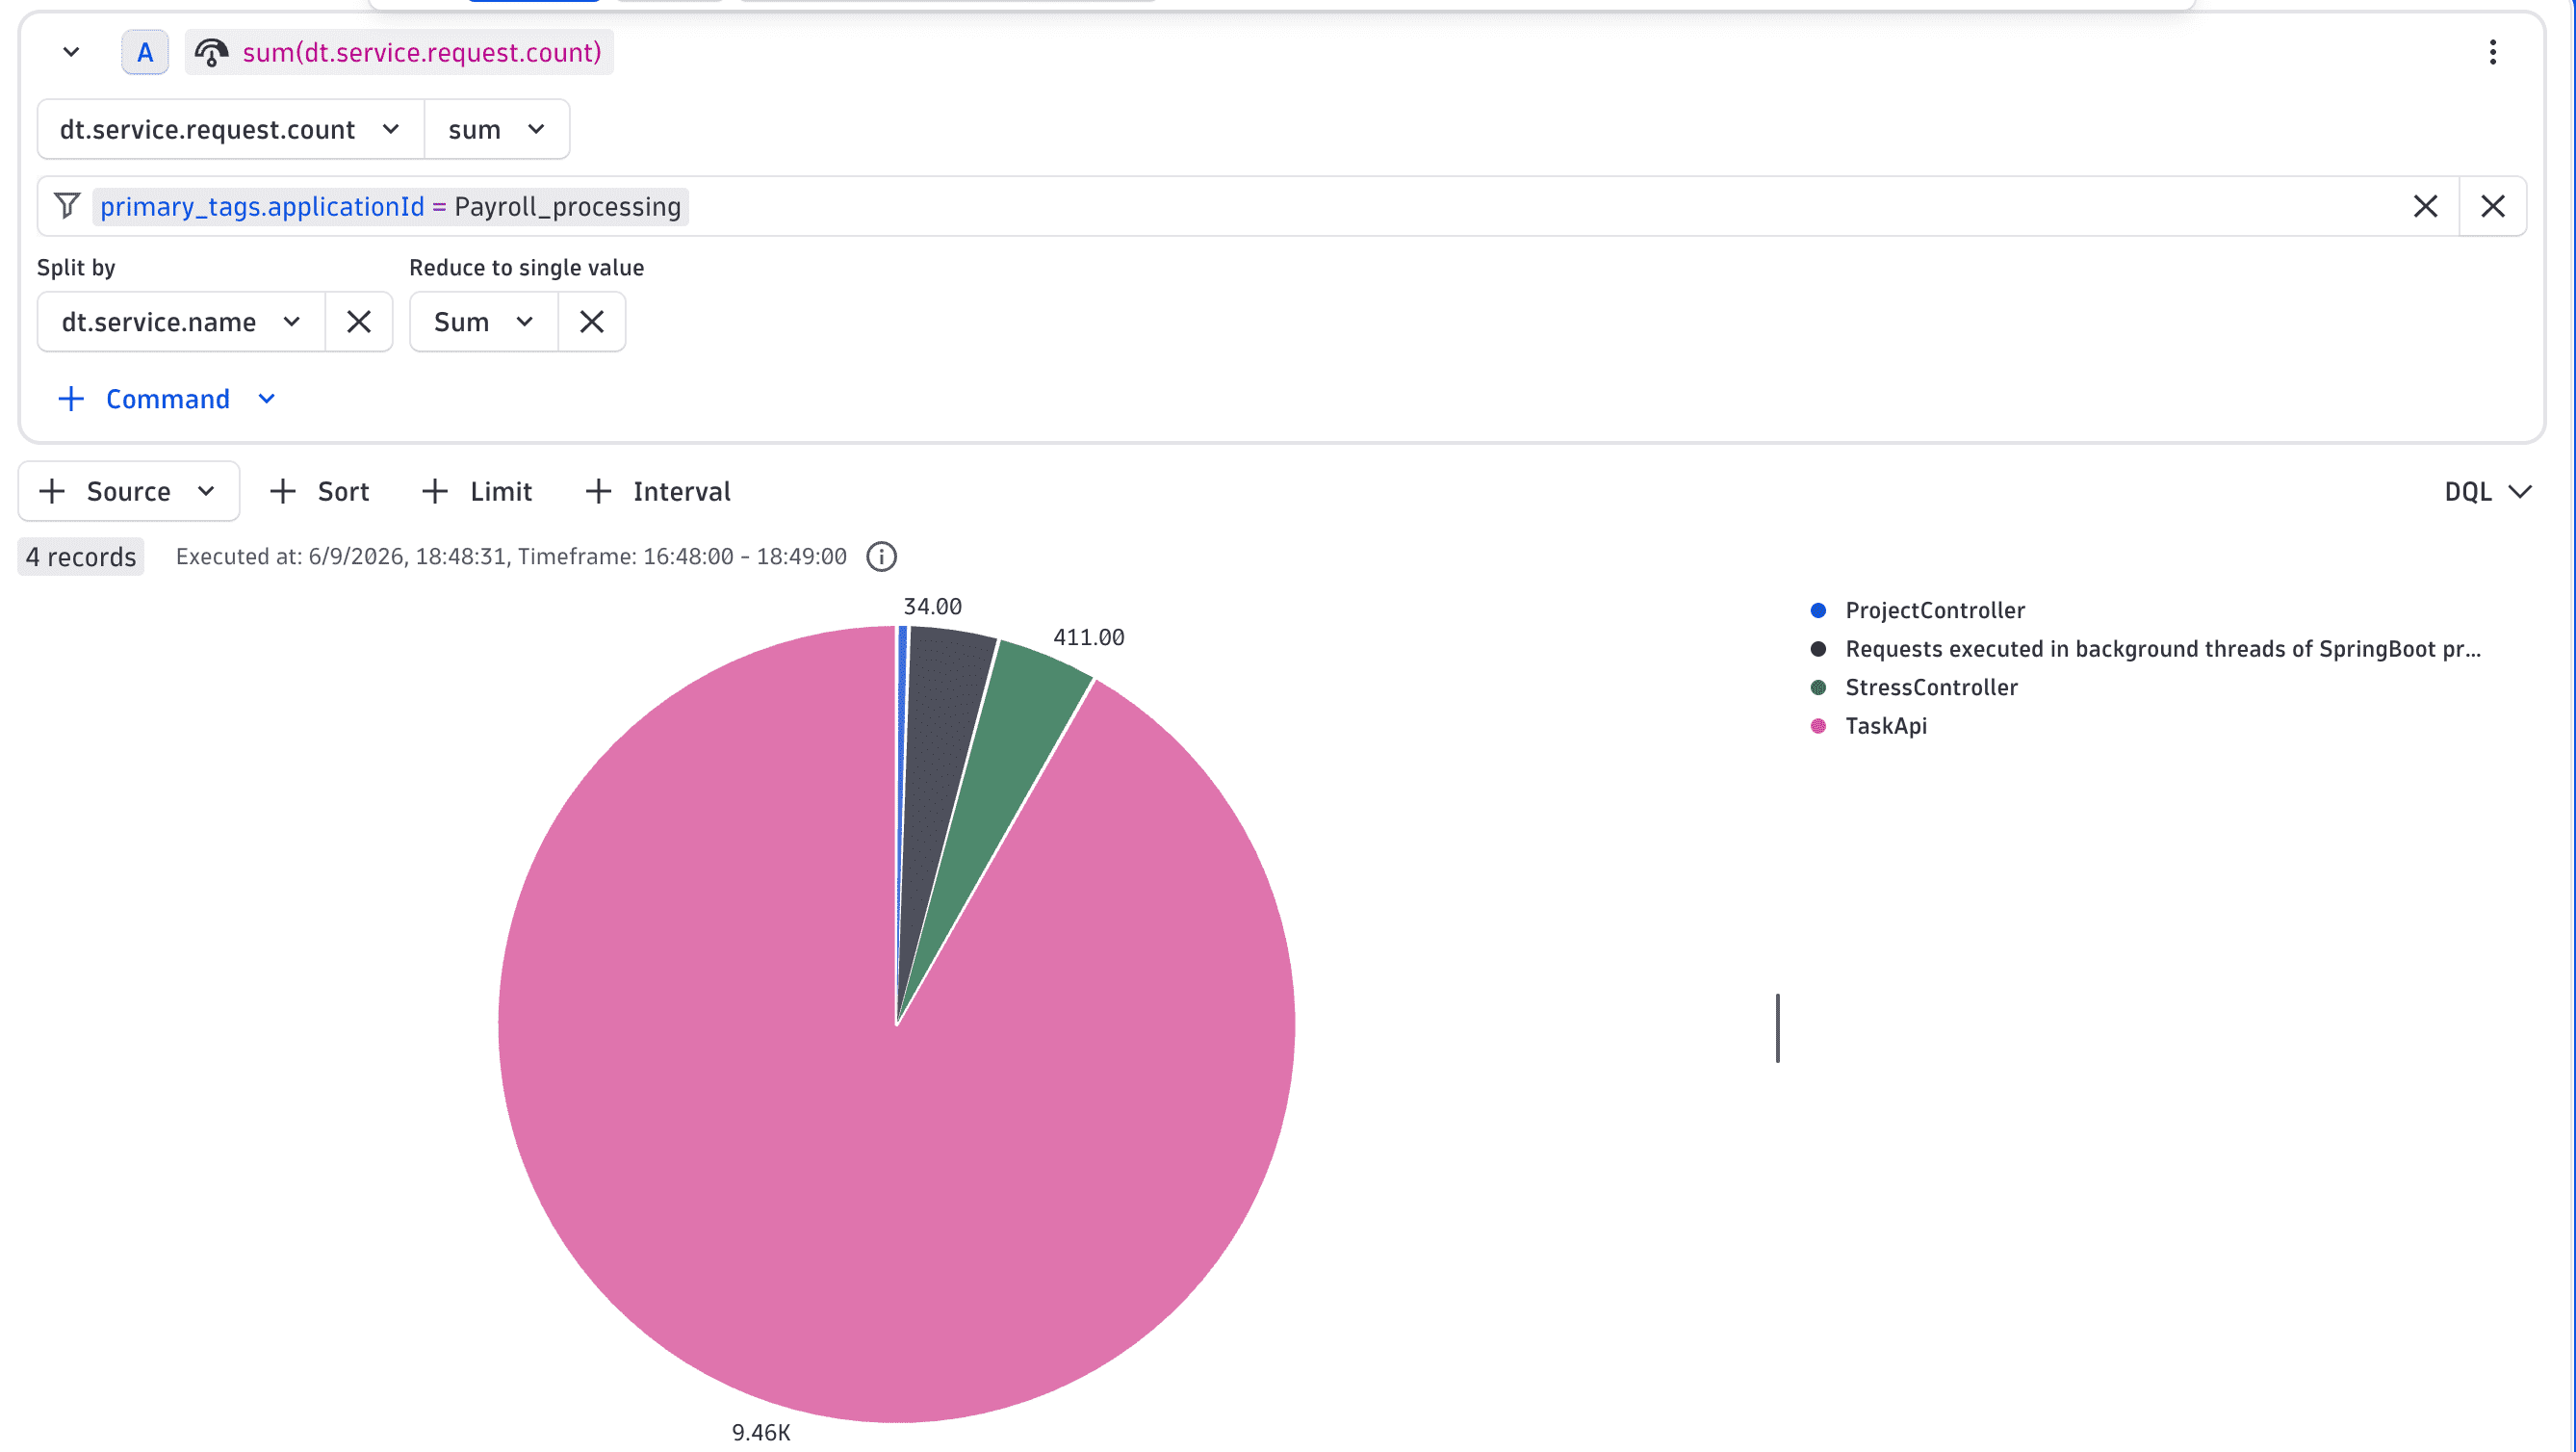
Primary Grail fields and tags are automatically available on all service metrics and span-derived metrics
All service metrics and all metrics extracted from spans in OpenPipeline now include the primary Grail fields and primary Grail tags as metric dimensions. Additionally, an alert configured on these metrics generates an anomaly event that includes those fields.
Now you can:
- Build dashboards using Dynatrace built-in metrics and filter them by deployment level and primary fields, such as Kubernetes namespace.
- Use your own primary Grail tags to filter dashboards and notebooks, and leverage them in workflows as well.
- Use them in all list views of Services.
- Use the primary tag to route an alert to the right team.
Application Observability | Services
New Explorer view is available as opt-in
As of August 3, the default Explorer view in Services rolled back to the previous Explorer view.
The new Explorer (Early Access) view is available as an opt-in experience. You can switch to it directly in Services on a per-user basis, at your own pace. The new Explorer (Early Access) view is production-ready and actively developed. Opting in gives you access to capabilities exclusively built into the new experience:
- Service Map: Visualize how services connect across your environment.
- Endpoints view: Investigate slow or failing requests at the endpoint level.
- Primary Grail tags and fields: Leverage for native filtering and list views.
For details, see New Explorer view.
Application Observability | Services
OpenTelemetry services are now linked to OTel hosts and processes in Smartscape
Smartscape now draws topology edges from your OpenTelemetry-instrumented services to the hosts and processes that they run on. This is done automatically, based on span context, and lets you trace service issues down to infrastructure in one click without leaving the topology.
To use this new functionality, update your OpenTelemetry Host Monitoring extension to version 3.1.1. Edges for services monitored through the extension's spans pipeline with then appear automatically, with no additional setup required.
Application Security | Vulnerabilities
Catch malicious packages running in your environment with Runtime Vulnerability Analytics
Malicious package detection coverage in the Dynatrace Vulnerability Feed has been expanded. Runtime Vulnerability Analytics (RVA) now evaluates a broader set of malicious packages against the components loaded and executing in your environment, alongside existing vulnerability data.
Malicious package records use the same structure as vulnerability records, so existing dashboards, filters, and remediation workflows continue to work.
- Titles begin with
Malicious codeto distinguish them from known vulnerabilities. - Each record carries
CWE-506(Embedded Malicious Code). - Records default to critical severity with a CVSS 4.0 score of 9.3 (vector
AV:N/AC:L/AT:N/PR:N/UI:N/VC:H/VI:H/VA:H/SC:N/SI:N/SA:N).
Coverage spans the same six ecosystems as the Dynatrace Vulnerability Feed: Java, JavaScript, Python, Go, .NET, and PHP.
Digital Experience
Native support for Smartscape entities and fields in DEM core experience apps
We’ve upgraded our core experience apps (:experience-vitals: Experience Vitals, Users & Sessions, Error Inspector,  Synthetic) to natively use Smartscape entities and fields.
- All latest Dynatrace queries and filters in the above apps now primarily use
dt.smartscape.*entities, instead ofdt.entity.*anddt.rum.application.*. - Ready-made queries and service lists in Experience Vitals have been updated to use the new Smartscape entities and relations.
- Smartscape entities are automatically created. Incoming intents support both classic and Smartscape entities, while outgoing intents use Smartscape entities only.
We recommend to stop using legacy fields like dt.entity.application, dt.rum.application.entity, dt.rum.application.entities, and dt.rum.application.type in queries, dashboards, segments, and integrations, and start using Smartscape fields (dt.smartscape.*) in:
- DQL queries and notebooks.
- Filters, facets, and segments.
- Custom dashboards, custom metrics, workflows, and custom alerts.
Digital Experience | Users & Sessions
Improved details about why Session Replay recording may be unavailable
In Users & Sessions, you can now see the reasons why Session Replay recordings are unavailable.
Infrastructure Observability
New definity Data Observability extension
This extension lets you monitor data pipeline health, performance, and cost for Lakehouse and Spark inside Dynatrace.
Infrastructure Observability | AWS
Ingest AWS logs from Amazon S3
You can now ingest AWS logs directly from Amazon S3 via the new S3 Logs forwarder. This functionality is added alongside the existing Amazon Data Firehose ingestion method. Direct S3 ingest ships logs without the intermediate CloudWatch Logs or Firehose streaming layer, reducing costs and operational overhead while avoiding the restrictions that security-sensitive environments might impose on Firehose deployment.
To forward logs from sources such as AWS CloudTrail, Amazon VPC Flow Logs, ELB access logs, and Amazon CloudFront, deploy once with a Dynatrace-maintained AWS Lambda function in your centralized logging account. An S3 event notification triggers the Dynatrace forwarder Lambda function when a new S3 Logs object is created. The Lambda function parses, enriches, and forwards records to the new Dynatrace AWS S3 logs ingest API, where records are routed through OpenPipeline for processing and storage.
- Entity (node) linking for AWS Resources: When the log producer (source AWS Account) has an active AWS connection, log records from supported sources are linked to their Dynatrace Smartscape entity (node), unlocking logs-in-context use cases.
- CloudFormation-based deployment: A single CFN stack blueprint creates and wires all moving parts for immediate log forwarding.
- In-place upgrades: Use standard CloudFormation stack updates to upgrade to the latest version.
- Performance and health status: Log forwarder function emits metrics to CloudWatch.
Infrastructure Observability | Extensions
SNMP extension datasource now supports variable polling intervals
You can now use variables for polling intervals in SNMP extensions, letting you balance visibility and metric costs. For example, capturing key health metrics every minute but detailed metrics for hundreds of interfaces every five minutes.
An example is shown in the following code block:
vars:- id: interface-polling-intervaldisplayName: Optionally poll interfaces less frequentlytype: integerrequired: truedefaultValue: "1"...snmp:...- subgroup: interfacesfeatureSet: Interfacesinterval:minutes: var:interface-polling-interval
Infrastructure Observability | Kubernetes
New drill-down navigations in the Kubernetes app
In  Kubernetes, we’ve added a new drill-down navigation to the list, detail, and chart pages. These drill-downs allow troubleshooting into, for example, Services,
  Logs,
Logs,  Clouds, or
  Infrastructure & Operations.
Infrastructure Observability | Kubernetes
Automatic cleanup of stale Kubernetes connection settings
Dynatrace will automatically disable stale Kubernetes connection settings if no successful connection has been established for 60 days. This action is recorded in the audit log and can be reversed by re-enabling the connection via the API or the web UI.
Infrastructure Observability | Kubernetes
Navigate cross-app from Kubernetes entities
Starting with Kubernetes app version 1.43, you can now jump directly from any Kubernetes entity to related data in other Dynatrace apps. Active filters, timeframe, and segments are automatically carried over, so you land in the target app with your context already applied.
A context menu for every entity (in Explorer lists and on detail pages) provides one-click access to the most relevant view for that entity type.
What's Available
The following actions are available across most Kubernetes resources.
- Analyze services: Analyze related services in Services.
- View traces: View traces in Distributed Tracing.
- View logs: Analyze related logs in the Logs tab.
- View security: Analyze vulnerabilities and security findings in the Security tab.
- View topology: Visualize topology and dependencies in
 Smartscape.
 - Settings: Navigate to the entity settings in
 Settings.
 - Open with…: Open the entity in any other Dynatrace app that supports it.
Additional actions appear depending on the Kubernetes resource.
- View cloud service: Opens AWS/Azure container platform, VM, or storage details in Clouds (Cluster, Node, Persistent Volume).
- View host: View host details in Infrastructure & Operations (Node).
- View containers: View containers in the Infrastructure & Operations (Pod).
- Profile code/memory and Analyze threads: View processes in
 Profiling & Optimization.
 - Go to dashboards: Navigate to Kubernetes ready-made dashboards (Cluster, Namespace, Node).
Platform | API Gateway
New IAM policy conditions to scope Davis event ingest by provider and type
The openpipeline:events.davis:ingest permission now supports two new IAM policy conditions, openpipeline:event-provider and openpipeline:event-type. Use them to grant event-ingest access for a specific event source and event type, rather than granting the permission for all events. This allows users to have just the access they need.
An example policy condition to allow your user to write comments from Problems without granting broad event-write permissions is below:
ALLOW openpipeline:events.davis:ingest WHERE openpipeline:event-provider = "PROBLEM_APP" AND openpipeline:event-type = "CUSTOM_ANNOTATION";
Platform | Dashboards
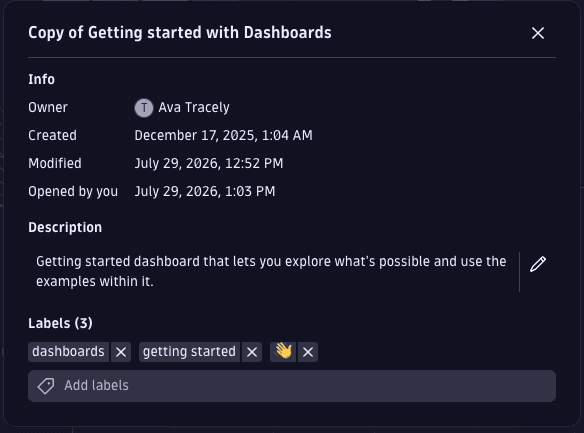
Dashboards and Notebooks now support labels for improved searching and filtering
 Dashboards and
  Notebooks now support labels, which you can use to search and filter your content list.
- To manage labels, open the menu on any dashboard or notebook and select Info & labels, then use the Add labels field to create or assign labels, or Delete labels to delete existing labels.
- To use labels, select All dashboards or All notebooks in the app, and then use the Filter by labels dropdown to narrow results by one or more labels.
For details, see [Dashboards: Manage labels|dashboards#dashboard-manage-labels] or [Notebooks: Manage labels|notebooks#notebook-manage-labels].
Platform | Dashboards
Avoid query costs from unused dashboards
Dashboard queries now stop automatically when you close the tab or navigate away. This prevents orphaned long-running work, frees capacity, and might reduce query costs.
Platform | Dashboards
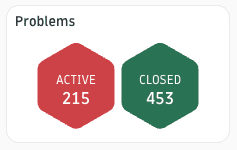
New ready-made tile: Problem count
We added a new ready-made tile to the Dashboards library that shows the open and closed problem counts as a honeycomb chart, with a built-in drill-down to Problems.
Platform | Dynatrace Intelligence
Configurable PII blocking rules for agentic AI
You can now configure which personally identifiable information (PII) blocking patterns are active for Dynatrace Intelligence agentic AI. A new setting lets administrators disable individual PII detection patterns or turn off PII blocking entirely, giving you control over the balance between data protection and response quality.
PII blocking protects sensitive data in user and workflow prompts, but overly broad detection can degrade response quality by blocking false-positives. Patterns designed to catch credit card numbers or government IDs were also flagging legitimate observability data; these include timestamps, CVE identifiers, host IDs, Kubernetes metrics, and vulnerability patterns. This overly broad detection led to blocked or degraded responses for common operational queries. With configurable blocking rules, you can selectively disable patterns that cause false positives in your environment while keeping the protections that matter to your organization.
When PII blocking is active and a detection pattern is identified in the user prompt, the chat UI highlights the match and identifies which pattern triggered it, with a link to documentation for further explanation.
Platform | Dynatrace Intelligence
Manually close active problems in Problems
You can now close one or more active problems from Problems. Select active problems from the problem list or open the details of a single problem to close it and add a closing comment.
Once the current anomaly is closed, future anomalies will trigger a new problem. You can close up to 50 problems in a single bulk action. The closing comment is available in Problems, and can also be queried from Grail. The closing process may take a short time as the status change is propagated across several systems.
You can also close problems programmatically, via the existing v2 Problems REST API.
Platform | Dynatrace Intelligence
Customization options to personalize your experience in Dynatrace Assist
Dynatrace Assist can now tailor every response to your role, expertise, and preferences. Set it once, and benefit in every conversation. With personalization, it means no more repeating context at the start of every chat. The more specific your profile and custom instructions, the more relevant Assist's answers: whether that's terse DQL examples for an experienced SRE, or guided walkthroughs for someone new to the platform.
The new Personalization screen lets you configure:
- Your profile: Describe your role (SRE, Platform Engineer, DevOps, etc.), Dynatrace expertise level, tech stack, industry, area of responsibility, and the teams you support.
- Custom instructions: Define your preferred language, tone, detail level, response format, and what to Assist should favor or avoid.
This context is applied automatically to all future conversations, and you can update, clear, or disable it at any time.
Platform | Dynatrace Intelligence
New SRE Agent workflow template
Dynatrace Intelligence for Workflows now ships a new template.
An always-on SRE teammate, triggered by real production problems, it cuts through the noise with deep root cause analysis and surfaces precise impact insights as problem annotations, so your team spends less time digging and more time fixing.
Platform | Notebooks
Overlay key events on your charts with Annotations in Notebooks
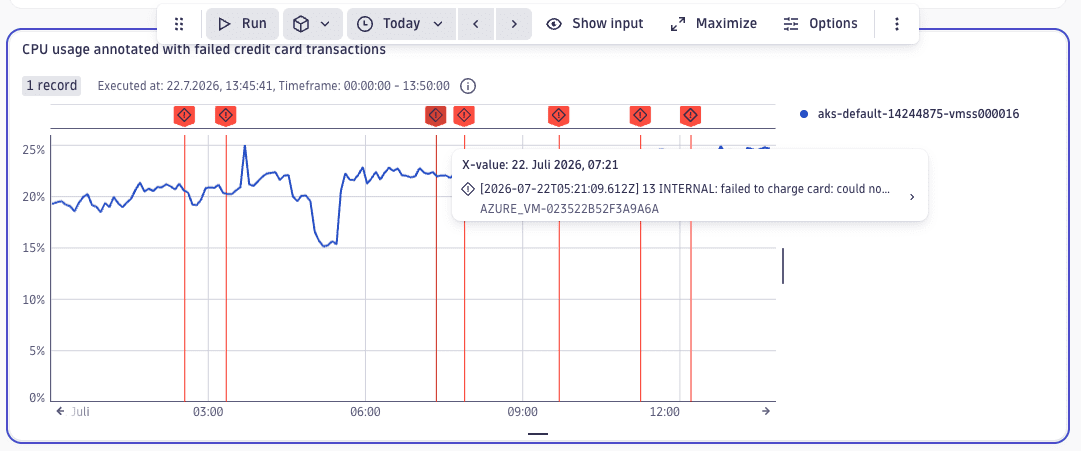
Annotations are now available in Notebooks, in addition to the already-released annotations for Dashboards. You can use annotations to mark important events such as deployments, alerts, or any other noteworthy moments on timeseries-based charts to level up your exploratory analysis.
To add an annotation, select any line, area, or bar chart and click "+" in the Annotations section within the options. Annotations can be based on DQL queries, code, or Alert configurations, and offer various visual options, such as color and icons. Use the Preview tab to verify your annotation looks as expected before saving.
You can add multiple annotations per section, and they automatically refresh with the latest data whenever the section is rerun.
Platform | OpenPipeline
OpenPipeline matcher now supports Duration type fields
OpenPipeline now supports matching via:
- Duration type on the record fields, with operators
=,!=,>,>=,<, and<=. - Duration function and duration time literals.
If the record has a field of type duration, it’s compared against other duration static type conditions (literal or duration functions). It isn’t compared against long, timestamp, or string fields.
Platform | OpenPipeline
New public HTTP endpoint to help migrate from the classic pipeline to OpenPipeline
To better help you migrate your classic pipelines to OpenPipeline, Dynatrace now has a classic pipeline migration helper tool that is exposed via a public HTTP endpoint. It performs a best-effort conversion and returns an OpenPipeline pipeline equivalent of the classic pipeline.
For more information, see [](api-platform-openpipeline-get-classic-pipeline-translation.
Platform | Platform Services
New logical operators to select Synthetic monitors via API
You can now select Synthetic monitors with logical AND and OR.
tag(tag1),tag(tag2)is the logical AND.tag(tag1,tag2)is the logical OR.
Previously, both formats were the logical OR.
Platform | Smartscape
Drill down from frontends to services in the Smartscape Service dependency graph
In Smartscape, the Service dependency graph now shows FRONTEND nodes. You can use these to drill down the call path from user-facing applications to the services they depend on, all in one view.
Platform | Smartscape
Dedicated AI Observability view in Smartscape
Smartscape now includes a dedicated AI Observability view that visualizes all of your GENAI_ nodes and their relationships, giving you full end-to-end visibility into your AI landscape and the connections between your generative AI components.
Platform | Workflows
Problem event triggers can be delayed
You can now configure a delay for Dynatrace Intelligence Problem event triggers. The trigger will fire only if a problem remains open for the configured period. This reduces noisy notifications.
Threat Observability | Security events
Stay ahead of emerging threats with STIX/TAXII integration
Proactively hunt and remediate emerging threats by automatically pulling in threat reports and their indicators of compromise from threat intelligence sources that expose STIX/TAXII 2 server. This helps your team assess exposure and act before the attackers do.
Threat Observability | Security events
Stay ahead of emerging threats with recorded future
Proactively hunt and remediate emerging threats by automatically pulling in threat reports and their indicators of compromise. This lets your team assess exposure and act before the attackers do.
Threat Observability | Security events
Stay ahead of emerging threats with LevelBlue (AlienVault) OTX
Proactively hunt and remediate emerging threats by automatically pulling in threat reports and their indicators of compromise. This lets your team assess exposure and act before the attackers do.
Threat Observability | Security events
Operationalize CrowdStrike Falcon Intelligence to stop advanced threats
Bring adversary-grade threat intelligence into your workflow. You can automatically ingest Falcon Intelligence reports and IOCs to expose your security gaps against the most sophisticated, targeted threats. For more information, see Ingest CrowdStrike detection findings, threat reports, and audit logs.
Threat Observability | Security events
Give AI agents the full scope of your security posture at runtime
The new security skill expands Dynatrace MCP security capabilities to cover all security event types (vulnerabilities, detections, and compliance findings), enriched with runtime environment context. This lets developers and SREs rely on AI agents to handle any security scenario with complete, accurate insights.
Breaking changes
Digital Experience
The user_action.custom_name field is removed from user events
The field user_action.custom_name is removed from user events in Dynatrace version 1.344 and replaced with user_action.name. Action plan: Update queries and integrations that read user_action.custom_name to use user_action.name. For details, see the RUM data model.
Fixes and maintenance
Resolved issues in this release (SaaS)
- Fixed an issue where Trace ingest control settings on the process level, and Adaptive capture control settings via process group override, were not sent to the OneAgent. (PS-48670)
- Fixed an issue where all of an environment's management zones were unintentionally deleted, when only an unsaved configuration should have been discarded. (PS-47784)
- Fixed an issue that caused the database connection pool to use dead connections. (PS-46795)
- The service pod memory request has changed from 4 GB to 1 GB. This resolves an issue that caused memory request limits to be reached when scheduling three pods. (PS-46783)
- Fixed an issue where incorrect notifications were sent when end-to-end tests execution passed successfully. (PS-46764)
- Fixed an issue with failing end-to-end tests when the Microsoft Teams app configured for
DEVwas not installed. (PS-46759) - Fixed an issue where certain Latest Dynatrace environments could not access deprecated data. (PPX-13444)
- Fixed an issue where
dt.smartscape.*was not shown as a recommended field in metric extraction. (PPX-13271) - In Clouds, if queries are canceled, the UI will now show the Overview page. (INFOBS-11134)
- We’ve adjusted the query intervals used to determine which Dynatrace version the environment is on, which avoids infinite loops in certain cases. (INFOBS-10736)
- We’ve adjusted the Events tile in Infrastructure & Operations so that all text renders correctly. (INFOBS-10716)
- Fixed an issue in Infrastructure & Operations where primary tag filters and the Primary tags column could be missing in Smartscape-based inventory tables. Primary tags are now detected correctly from Smartscape node fields. (INFOBS-10711)
- Fixed an issue where the Clouds > Metrics > Other metrics section didn’t load the entity details sidebar properly. (INFOBS-10457)
- Fixed an issue where
dt.security_contextwas missing on Smartscape HOST and PROCESS entities. (ICP-8064) - Fixed an issue where the Semantic Dictionary generator couldn’t parse content when the
unitproperty is used. This addsunit.jsonto the Docker image. (GRAIL-54075) - Fixed the placeholder substitution in OpenPipeline Davis event extraction for very large and very small double values. Scientific notation is no longer used. (DI-29566)
- Fixed an issue where the Settings client used user credentials and not the OAuth client, leading to
HTTP 403errors. This fix overrides the authorization scope to useClientCredentialsAuthProvider. (DI-29513) - Fixed an issue where the dot character (
.) was not properly escaped in match patterns for blocked resources; it was treated as a normal character. (DEM-30213) - Updated session classification to distinguish standalone navigations from navigations that occur as part of a user action, resulting in more accurate session handling. (DEM-29922)
- Fixed an issue where Problem investigation used the wrong timeframe unless the page was manually refreshed. (DEM-29597)
- Fixed an issue where the New alert button could be selected multiple times. (DEM-29377)
- Fixed an issue that prevented saving changes to health alerts when the actor was a user other than the one logged in to Dynatrace. (DEM-29159)
- Fixed an issue where Session Replay errors caused Users & Sessions to crash. These errors are now handled within the player. (DEM-29038)
- Fixed an issue where recorded modals in Session Replay don’t appear if they’re applied to a disconnected node. (DEM-28315)
- Fixed an issue where VMware monitoring returned an invalid credentials notification. (DAQ-26778)
- Fixed an issue where duplicate endpoints in a sufficiently big monitoring configuration of an extension sometimes broke parts of the configuration, until the extension was disabled and re-enabled. (DAQ-24689)
- Fixed an issue where searching for entities by ID within Site Reliability Guardian templates did not correctly return results. (CA-19896)
- Fixed an issue where Dynatrace Assist wasn't available for free trials. (BIZOBS-2251)
- Fixed an issue in QuickStart where the (data refresh button) didn't display data according to the most recent timeframe. (BIZOBS-2076)
- Migrated the policy-resolution domain. (BIZOBS-2045)
- Fixed an issue where the status of deployment steps in a deployment target was not updated, even when the pull request was merged. (ASDY-28003)
- Fixed an issue where the infrastructure versions in deployment bundles (used with Monaco) were inherited from the template and could not be overridden. (ASDY-28001)
- Fixed an issue in
 Live Debugger where instances weren't visible with certain groupings or filters. (APPOBS-37154)
 - Fixed an issue for environments migrating from Logs Classic to Log Analytics, where billing events for logs ingest were missing during parallel ingest periods. Now, ingest will be billed via Logs Classic during the parallel ingest period; once the environment has fully migrated then ingest will be billed as Log Analytics. (APPOBS-36300)
- Fixed an issue where tree maps based on the new flat format disappeared when legend items were selected. (APPDEV-18499)
- Fixed an issue where the tooltip did not reposition when using touch drag for fixed-width charts on mobile devices. (APPDEV-18435)
- Fixed an issue where visual annotations on histograms did not correctly highlight indicators. (APPDEV-18409)
- Fixed an issue that caused cryptic error messages when using Vite versions before 8.0. (APPDEV-18377)
- Fixed the Evals by method chart DQL in the AI Observability > Evaluations screen, so that the correct data is shown. (AI-263)
- GCP (Google Cloud Platform) Smartscape entities now show proper names and impact in Problems. (DI-29326)
- Fixed an issue with Session Replay playback where page fonts were not loaded if the response was late. (DEM-29408)
- Fixed an issue where incompatible primary tags could be added when creating or editing an extension’s monitoring configuration via the Metrics API v1. (DAQ-26767)