What's new in Dynatrace SaaS 1.339
- Release notes
- 7-min read
- Rollout start on May 19, 2026
This page showcases new features, changes, and bug fixes in Dynatrace SaaS version 1.339. It contains:
Platform | Dashboards
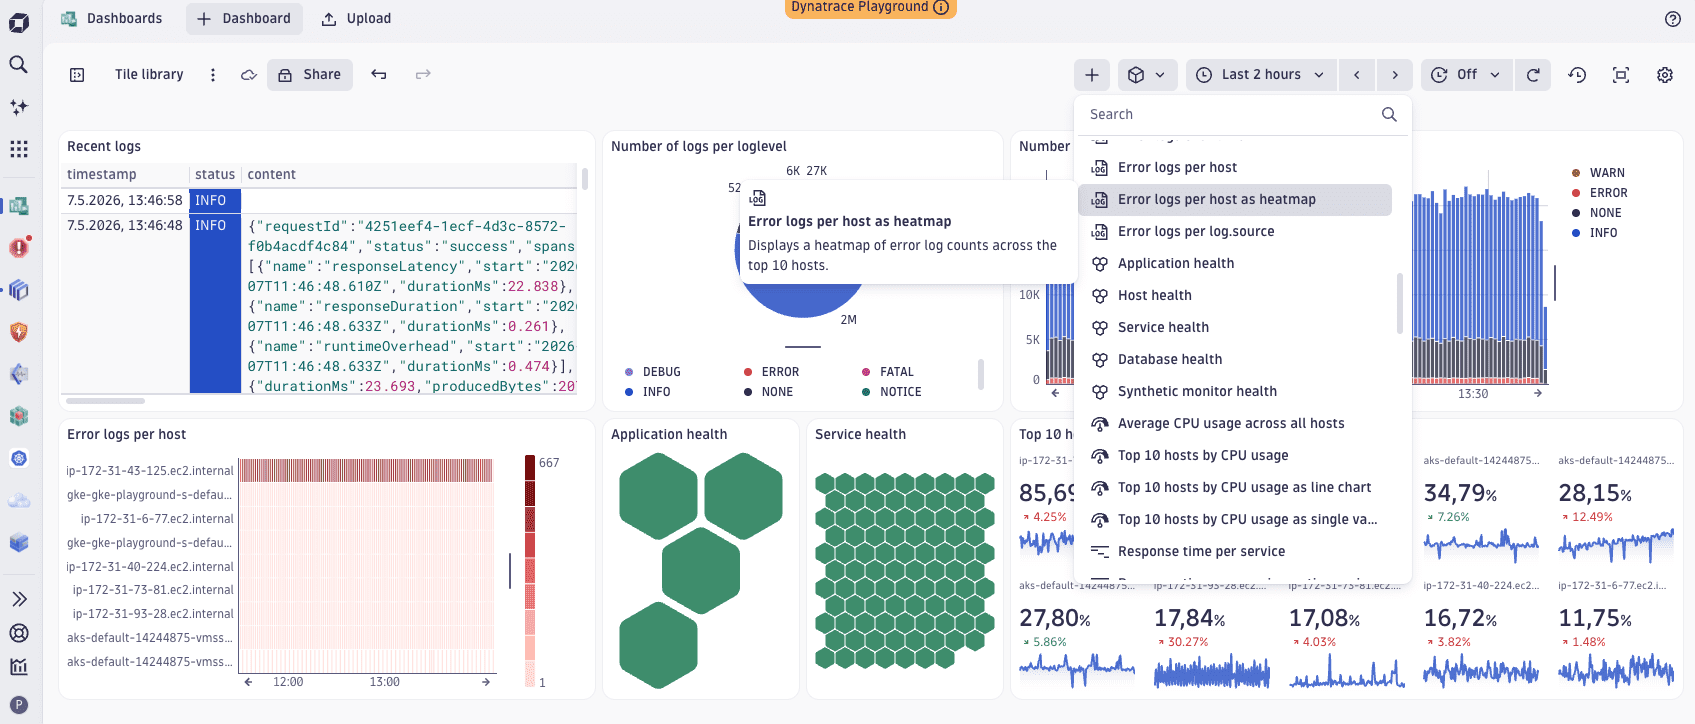
Get started faster with improved ready-made tiles and sections
 Dashboards and
  Notebooks now come with a comprehensive library of ready-made tiles and sections. Each tile and section includes preconfigured visualizations and drill-downs into other apps, so you can go from zero to insight faster.
To access them, select in Dashboards or Notebooks, then scroll through the list or search for a specific ready-made tile or section.
Feature updates
Application Observability
View log attributes in fullscreen
You can now view the full value of any log attribute in fullscreen directly in ![]() Logs.
Logs.
Application Observability | Log Analytics
Log queries now run automatically when you open Logs from context
When you open ![]() Logs from a dashboard, app, or other context, the log query runs automatically. You no longer need to select Run query to see log records.
Logs from a dashboard, app, or other context, the log query runs automatically. You no longer need to select Run query to see log records.
Business Analytics | Business Analytics
Unification of Cost & Carbon tiles
Cost and carbon metrics are now combined in a single tile, providing a clear snapshot of current values alongside 24‑hour trends.
Business Analytics | Business Analytics
Ingest up to 12 months of historical cost data
You can now ingest up to 12 months of historical cost data through monthly ingestion.
Digital Experience
Custom buckets for user.events and user.sessions tables
Real User Monitoring (RUM) now supports custom buckets for the user events table (user.events) and the user sessions table (user.sessions).
By default, RUM data is stored in the system default bucket for 35 days. You can optionally route subsets of RUM data into custom buckets using configuration rules. With custom buckets, you can control how your RUM data is stored:
- Assign specific RUM data to dedicated buckets.
- Configure custom retention and storage tiers per bucket. To leverage the extended retention, join the Extended Retention for RUM and Synthetic program.
- Separate data for cost control, compliance, or team boundaries.
Digital Experience
End-to-end correlation between RUM and backend traces with W3C traceparent and tracestate headers
Frontend RUM agents on Grail now set W3C traceparent and tracestate headers on outgoing requests, enabling end-to-end correlation between frontend sessions and backend traces in Grail. Web applications can enable header propagation for CORS requests via a new third-generation setting. Mobile agents support remote configuration and a manual linking API.
Digital Experience | Error Inspector
Error Inspector now uses Smartscape 2.0 entity data
Error Inspector now uses entity data from  Smartscape 2.0.
Infrastructure Observability
Enhanced log parsing for Azure
We improved Azure service log parsing via our new Azure Cloud Platform Monitoring. This release provides upgraded native log parsing and analytics for selected Azure services, including Azure Function App, Azure MSSQL, Azure Application Gateway, Azure Load Balancer, and AKS. The features include better extraction of log levels, status codes, and additional fields.
The features are available as preconfigured processing bundles in the OpenPipeline ingest source, Data Acquisition - Azure EventHub, with no configuration changes needed. Log parsers for other existing Azure services not mentioned in this release remain unchanged.
For details on log streaming via Azure EventHub, see Azure logs and events.
Infrastructure Observability
Kubernetes Health Alerts, Warning Signals, and Custom Alerts
You can now ingest most Kubernetes out-of-the-box alerts as warning signals instead of Davis problems. The optional toggle is turned off by default; when turned on, the events are classified as warnings rather than alerts wherever you query them—including in ") Kubernetes. The Kubernetes anomaly detection settings page also has a refreshed look.
Kubernetes. The Kubernetes anomaly detection settings page also has a refreshed look.
Infrastructure Observability | Clouds
GCP onboarding now lets you choose when to deploy Terraform
In the GCP onboarding, you can now choose how to deploy Terraform:
- Deploy Terraform now (default): Deploy the downloaded Terraform, then wait up to five minutes for the service account to become ready. Select Finish to activate GCP monitoring configuration.
- Deploy Terraform later: Select Finish to complete onboarding with monitoring configuration deactivated. After you deploy the Terraform later, run the
dtctlcommand shown in the UI to activate monitoring configuration.
Infrastructure Observability | Discovery & Coverage
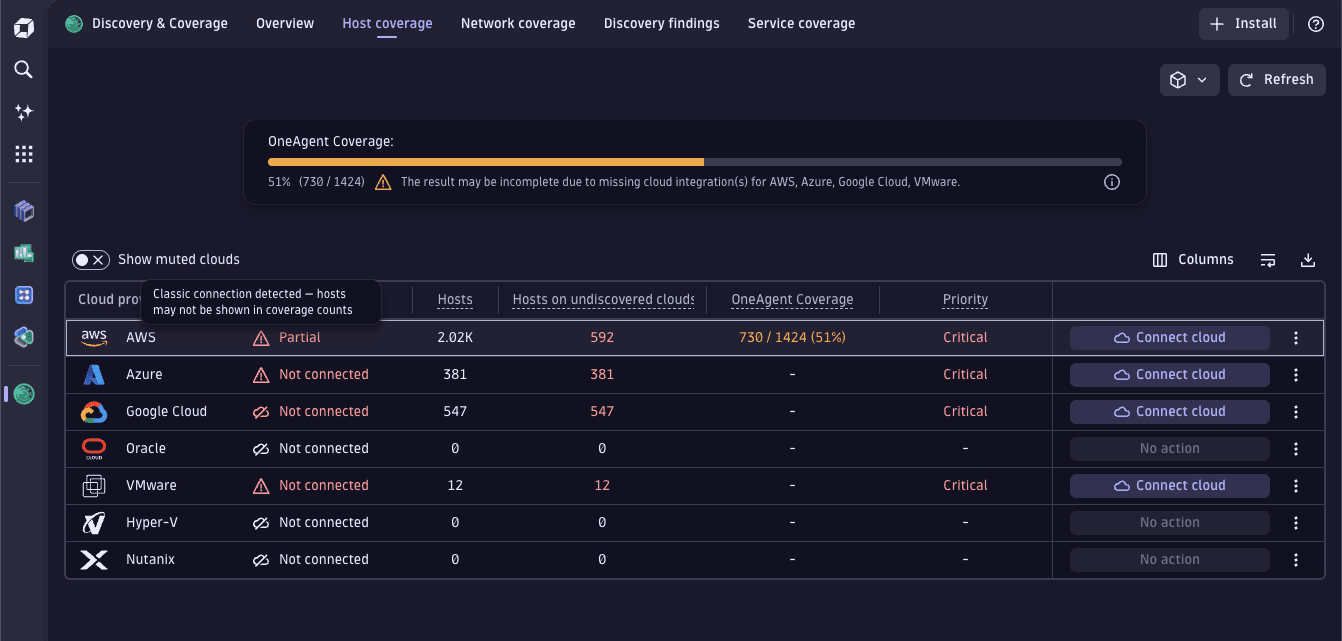
Improved Host Coverage view in Discovery & Coverage app
We’ve updated the design of the  Discovery & Coverage > Host Coverage page to improve the user experience, and added information on classic and new connections to help with upgrading. Additionally, discovered hosts now come from new cloud connections for AWS and Azure.
Infrastructure Observability | Hosts
Process and host entity in Smartscape on Grail have a new field has_public_traffic
The process and host entities in Smartscape 2.0 now have a new field, process/host.has_public_traffic, with the options for true or false.
For details see host and process entities in the Semantic Dictionary.
Infrastructure Observability | Infrastructure & Operations
Public communication addresses endpoint now returns environment domain and NLB FQDNs
The endpoints that provide the list of Dynatrace public communication addresses (GET /deployment/public/network and GET /fleet-management/v1/network-addresses) now also return FQDNs alongside IP addresses.
Platform
Cloud and resource dimensions in OpenPipeline self‑monitoring metrics
OpenPipeline self-monitoring (SFM) metrics now include cloud and resource dimensions, so you can break down ingest by cloud provider and resource. The SFM metrics are:
dt.sfm.openpipeline.ingest_sources_in.recordsdt.sfm.openpipeline.routing.recordsdt.sfm.openpipeline.pipelines_out.recordsdt.sfm.openpipeline.not_stored.records
The new dimensions are: cloud.provider, aws.region, azure.location, gcp.region, aws.resource.type, azure.resource.type, gcp.asset.type
Platform
Free-text support for non-entity filters in Data Explorer
The Filter by field in  Data Explorer now accepts free-text input for non-entity filters. As you type, the free-text option appears with immediate feedback.
Platform
Help menu for keyboard shortcuts
We’ve introduced a help menu for keyboard shortcuts. To open the menu, select Shift + ?.
Platform | Dashboards
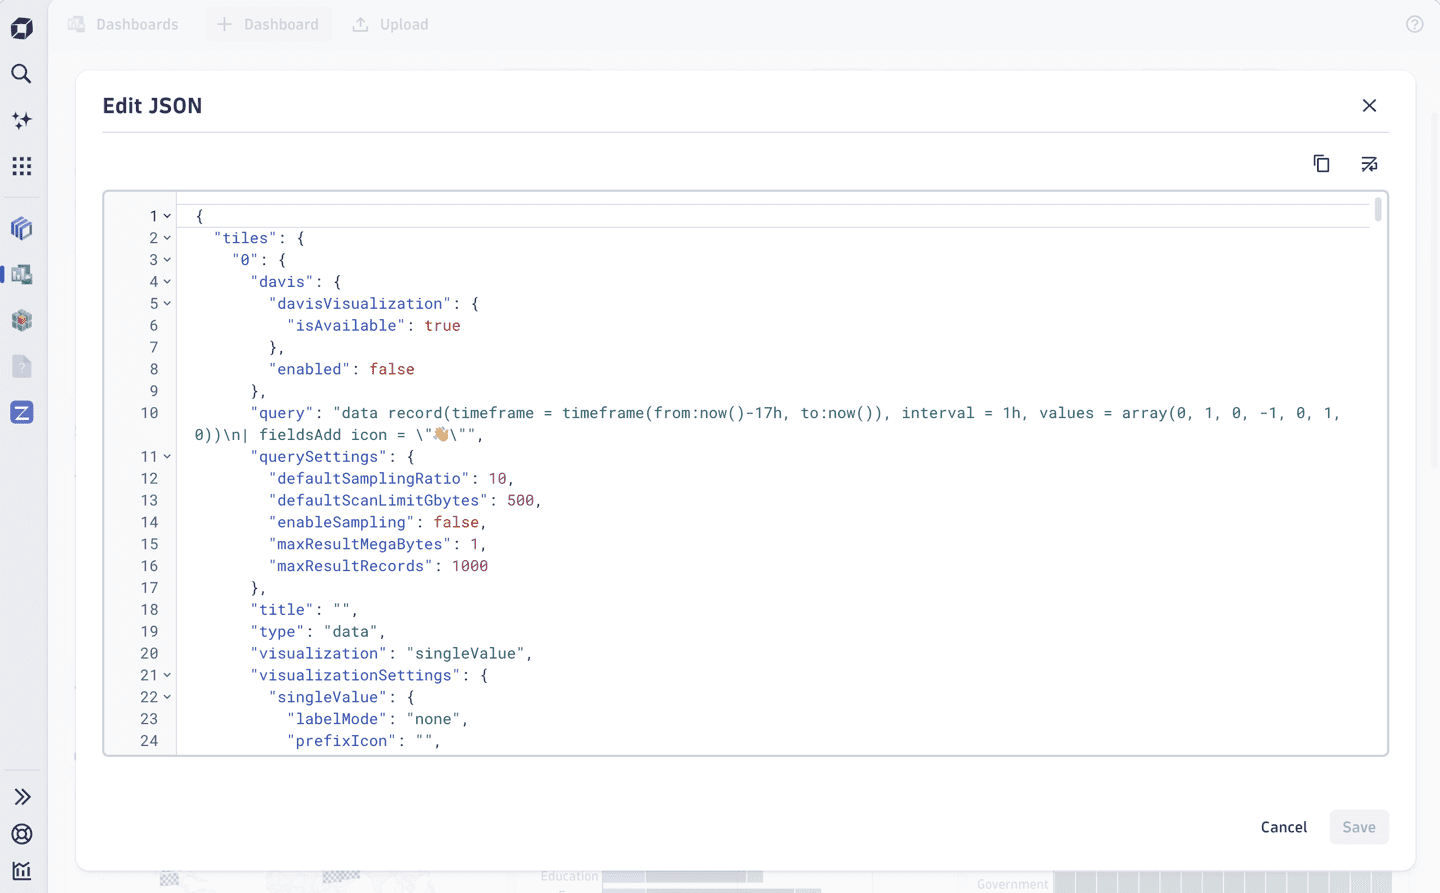
Edit dashboards through JSON
You can now edit your dashboard's underlying JSON directly in Dashboards. Reorder tiles, make bulk changes, or copy JSON partials between dashboards and environments, all without API calls. Built-in validation prevents you from saving broken or malicious configurations.
Platform | DQL
More flexibility for pattern matching in DQL
DQL string patterns using the * wildcard character now support wildcards in the middle of a pattern. Additionally, the wildcard character itself can now be customized, enabling patterns that also match literal wildcard characters, for example: matchesPhrase(message, "a%/*", wildcard:"%").
This enhancement applies consistently across all string-matching functions and operators, including:
matchesValue().matchesPhrase().- the
searchcommand. - the
~operator. - field name patterns in field selection commands (for example,
| fieldsKeep "dt.*.host"). - Smartscape node and edge type selection.
- Grail bucket name selection in
fetchandtimeseriescommands.
Platform | OpenPipeline
Configure pipeline groups in OpenPipeline (Early Access)
You can now configure pipeline groups through the newly designed Pipeline groups tab. This release adds a dedicated UI for pipeline groups, allowing you to create groups, manage their composition, and control member stages and pipeline membership. To access the feature, go to ![]() Settings > Process and contextualize > OpenPipeline, select a configuration scope such as Logs, and open the Pipeline groups tab.
Settings > Process and contextualize > OpenPipeline, select a configuration scope such as Logs, and open the Pipeline groups tab.
Platform | Smartscape
Smarter, more complete topology views across Smartscape
Smartscape expands its hyperscaler coverage with a new Azure topology view, built on the newly released Azure cloud monitoring feature. This provides end-to-end visibility into your Azure infrastructure and its relationships. Additionally, all flat Smartscape views have been improved. Edges are now fetched using a smarter relevance-based logic that surfaces more of the connections that matter, and nodes are loaded according to a priority list to ensure the most important entities in your environment are always visible first.
Breaking changes
Digital Experience | Synthetic
Deployment templates updated for Kubernetes and OpenShift synthetic locations
The synthetic private location and metric adapter deployment templates have been updated to support Latest Dynatrace environments. A new environment variable, METRIC_3RD_GEN_ENABLED, allows the adapter to automatically select the appropriate API version based on your Dynatrace environment configuration.
For more information, see Containerized, auto-scalable private Synthetic locations on Kubernetes.
Infrastructure Observability | Infrastructure & Operations
Network Zone APIs based on old configs are deprecated
The /api/v2/networkZone endpoint is deprecated. Use the Settings API endpoint /api/v2/settings/objects with schema builtin:networkzones.zones to list network zones. For more information, see the Dynatrace API release notes.
Fixes and maintenance
Resolved issues in this release (SaaS)
- Fixed an issue where the Deep monitoring / Process group monitoring settings that deactivated monitoring were ignored for standalone/application-only and manually injected OneAgents. (PS-42728)
- Fixed an issue where a message was being displayed stating that Python 3.14 is not supported on Linux. Message was incorrect as actual monitoring of the process works starting with OneAgent version 1.329+. (MGD-11388)
- The functions
isIpPublic,isIpPrivate,isIpLoopback, andisIpLinkLocalare now aligned with the RFC specifications. (GRAIL-50508) - The built-in view
dt.davis.problemsnow also queries the built-in bucketdefault_davis_custom_events. (DI-27665) - Davis events now correctly processes the incoming
dt.openpipeline.pipelinesfield. (DI-26405) - Fixed an issue causing the RUM JavaScript to add headers to cross-origin requests if the
basetag points to a different origin, which triggered potentially broken preflight requests. (DEM-26180) - Fixed an issue that resulted in consecutive visit generation if cookies cannot be set. (DEM-25392)
- Fixed incorrect error codes displayed in HTTP monitor problem descriptions. (DEM-25013)