Azure logs and events
- Latest Dynatrace
- How-to guide
The new Azure log and event ingest solution is a SaaS-based approach for collecting Azure platform logs and events. It eliminates much of the operational overhead that was required for self-hosting the Dynatrace Azure Log Forwarder.
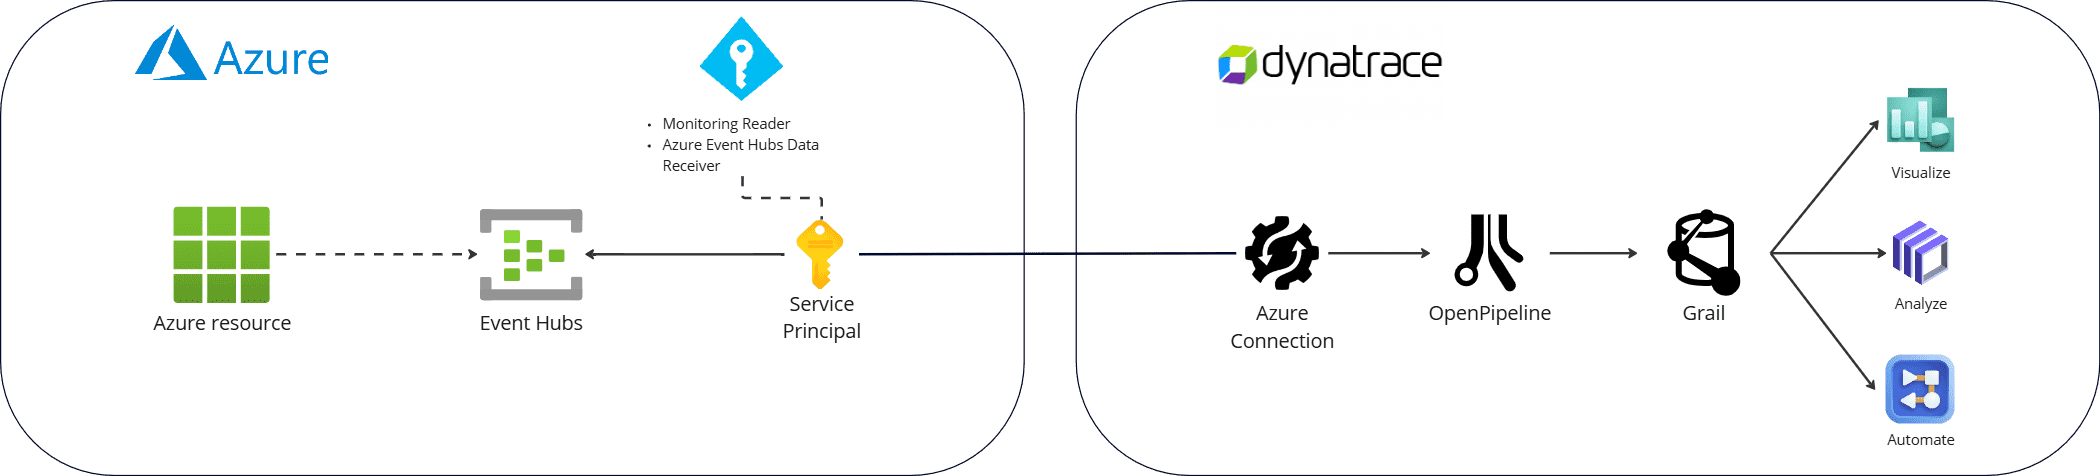
Azure forwards your logs and events to an Azure Event Hubs namespace, and Dynatrace pulls them from there. This removes the need to host, scale, or maintain any custom function code. You can either let Dynatrace deploy the Event Hubs infrastructure for you, or onboard an Event Hubs namespace that you already own. Dynatrace discovers both the same way, using Azure tags.
To support your log and event ingestion, follow the steps below and onboard Azure regions.
Onboard Azure regions
There are two supported ways to provide the Event Hubs infrastructure that Dynatrace ingests from:
- Option 1: Deploy new Event Hubs with the ARM template Recommended: Dynatrace provisions the Event Hubs infrastructure for you.
- Option 2: Onboard an existing Event Hubs namespace: use an Event Hubs namespace that you already own.
Both options must satisfy the same Event Hubs requirements. You can add additional Azure regions at any time after a connection is created.
Either option needs the following details:
| Value | Description |
|---|---|
Dynatrace environment ID | Your Dynatrace environment identifier. |
Monitoring configuration ID | The ID of the monitoring configuration associated with your Azure connection. Shown in connection Overview. |
Principal (object) ID | The Object ID of the Azure service principal. Note: This is the Object ID, not the Application (client) ID. Shown in connection Overview. |
If the Principal (object) ID is not shown in the connection Overview, retrieve it using the Azure CLI with the Application (client) ID:
az ad sp show --id <application-client-id> --query id -o tsv
Event Hubs requirements
Dynatrace discovers and connects to Event Hubs namespaces based on three requirements:
-
Service principal read access: Dynatrace finds namespaces by querying Azure Resource Graph as the service principal of your Azure connection. The service principal must hold a control-plane read role at subscription or management group scope. The
Azure Event Hubs Data Receiverrole alone isn't sufficient. For details, see Azure permissions. -
Azure tags: The Event Hubs namespace requires the
managed-by: dynatraceanddt-log-ingest-activated: <monitoring-config-id>tags. The Dynatrace platform won't connect to namespaces that are missing these tags.If your Azure connection uses tag-based filters, also add the tag
managed-by:dynatraceto Include filters. Otherwise, an include filter can exclude the namespace from discovery, and the region showsNot deployed. Adding it uses one of the five include filters. Alternatively, tag the namespace with a tag that's already in your Include filters. For details, see Troubleshooting. -
Event Hub naming: By default, Dynatrace expects Event Hub names
dt-logs-evhfor log forwarding anddt-events-evhfor event forwarding. These defaults can be overridden by addingdt-azure-logs-eh*ordt-azure-events-eh*tags to the namespace. For details, see the Azure tags table below.
Dynatrace discovers namespaces by Azure tag, not by name. The namespace can have any name, live in any resource group, and be created by any means, which is what makes Option 2 possible.
Any Event Hubs SKU works. Standard or Premium is recommended for production workloads, because only those SKUs support the dedicated dynatrace consumer group and auto-inflate. The Basic SKU is supported for Dev/Test scenarios, where Dynatrace falls back to the $Default consumer group. For details, see Reserved consumer group in Namespace considerations.
Dynatrace uses the following namespace tags. Required tags enable automatic discovery; optional tags override the default Event Hubs names.
| Key | Value | Required |
|---|---|---|
|
| Yes |
| The ID of the monitoring configuration associated with your Azure connection. Shown in connection Overview. | Yes |
| Override the default | No |
| Override the default | No |
Option 1 applies the required tags and Event Hub names automatically. With Option 2 you apply them yourself. Neither option assigns the control-plane read role. For details, see Azure permissions.
Option 1: Deploy new Event Hubs with the ARM template
To deploy the ARM template, your Azure identity requires:
Contributorat subscription or management group scope—to create resource groups and Event Hub resources.OwnerorUser Access Administratorat subscription or management group scope—only required if you select I have permissions to perform Azure Role Assignments during deployment.- A custom role with
Microsoft.Authorization/roleAssignments/writepermission also satisfies this requirement.
The ARM template always creates a new resource group and Event Hubs namespace. You can't point it at an existing namespace, so to use a namespace you already own, follow Option 2 instead.
Select the button below to deploy the Azure logs and events infrastructure to your Azure environment. You will be prompted to enter the values described in the table above.
The ARM template source is available on GitHub.
Once deployed, the new region should appear within five minutes in the Logs tab with Deployed status.
Deployed Azure resources per region
The ARM template deploys the following resources into each selected Azure region:
| Resource type | Name | Description |
|---|---|---|
|
| A dedicated resource group created in the selected region to contain all Dynatrace log ingestion resources. |
|
| An Event Hub namespace used as the ingestion endpoint. Auto-inflate is enabled for Standard SKU to handle throughput spikes automatically. Tagged with |
|
| Event Hub for Azure Resource Log forwarding via Diagnostic Settings. Default: 4 partitions, 1-day retention. This is the default name—it can be overridden using |
|
| Event Hub for Azure Event Grid System Topic subscriptions. Default: 1 partition, 1-day retention. This is the default name—it can be overridden using |
|
| RBAC role assigned to the Dynatrace service principal at the resource group scope, granting data-plane permission to consume messages from the event hubs. This role doesn't grant the control-plane read access that Dynatrace needs to discover the namespace. For details, see Azure permissions. |
Option 2: Onboard an existing Event Hubs namespace
If you already operate Azure Event Hubs, you can onboard an existing namespace instead of deploying a new one. Dynatrace discovers it the same way (by Azure tag), so the namespace name, resource group, and how it was created don't matter.
You only need the event hub for the signals you want to ingest: a log event hub for Azure logs, an event event hub for Azure events and Azure alerts, or both.
What your namespace needs
- SKU: any SKU works. Standard or Premium is recommended for production workloads; Basic is supported for Dev/Test, where Dynatrace uses the
$Defaultconsumer group instead of a dedicated one. - Region: Azure resource logs can only be forwarded to an event hub in the same region as the resource, so you need one namespace per monitored region. Activity logs, Microsoft Entra ID logs, Microsoft Defender for Cloud alerts, Azure Event Grid events, and Azure Monitor alerts can use a namespace in any region.
- Partitions and retention: no minimum. These affect ingestion throughput and how much replay buffer exists if ingestion pauses. For reference, the ARM template uses four partitions with 1-day retention for the log event hub, and one partition with 1-day retention for the event hub.
Onboard the namespace
-
Provide the event hubs. There are two ways to do this—pick whichever suits your environment.
Use the Dynatrace event hub names Recommended
Create new event hubs using the names Dynatrace looks for by default:
dt-logs-evhfor log forwardingdt-events-evhfor event and alert forwarding
No override tag is needed. Skip the third bullet in step 3.
Use your own event hub names
Keep your existing event hubs as they are and declare their names to Dynatrace with a namespace tag in step 3. For example, if your event hubs are named
platform-logsandplatform-events:Your event hub Used for Namespace tag to set platform-logsLog forwarding
dt-azure-logs-eh:platform-logsplatform-eventsEvent and alert forwarding
dt-azure-events-eh:platform-eventsTo ingest from more than one event hub of the same type, either list them in a single tag as a comma-separated value (
dt-azure-logs-eh:"app-logs, infra-logs"), or add one tag per event hub using a unique suffix (dt-azure-logs-eh-app:app-logsanddt-azure-logs-eh-infra:infra-logs). -
Create the
dynatraceconsumer group on each event hub you'll use. See Reserved consumer group in Namespace considerations for the Azure portal and Azure CLI commands. -
Tag the namespace with the keys listed in Event Hubs requirements:
managed-by: dynatracedt-log-ingest-activated: <monitoring-config-id>dt-azure-logs-eh*ordt-azure-events-eh*, only if your event hub names differ from the defaults. For details, see the example in step 1.
Apply the tags to the Event Hubs namespace itself, not to its resource group. Tags on the resource group are not inherited for discovery, and Dynatrace won't find the namespace.
If your Azure connection uses tag-based filters, also add
managed-by:dynatraceto Include filters. For details, see Event Hubs requirements. -
Check the Azure RBAC roles on the Dynatrace service principal. Both are required and neither substitutes for the other. For details, see Azure permissions.
-
Monitoring Readerat subscription or management group scope, for the control-plane read that discovery depends on.This role is assigned to the service principal during your Azure connection setup. Verify it and, if it's missing, assign it.
-
Azure Event Hubs Data Receiver, at any scope that covers the namespace.Nothing assigns this role for you on this path. The ARM template optionally assigns it for the namespaces it creates, so when you bring your own namespace you always need to assign it yourself.
-
-
Configure forwarding into your event hubs. See Azure logs, Azure events, and Azure alerts.
-
Verify. Within five minutes the region should appear with
Deployedstatus in the Logs and events tab of your Azure connection. If it stays atNot deployed, see Troubleshooting.
Namespace considerations
One Azure connection per namespace
Each Event Hubs namespace supports only one Azure connection. The dt-log-ingest-activated tag accepts a single monitoring configuration ID, so a namespace can't be associated with more than one connection.
Share the namespace with other workloads
If the Event Hubs namespace or event hub are shared with workloads other than Dynatrace, ensure that sufficient throughput units are provisioned to serve all workloads at peak load. Monitor namespace throughput and throttling errors to detect capacity issues before they affect ingestion.
Event schema requirements when sharing
If you share an event hub with other workloads, those workloads must publish events in the schemas that Dynatrace expects:
- Logs event hub (
dt-logs-evhdefault, or your own name if overridden): expects the Azure Monitor resource log schema, as produced by Azure Monitor Diagnostic Settings. - Events event hub (
dt-events-evhdefault, or your own name if overridden): expects CloudEvents v1.0 schema with Azure Event Grid for Azure Event Grid events, and the Common alert schema for Azure Monitor Alerts forwarded via Action Groups.
Events that do not conform to the expected schema are dropped without being ingested. When this occurs, Dynatrace issues a System Event to alert you. You are responsible for ensuring that any additional workloads publishing to these event hubs use the correct schema. Publishing non-conforming events will also incur Azure costs without any corresponding ingestion benefit.
Reserved consumer group
Dynatrace uses a dedicated dynatrace consumer group on each event hub for ingestion, we do not recommend to use the $Default consumer group. If the dynatrace consumer group does not exist, Dynatrace falls back to the $Default consumer group and issues a system event to alert you.
The Azure Event Hubs Basic SKU only supports the $Default consumer group. Custom consumer groups can't be created.
If you deploy with the Basic SKU (Dev/Test configuration), Dynatrace will always use the $Default consumer group. Use the Standard or Premium SKU to create a dedicated dynatrace consumer group.
If the consumer group is missing, create it on the logs and events event hubs (dt-logs-evh and dt-events-evh by default, or your own names if you overrode them):
- In the Azure portal, go to the Event Hubs namespace.
- Under Entities, select Event Hubs.
- Select the event hub (for example,
dt-logs-evh). - Select Consumer groups > Consumer group.
- Enter
dynatraceas the name and select Create. - Repeat steps 3–5 for
dt-events-evh.
The dynatrace consumer group must not be used by other consumers. Using it outside of Dynatrace will cause ingestion failures.
Azure permissions
Log and event ingestion requires two Azure RBAC roles on the Dynatrace service principal. Each role does a different job, and neither substitutes for the other: one lets Dynatrace find your Event Hubs namespace, the other lets Dynatrace read from it. If either role is missing, ingestion doesn't start.
| Role | Access type | Scope | Purpose |
|---|---|---|---|
| Control plane | Subscription or management group | Lets Dynatrace discover the tagged Event Hubs namespace by querying Azure Resource Graph. |
| Data plane | Any scope that covers the namespace | Lets Dynatrace consume messages from the event hubs. |
Monitoring Reader is the role Dynatrace requires, and it's what your Azure connection setup assigns. If the service principal already holds Reader, that also provides the control-plane read access that namespace discovery depends on, so you don't need to assign both.
The scopes above are the standard configuration. For log and event ingestion on its own, you can assign Monitoring Reader at the resource group that contains the Event Hubs namespace instead. This narrower scope doesn't support Azure Monitor metric polling, which requires subscription or management group scope. For details, see Azure metrics.
The <principal-object-id> used in the commands throughout this section is the Object ID of the Dynatrace service principal. You can find it in connection Overview, see Manage Azure connections. It's not the Application (client) ID.
Verify the Monitoring Reader role
The Monitoring Reader role is assigned to the service principal at subscription or management group scope when you create your Azure connection, so it's normally already in place. Use the steps below to confirm it.
- In the Azure portal, go to the subscription that contains the Event Hubs namespace.
- Select Access control (IAM).
- Select the Role assignments tab.
- Set the Scope filter to All to include roles inherited from a management group.
- Confirm that the Dynatrace service principal has the
Monitoring Readerrole.
Assign the Monitoring Reader role
- In the Azure portal, go to the subscription or management group that contains the Event Hubs namespace.
- Select Access control (IAM) > Add > Add role assignment.
- Search for and select Monitoring Reader, then select Next.
- Under Members, select Select members and search for the Dynatrace service principal by name or by its Object (principal) ID.
- Select Review + assign.
Verify the Azure Event Hubs Data Receiver role
This role lets Dynatrace consume messages from the event hubs. On its own it isn't enough—without Monitoring Reader, Dynatrace never discovers the namespace and ingestion doesn't start.
You can assign this role at any scope that covers the namespace: the namespace itself, its resource group, or the subscription. The examples below use the resource group scope, matching what the ARM template creates. If you onboarded an existing namespace, substitute your own scope.
During the ARM deployment, role assignment is optional.
-
If you selected I have permissions to perform Azure Role Assignments, the
Azure Event Hubs Data Receiverrole is assigned automatically to the Dynatrace service principal at the resource group scope. -
If you skipped this step, an administrator must assign the role manually for each deployed region.
- In the Azure portal, navigate to the resource group
rg-dt-<environment-id>-<location>for each deployed region. - Select Access control (IAM).
- Select the Role assignments tab.
- Confirm that the Dynatrace service principal has the
Azure Event Hubs Data Receiverrole assigned at this scope.
Assign the Azure Event Hubs Data Receiver role
Repeat the following steps for each region's resource group (rg-dt-<environment-id>-<location>):
- Go to the resource group in the Azure portal.
- Select Access control (IAM) > Add > Add role assignment.
- Search for and select Azure Event Hubs Data Receiver, then select Next.
- Under Members, select Select members and search for the Dynatrace service principal by name or by its Object (principal) ID.
- Select Review + assign.
The <principal-object-id> is the Object ID of the Dynatrace service principal. You can find it in connection Overview, see Manage your Azure connections. It's not the Application (client) ID.
Azure costs
This solution incurs charges across the following Azure services:
-
Azure Event Hubs: Charges are based on the SKU tier (basic versus standard) and the number of active throughput units (TUs).
Choose a configuration size that matches your expected log volume—undersizing risks dropped ingestion, and oversizing adds unnecessary cost.
Configuration size SKU Baseline TU Max TU (auto-inflate) Max throughput Dev/Test
Basic
1
—
3.6 GB/hour
Small
Standard
1
4
14.4 GB/hour
Medium
Standard
1
16
57.6 GB/hour
Large
Standard
1
32
115.2 GB/hour
Standard SKU configurations use auto-inflate: TUs scale automatically under load up to the Max TU limit. Azure bills for the peak TU count reached each hour, so costs can exceed a baseline estimate during ingestion spikes. Select Custom in the ARM template to set your own TU ceiling and keep costs predictable.
Use the Azure pricing calculator to estimate monthly costs before deploying. Select Event Hubs, choose the matching SKU, and enter the Max TU value for a worst-case estimate. If your log volume is unknown, start with Small and monitor namespace throughput metrics in Azure Monitor. You can redeploy with a larger size at any time.
-
Azure Monitor log export: Log export via Diagnostic Settings to Event Hubs is billed per GB of data exported. See Azure Monitor pricing for current rates.
-
Azure Event Grid: Resource lifecycle event forwarding is billed per million operations, with the first 100,000 operations per month at no cost. See Azure Event Grid pricing for current rates.
-
Azure Monitor Alerts: Alert notifications sent to Event Hubs via Action Groups are billed per notification, with the first 1,000 notifications per month at no cost. See Azure Monitor pricing for current rates.
Next steps
With Azure regions onboarded, learn more about forwarding logs and events.
Azure logs
Forward activity logs, resource logs, Microsoft Entra ID audit logs, and Microsoft Defender for Cloud alerts to Dynatrace via Azure Event Hubs.
Azure events
Forward resource lifecycle events (including blob creation and deletion, resource group changes, and service health alerts) to Dynatrace via Azure Event Grid and Event Hubs.
Azure alerts
Forward Azure Monitor Alerts to Dynatrace via Action Groups and Event Hubs.
Troubleshooting
A region shows "Not deployed" although the Event Hubs infrastructure exists
This occurs when the Dynatrace platform can't discover the Event Hubs namespace. Discovery runs as an Azure Resource Graph query executed by the service principal, so a namespace that the service principal can't read is invisible to Dynatrace, even when the namespace is deployed, tagged correctly, and actively receiving messages.
The usual cause is that the service principal holds only the Azure Event Hubs Data Receiver role. That role grants data-plane access to consume messages, but no control-plane read, so it can't satisfy discovery on its own.
Typical signs:
- The Azure connection status is
Healthy, and Azure Monitor metrics ingest normally. - The Logs and events tab shows
Not deployedwith 0 forwarders for the affected region. - In Azure, the Event Hubs namespace shows incoming messages but zero outgoing messages.
- Connection logs contain no related records.
Solution:
- Verify both required roles. For details, see Azure permissions. Check
Monitoring Readerfirst, and include inherited assignments so that a role granted at management group scope is reported. - If
Monitoring Readeris missing, assign it at subscription or management group scope covering the Event Hubs namespace. - Confirm the namespace carries the
managed-byanddt-log-ingest-activatedtags described in Onboard Azure regions, and that the tags are applied to the namespace itself rather than to its resource group. - Allow up to five minutes for the next discovery cycle, then recheck the Logs and events tab.
A region shows "Not deployed" because tag-based filtering excludes the Event Hubs namespace
This symptom occurs when your Azure connection has tag-based filters configured, and the Event Hubs namespace doesn't match them. Tag-based filters apply to every Azure resource Dynatrace scans, including the Event Hubs namespace used for log and event ingestion. An include filter that the namespace doesn't match excludes it from topology, and discovery fails even though the namespace carries the tags in Event Hubs requirements and receives messages. The namespace already carries managed-by: dynatrace, so adding that tag to Include filters keeps it in scope without changing which of your own resources are monitored.
Typical signs:
- The Azure connection status is
Healthy, and Azure Monitor metrics ingest normally. - The Logs and events tab shows
Not deployedwith 0 forwarders for the affected region. - In Azure, the Event Hubs namespace shows incoming messages but zero outgoing messages.
- Verify the Monitoring Reader role confirms the role is assigned, which rules out the cause in the preceding section.
Solution:
- Check whether your connection has tag-based filters turned on with at least one entry in Include filters.
- Add the tag
managed-by:dynatraceto Include filters, then select Save. If you use Exclude filters, confirm that none of them matches the tags on the Event Hubs namespace. - Allow up to five minutes for the next discovery cycle, then recheck the Logs and events tab.
The managed-by:dynatrace filter uses one of the five include filters. Alternatively, tag the namespace with a tag that's already in your Include filters. Connections that use only exclude filters are unaffected, unless an exclude filter matches the tags on the namespace.
My existing Event Hubs namespace isn't discovered
If you onboarded an existing namespace rather than deploying the ARM template, work through the following causes in order. All of them are silent failures—Dynatrace doesn't find the namespace, so no error is raised.
Solution:
- Tags on the wrong resource. Confirm
managed-by: dynatraceanddt-log-ingest-activatedare applied to the Event Hubs namespace itself, not to its resource group. Resource group tags are not inherited for discovery. - Wrong monitoring configuration ID. Confirm the
dt-log-ingest-activatedvalue matches the Monitoring configuration ID shown in your connection Overview. A namespace can only serve one connection. For details, see One Azure connection per namespace in Namespace considerations. - Event hub names don't match. If your event hubs aren't named
dt-logs-evhanddt-events-evh, you must add thedt-azure-logs-eh*ordt-azure-events-eh*namespace tags with your actual event hub names. For details, see Event Hubs requirements. - Missing control-plane read role. Confirm the service principal holds
Monitoring Readerat subscription or management group scope covering the namespace. For details, see Azure permissions.
Allow up to five minutes after any change, then recheck the Logs and events tab.
A missing dynatrace consumer group and a Basic SKU namespace don't prevent discovery. In both cases Dynatrace falls back to the $Default consumer group and raises a system event. For details, see Reserved consumer group in Namespace considerations.
Event Hubs receives messages but no logs appear in Dynatrace
If the region shows Deployed and a forwarder is registered, the namespace has been discovered—the problem is with consumption rather than discovery.
Solution:
- Confirm the
Azure Event Hubs Data Receiverrole is assigned at the resource group scope for each deployed region. For details, see Verify the Azure Event Hubs Data Receiver role. - Confirm the
dynatraceconsumer group exists on both event hubs (dt-logs-evhanddt-events-evhby default, or your own names if overridden) and that nothing else consumes from it. For details, see Reserved consumer group in Namespace considerations. - If you share an event hub with other workloads, confirm they publish in the schemas Dynatrace expects. Events that don't conform are dropped without being ingested. For details, see Event schema requirements when sharing in Namespace considerations.