What's new in Dynatrace SaaS version 1.319
- Release notes
- 10-min read
- Rollout start on Jul 15, 2025
This page showcases new features, changes, and bug fixes in Dynatrace SaaS version 1.319. It contains:
Application Observability
Now available at no cost: analyze logs and events in context in Distributed Tracing, Kubernetes, Clouds, Infrastructure and Operations, and Services apps
Showing relevant data in context is one of the core strengths of Dynatrace. To deliver more insights and improved experience, we now provide telemetry access in the  Distributed Tracing,
 ") Kubernetes,
Kubernetes,  Clouds,
  Infrastructure & Operations, and
  Services apps to every user free of charge.
-
You can view related logs attached to a distributed trace while investigating performance issues or doing other analysis in
Distributed Tracing without incurring query charges. For advanced log analysis, use the Logs app.Distributed Tracing
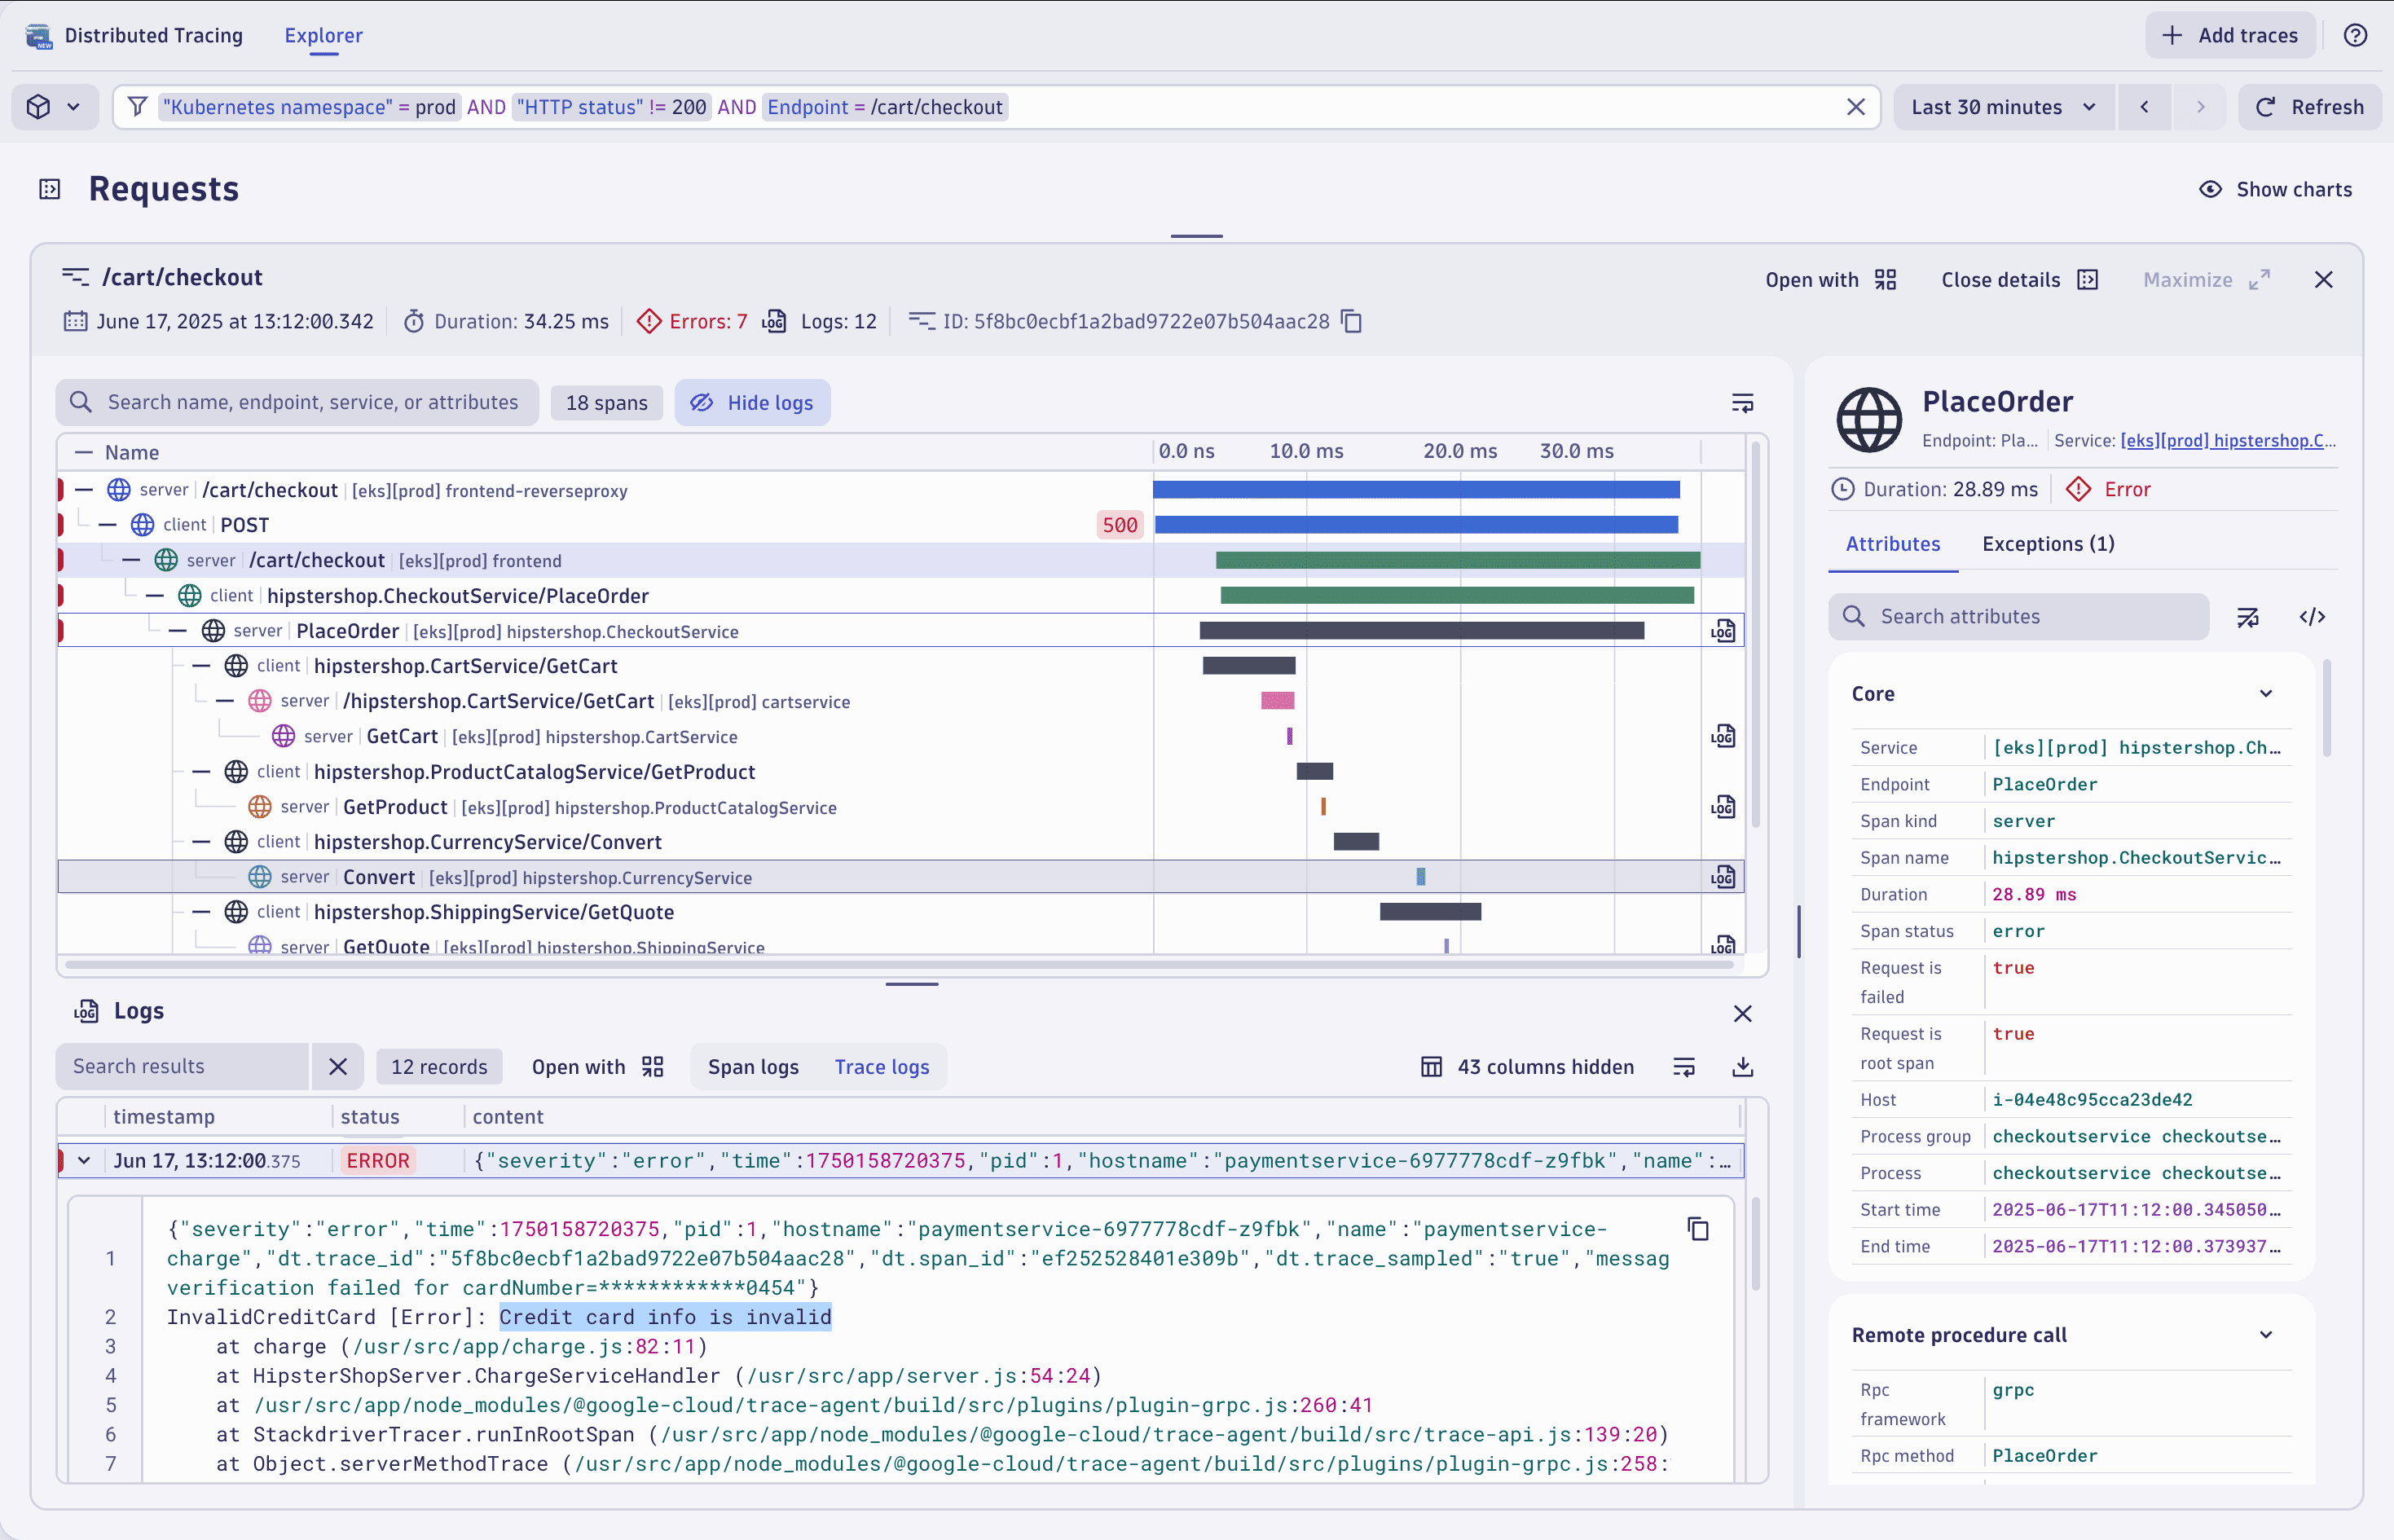 Example free telemetry access in apps: Distributed Tracing
 -
Similarly, you now see related logs and important events in the context of a Service, Kubernetes object, Cloud service, Host, and Process at no cost in the
Services, Kubernetes, Clouds, and Infrastructure & Operations apps. This allows you to examine issues by reviewing recent log lines. For more advanced analytics needs, use the Logs app.Kubernetes
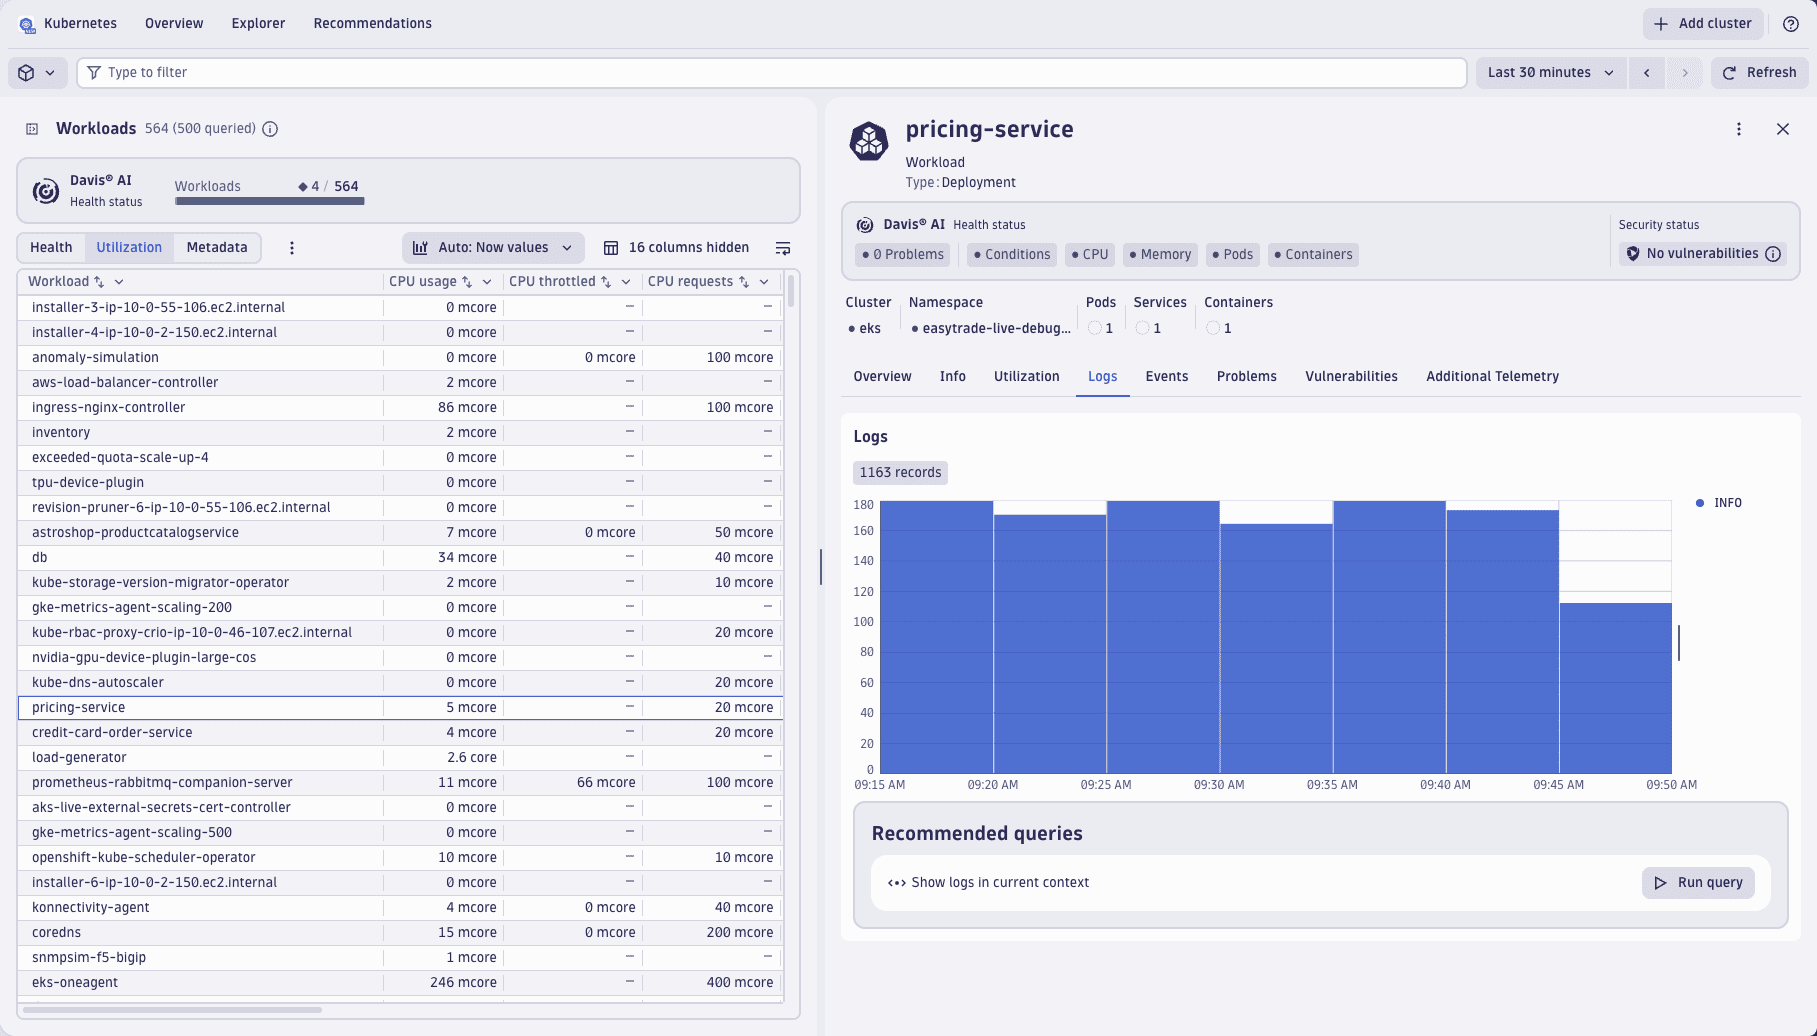 Example free telemetry access in apps: Kubernetes
Services
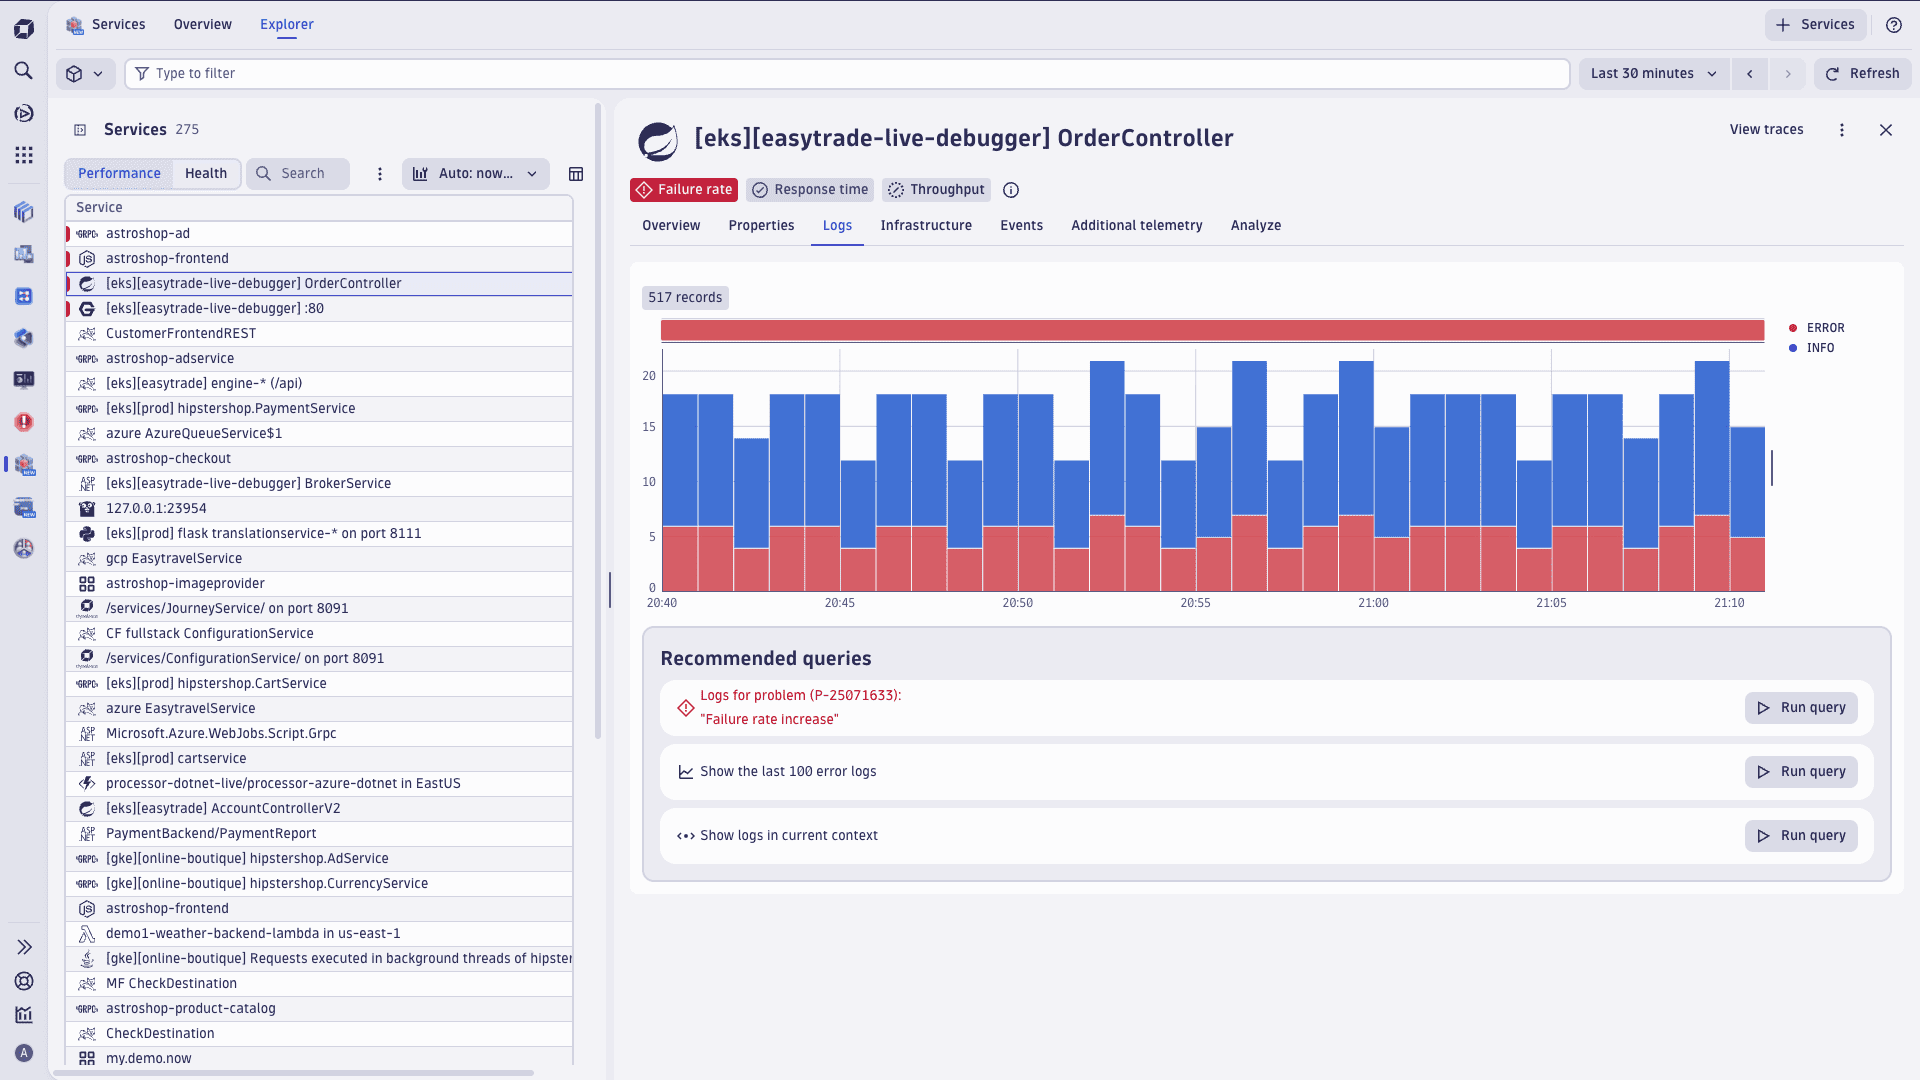 Example free telemetry access in apps: Services
Infrastructure & Operations
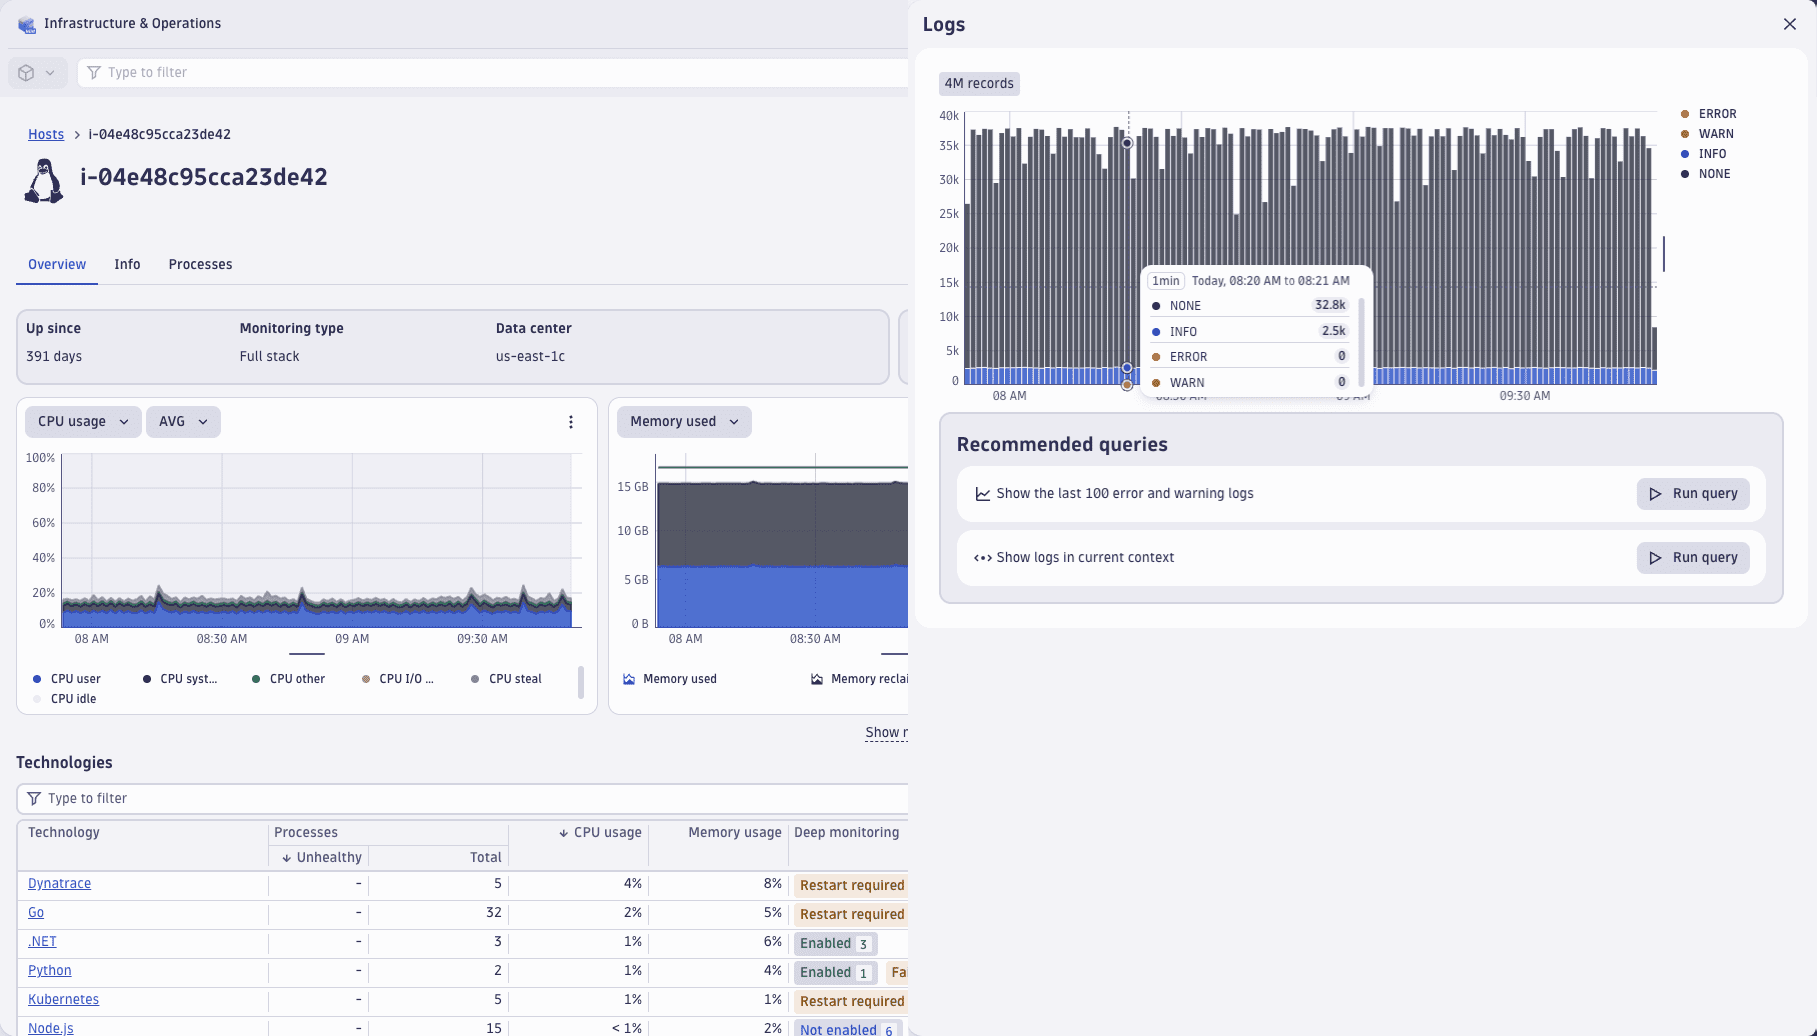 Example free telemetry access in apps: Infrastructure & Operations
Clouds
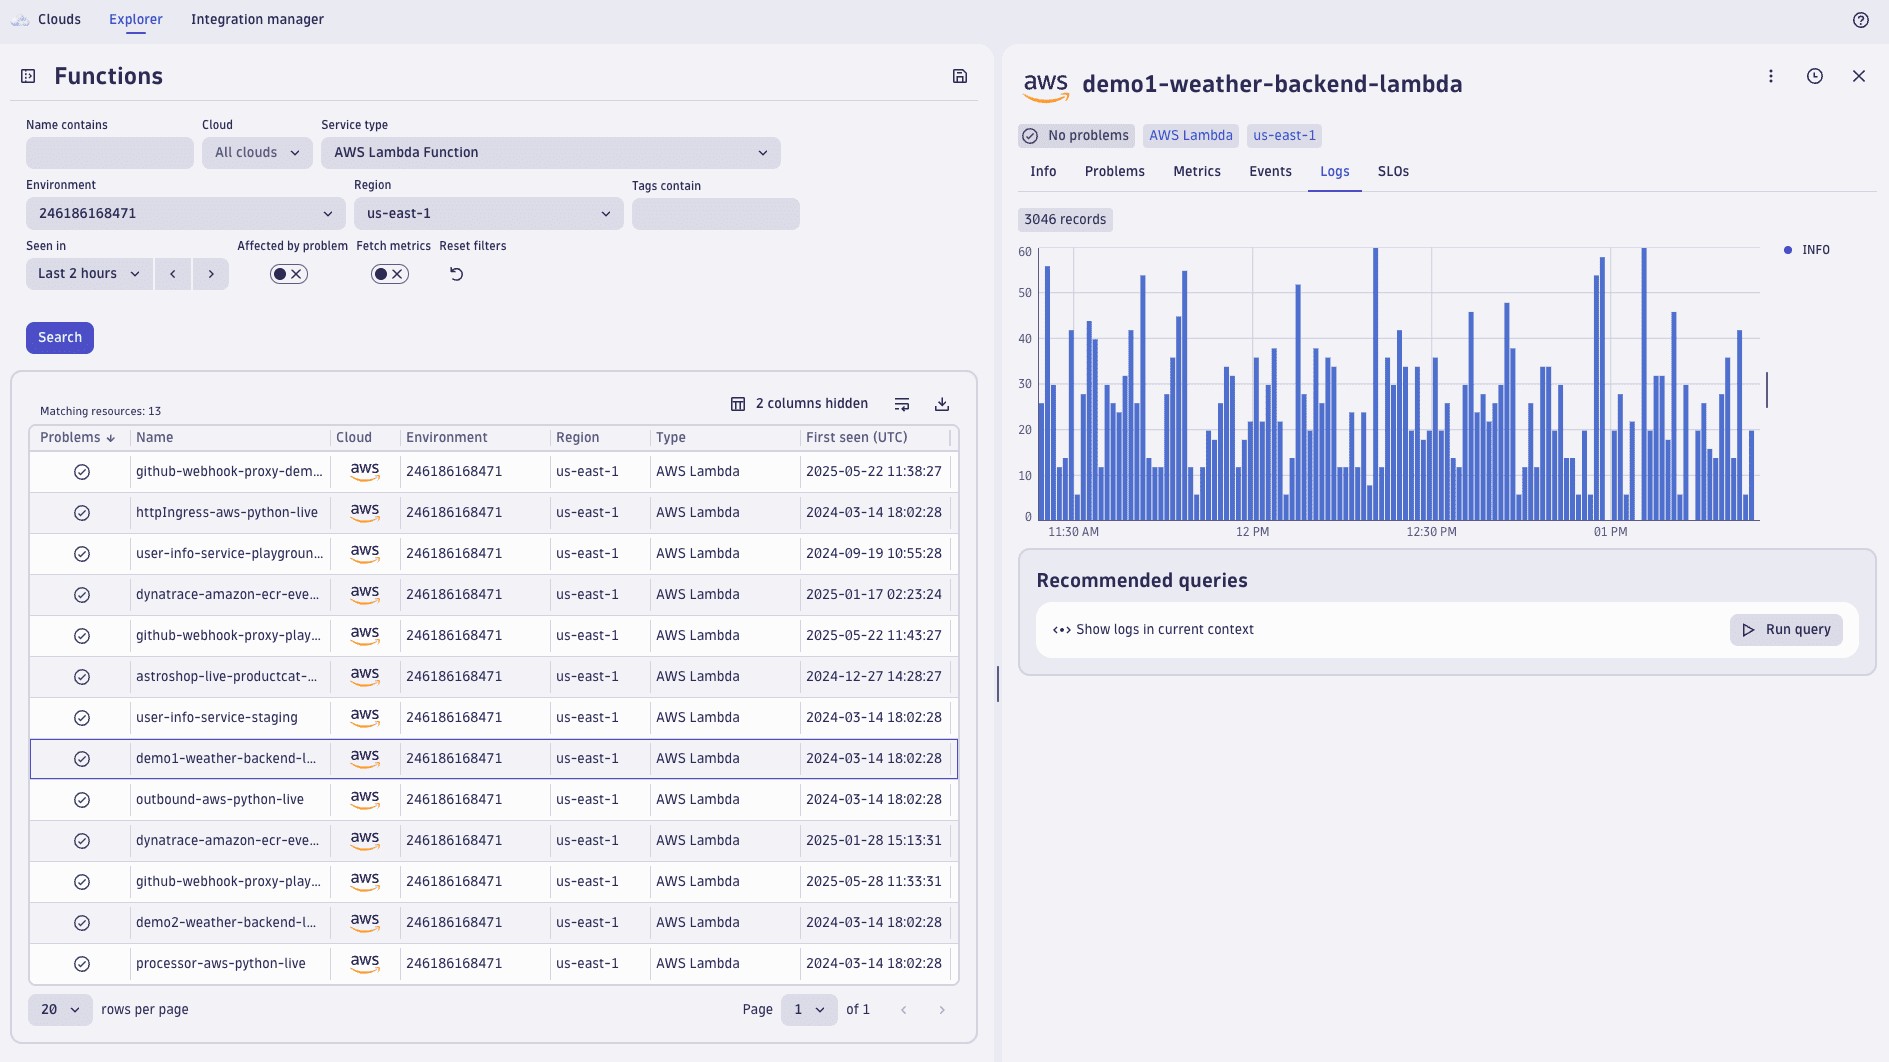 Example free telemetry access in apps: Clouds
Feature updates
Account Management | Subscriptions and Licensing
Improved process for purchasing Dynatrace Platform Subscriptions
This release introduces a significantly improved process for purchasing Dynatrace Platform Subscriptions through private offers on the AWS Marketplace.
The new interface and workflow allows you to link your Dynatrace Platform Subscription with an existing Dynatrace account or generate a new Dynatrace account.
For details, see AWS Marketplace private offer.
Software Delivery
See how to upgrade to the new SLO experience
The new Upgrade from Service-Level Objectives Classic to Service-Level Objectives documentation describes the advantages of upgrading your SLO experience by switching to  Service-Level Objectives, and shows you how to create new SLOs based on existing classic SLOs.
Infrastructure Observability | Kubernetes
Migrate Kubernetes classic metrics to Grail
Dashboards and metric events based on classic Kubernetes metrics can now be upgraded to Grail metrics. Both upgrade processes now also include Kubernetes classic metrics, which are migrated to their Grail counterpart.
- For details on upgrading dashboards, see Upgrade from Dashboards Classic to Dashboards
- For details on converting metric events, see Transform a metric event configuration
Note: There may still be metrics that can't. For those metrics, a message in the dashboard offers a link to the Kubernetes metrics migration guide, which provides clear guidance on migrating your metrics.
Application Security
Contextualize logs with timeseries data in Investigations
With this release, you can now add timeseries context to your log data in  Investigations.
For example, suppose you have fetched error logs and would like to see the CPU consumption at the time of an error.
Right-click the event, select View performance metrics, select the dimension for which you would like to see the metrics (for example, Kubernetes container), and select the metric type (for example, CPU usage).
A metrics chart is created visualizing the container CPU usage around the time of the error.
Platform | DQL
Match data flexibly with the ~ operator in DQL
The ~ string matching operator introduced with the search command is now supported across all DQL expressions, including the filter command.
The ~ operator performs a case-insensitive search for a string token. It is a simple and powerful addition to existing string-matching functions like matchesPhrase() and contains().
The ~ operator is particularly valuable for filtering, where you can:
- Apply flexible matching to any string field, helping you build powerful, precise queries that adapt to your data structure and investigation needs.
- Match across data types to perform deep searches, including in arrays and nested records.
- Use wildcards and simple syntax to filter unstructured or semi-structured data.
For example, the ~ operator can now be used in the filter command:
fetch logs| parse content, "IPV4:ip LD HTTPDATE:time ']' LD:text"| filter text ~ "setup.php"
To learn more, see DQL operators.
Infrastructure Observability | Extensions
PAT can be used for Snowflake extension
You can now select a Programmatic Access Token (PAT) instead of using a password for the Snowflake database extension.
Infrastructure Observability | Extensions
Integrate Credential Vault with your SQL Server extension
Credential Vault integration with your SQL Server extension enables you to save and use NTLM and Kerberos authentication saved in the credential vault.
Platform | Settings
Default entries added to OTLP metrics ingest attribute deny list
Starting with Dynatrace version 1.319, the OTLP metrics ingest attribute deny list will contain a handful of high-cardinality attributes by default.
- Items that were previously added to the deny list manually won't be changed.
- Attributes that were previously added to the allow list manually will be ignored in this migration, and not added to the deny list.
Infrastructure Observability | Hosts
Added data caching for the host's additional system info
The host's additional system info will now be gathered only once during OS Agent runtime.
Platform | Notebooks and Dashboards
Table is now default visualization in Notebooks and Dashboards
The table visualization is now the default for all data types you query in  Dashboards or
  Notebooks, such as logs, events, and entities.
The only exception is if a query returns time-series data, in which case a line chart is automatically displayed.
Of course, you can manually select any of the wide range of available visualizations as before.
Platform | Notebooks and Dashboards
Download raw results as CSV in Notebooks and Dashboards
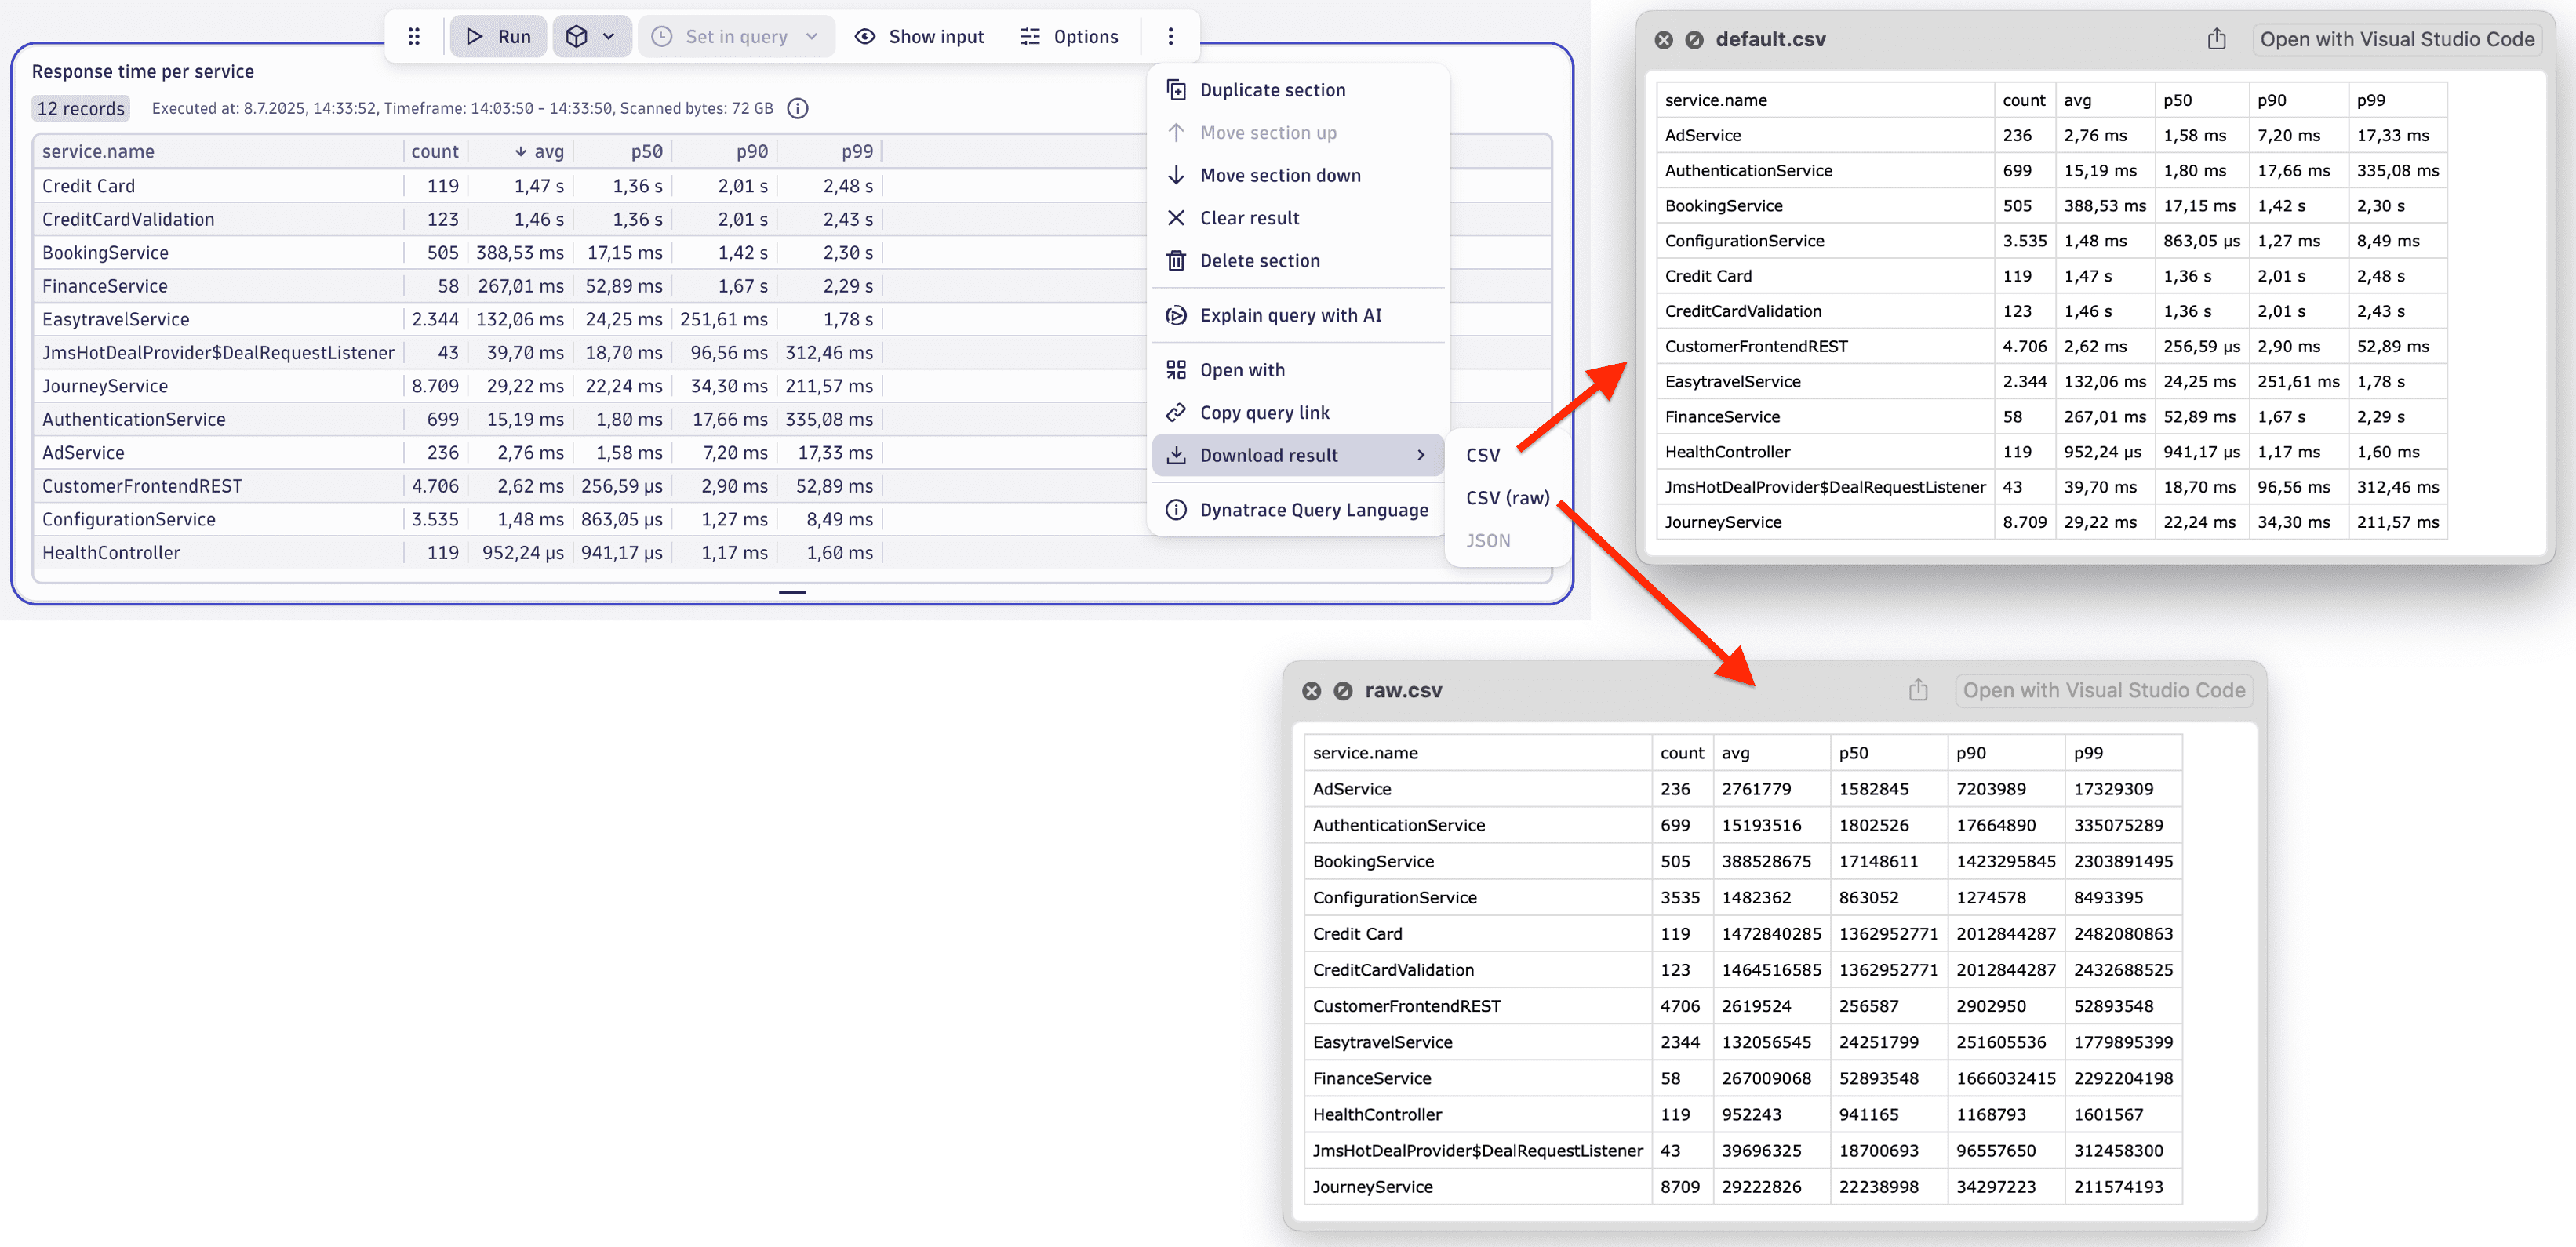
The table visualization now offers a Download result > CSV (raw) option next to Download result > CSV.
- If you need the complete unformatted data, use the Download result > CSV (raw) option to download a CSV containing the raw query result.
- If you need table formatting (such as visible columns and unit formatting), use the Download result > CSV option.
Platform | Notebooks and Dashboards
Default truncation for chart legends changed to "end" in Notebooks and Dashboards
In Dashboards and Notebooks, the default truncation for chart legends is now "end" instead of "middle". You can adjust this via the Legend and tooltip settings in your dashboards and notebooks.
Application Security | Vulnerabilities
Removed cluster- prefix in compliance events
For COMPLIANCE_FINDING events, the cluster- prefix has been removed from the value of the k8s.cluster.uid field. This change improves consistency and simplifies cluster identification across different data sources.
This update is visible only when both of the following conditions are met:
- ActiveGate version 1.319+ (earlier versions will continue to display the prefix)
- KSPM is enabled and configured (for instructions, see Kubernetes Security Posture Management)
Platform | Settings
Security context for settings access control
You can now use a new condition in IAM statements to manage access to entity settings based on their security context attribute. For an example, see Permissions and access in the settings documentation.
Fixes and maintenance
Resolved issues in this release
- Fixed an issue where in some cases OS Agent could shortly switch to a tenant-level Declarative Process Grouping configuration when the Dynatrace cluster restarts, leading to potential process availability alerts and metrics loss. (OA-49022)
- Fixed unnecessary escaping of new line for cURL(cmd) in Settings code snippets. (PAPA-25801)
- OpenPipeline ingest endpoints for events now respond with
content-type: text/plainto improve usage from Notebooks and Workflows. The OpenPipeline ingest endpoints for events-related data types respond with HTTP 202 status and empty body when data is accepted by OpenPipeline. The response formerly set thecontent-typeheader toapplication/octet-streamand set thevaryheader toOrigin, which caused issues on the HTTP client used in Dynatrace Workflows and Notebooks. With this release, we have slightly changed the behavior of the API so that those endpoints can be easily called from Workflows and Notebooks. After the change, the content-type is set totext/plainand there should be novary: Originheader at all. This change should not impact advanced HTTP clients, as thecontent-lengthof those responses was and still is always0. (PPX-5678) - Since upgrading to the latest Dynatrace doesn’t make sense on Managed, the upgrade dashboard banner above the dashboards list is no longer displayed. (PAPA-26302)
- Fixed an issue that causes metrics ingested by old OneAgent versions to be rejected in Grail if OpenPipeline is enabled. (GRAIL-41725)
- Fixed an issue that caused some process groups to not show up in the process group override tab for certain sections in Deep monitoring settings. (APPOBS-8070)
- Previously, the tenant URL was not correctly communicated from the cluster to OneAgents and environment ActiveGates in PrivateLink-enabled environments for Live Debugger. Now, the cluster correctly reports the tenant URL to OneAgents and environment AGs for Live Debugger in PrivateLink-enabled environments. (MGD-5311)
- Fixed handling of zero-duration timeframes in the web UI (previous Dynatrace) as a 5-minute time range, which is the minimum valid value in the time selector. (PAPA-26299)
Dynatrace API
To learn about changes to the Dynatrace API in this release, see Dynatrace API changelog version 1.319.