Upgrade from Service-Level Objectives Classic to Service-Level Objectives
- Latest Dynatrace
- Upgrade guide
- 9-min read
We strongly recommend upgrading your Classic SLOs from  Service-Level Objectives Classic to Service-Level Objectives to maximize capabilities and benefit from the newest enhancements.
Dynatrace offers an improved experience for Service-Level Objectives (SLOs), allowing you to define tailored Service-Level Indicators (SLIs) using all available data points. This upgrade provides greater flexibility, customization, and integration with Grail.
Dynatrace provides two Service-Level Objectives application types:
-
Service-Level Objectives is our latest, Grail-powered application offering enhanced flexibility and customization options.
-
Service-Level Objectives Classic is the previous application with limited capabilities.
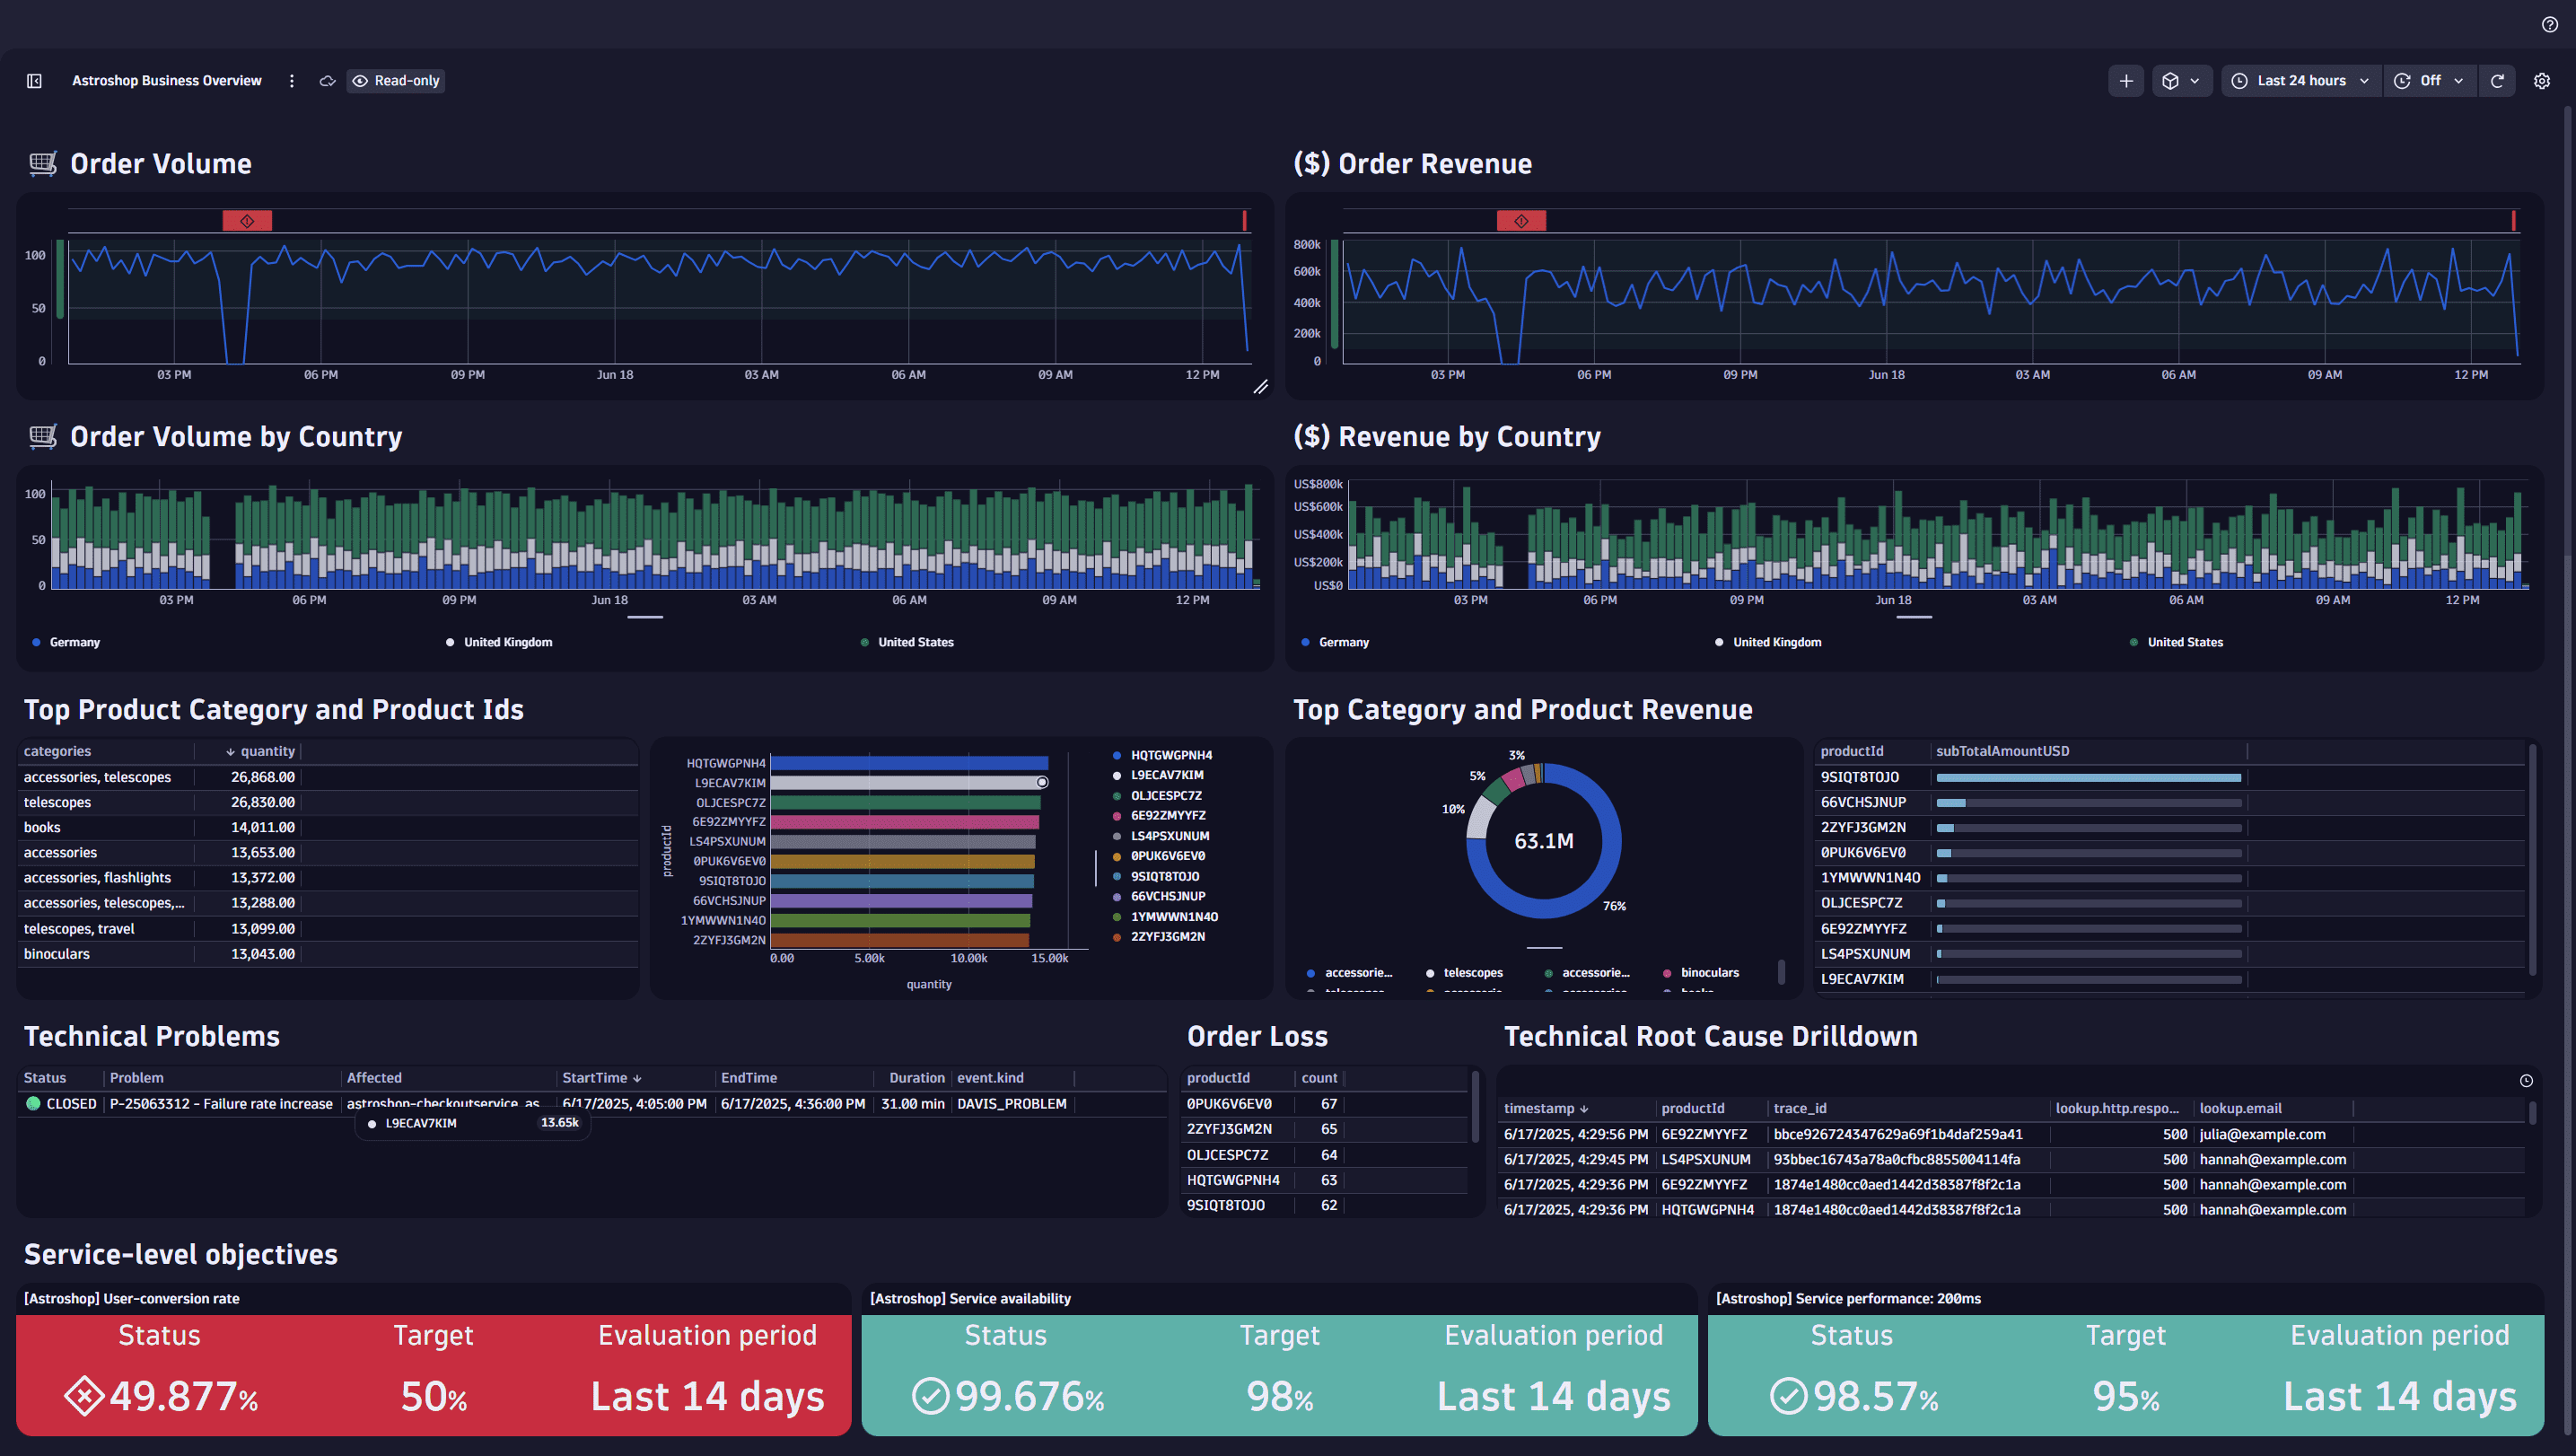
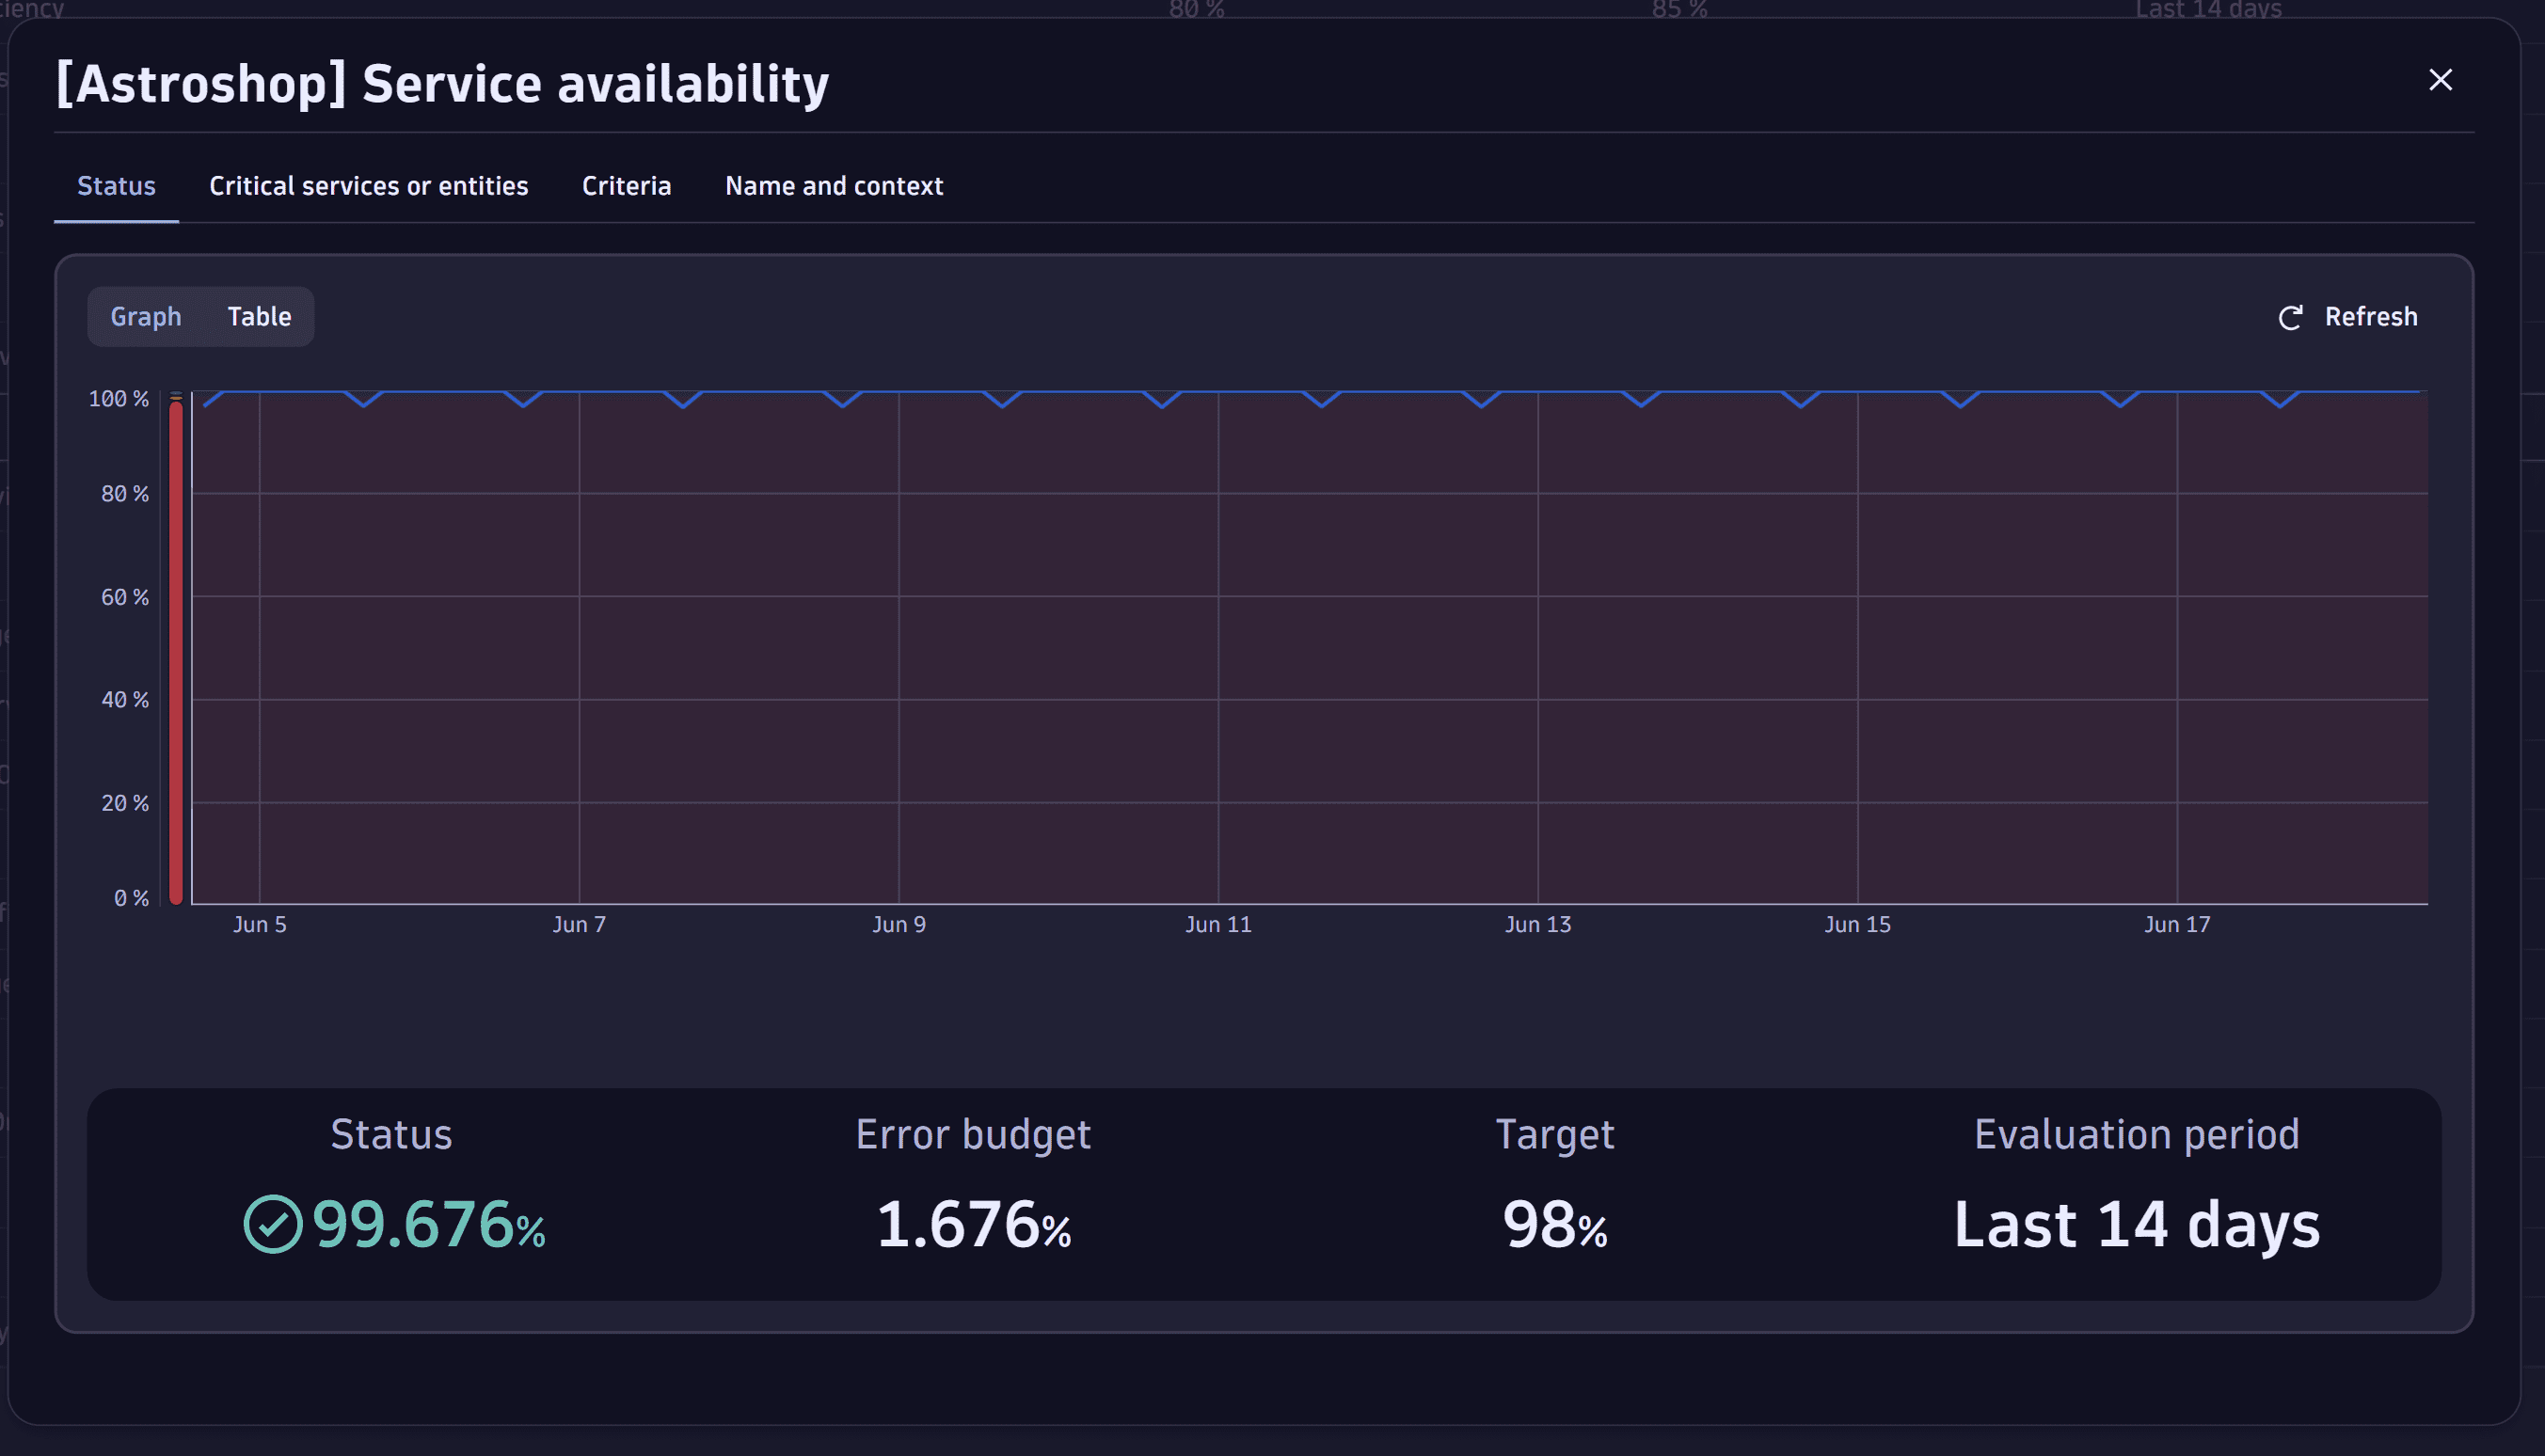
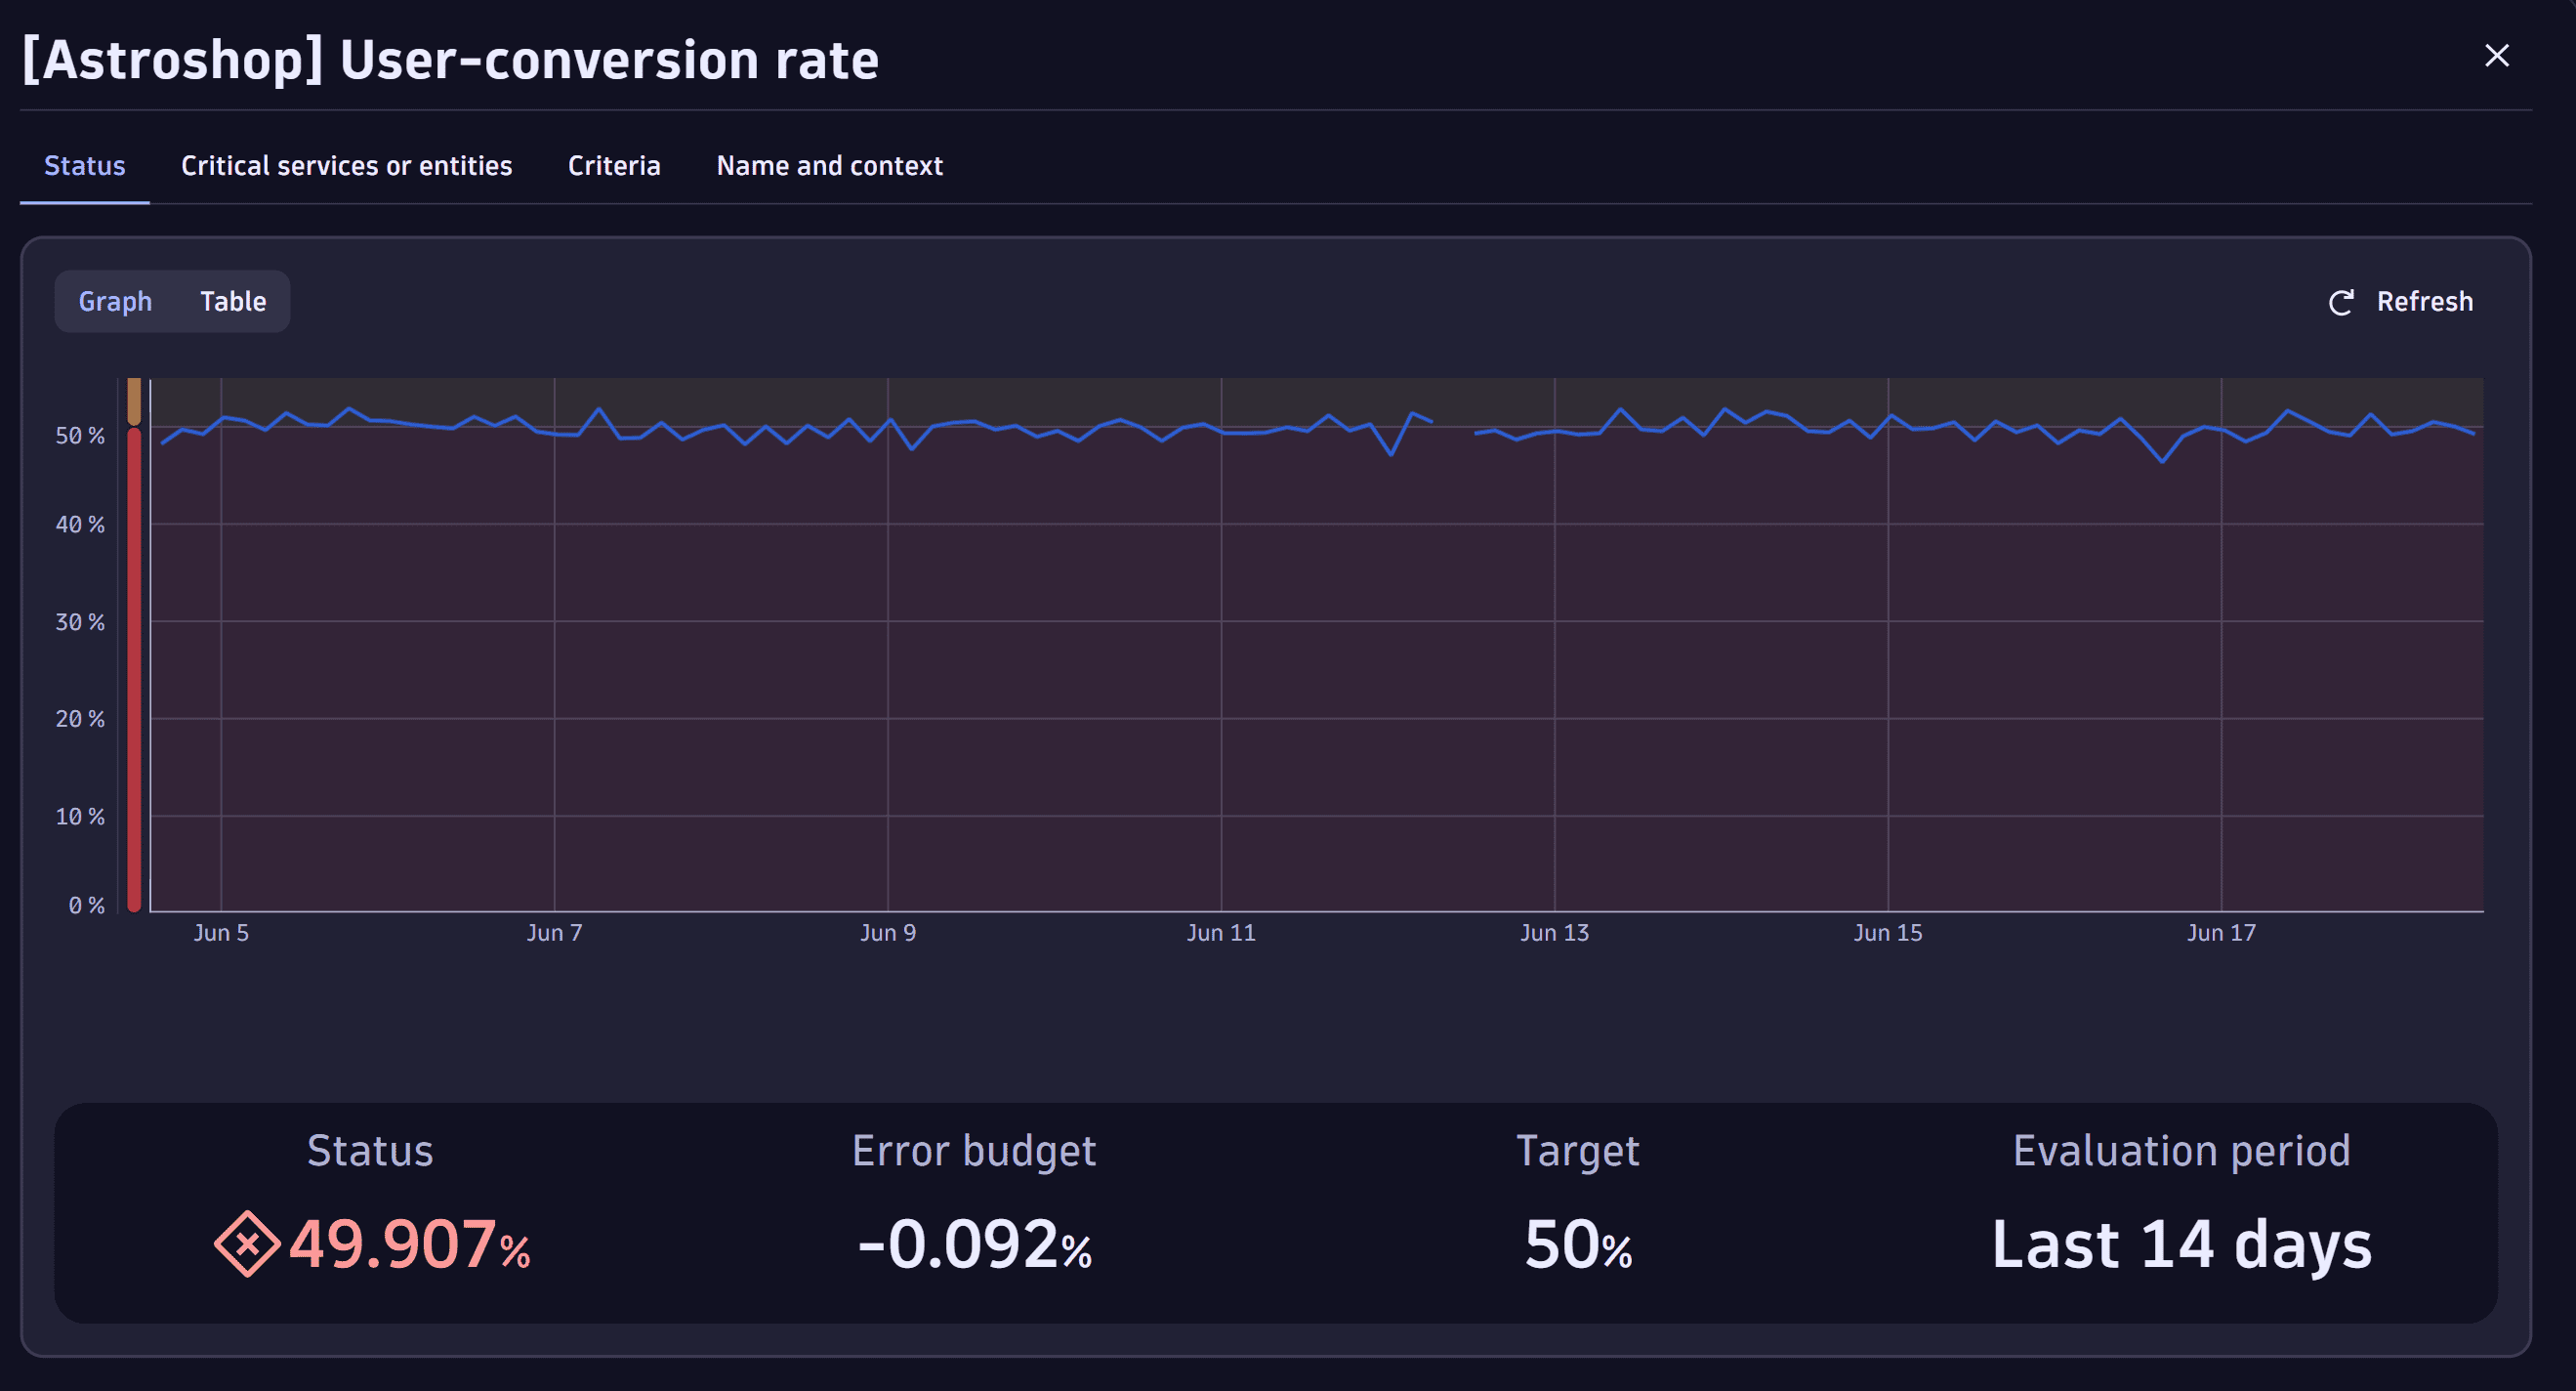
The following examples show an SLO in Service-Level Objectives and multiple SLOs in  Dashboards.
Why upgrade?
The table below highlights the new functionality and shows the many reasons you should upgrade. It compares the capabilities of SLOs in Service-Level Objectives and Service-Level Objectives Classic.
| Capability | Service-Level Objectives Classic | Service-Level Objectives | Business impact |
|---|---|---|---|
Supported input for SLI definition | Limited to built-in or custom-calculated metrics | Supporting all data types in Grail, including business events, logs, spans, and time series | SLOs allow a finer granular configuration and tailored definition of the SLI. |
Segmenting, data filtering for SLO evaluation | Management zones | Segments allow detailed filtering of the dataset used for the SLO evaluation. | |
Adding SLO tags | — | SLO tags | Add SLO tags (key-value pairs) and then use them to filter SLOs when querying them via the API. |
Customized dashboard tiles | Classic dashboard tile | New dashboard SLO tiles allow more visual customization options, including what data should be shown and colorized. An additional SLO wizard overview allows for creating and editing SLOs in | |
Integration with other Dynatrace Apps | Integrated with Dynatrace Classic Apps | Integrated with latest Dynatrace Apps |
Difference between SLO and Classic SLO
The main difference between the SLO and the Classic SLO is that the SLI in the SLO is represented as a single DQL query. The DQL query allows extensive customization possibilities, unlike metric and entity selectors in the Classic SLO.
The benefits of DQL-based SLOs are as follows:
- Use any telemetry data in Grail. For more information, see Upgrading Metrics.
- Apply custom filters and advanced options Dynatrace Query Language.
- Benefit from simplified ratio calculations for SLI.
How core SLO components are defined in SLO and Classic SLO
An SLO typically shows specific characteristics you can configure in many possible ways.
The core SLO components are:
- Service-level indicator (SLI): Time series showing percentage values (100% = ideal)
- SLO target: Threshold for success
- Evaluation period: Typically from 1 to 4 weeks
- SLO status: Aggregated result over the evaluation period
- Error budget: Acceptable deviation (100% − SLO target)
It's possible to set the following parameters:
- SLI
- What data types are needed?
- What fraction of the data needs to be considered?
- Evaluation period
- SLO target (threshold)
In Service-Level Objectives, the SLI is represented as a DQL (Dynatrace Query Language) query.
It's flexible and uses contextual data to represent the objectives.
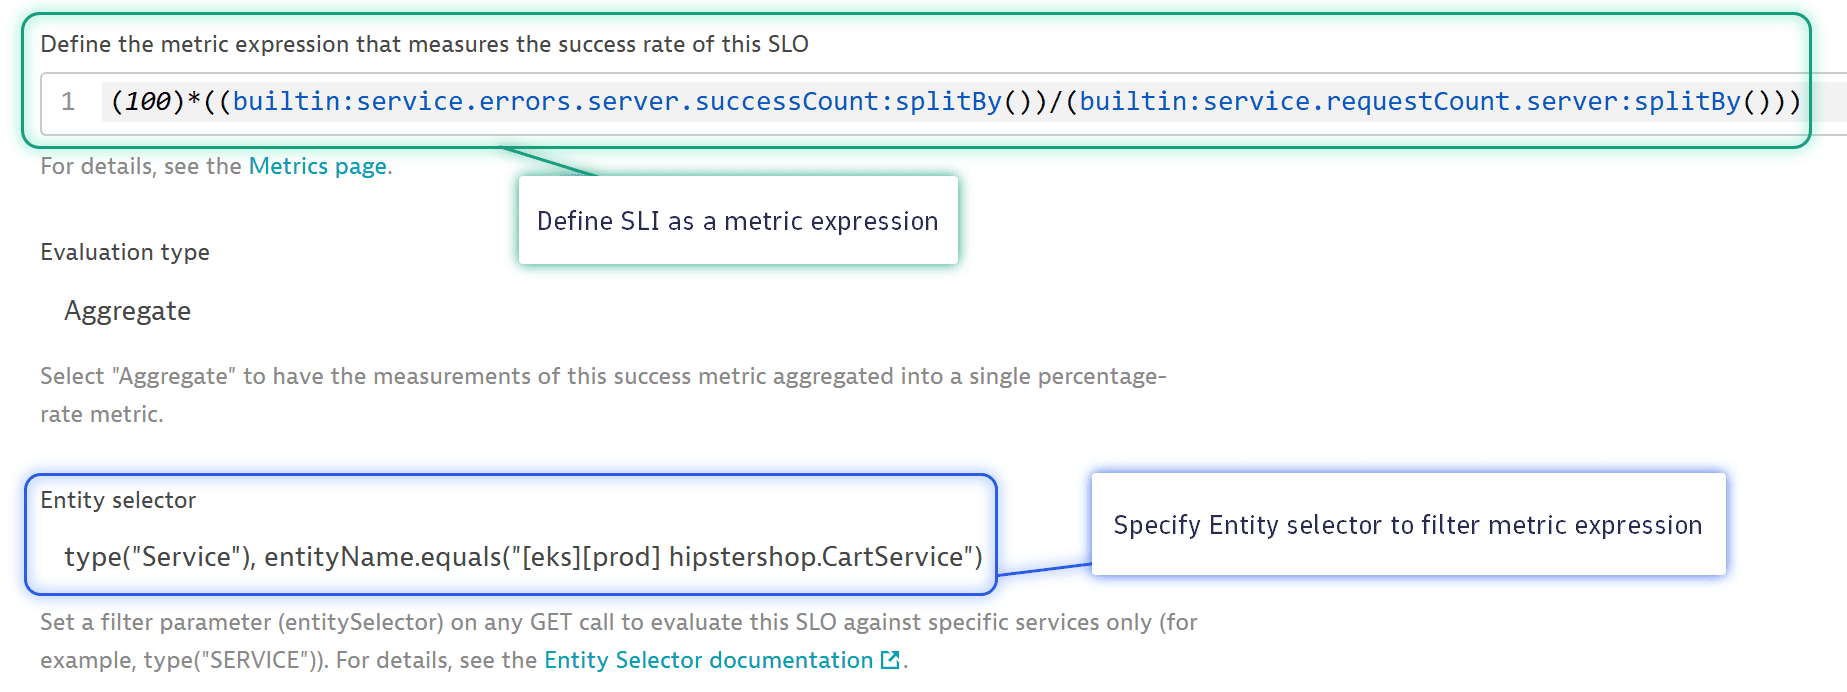
SLO Classic example using Metrics selectors
Below is an example of a Classic SLO using the classic metric selectors, similar to a DQL query.
SLO example using DQL
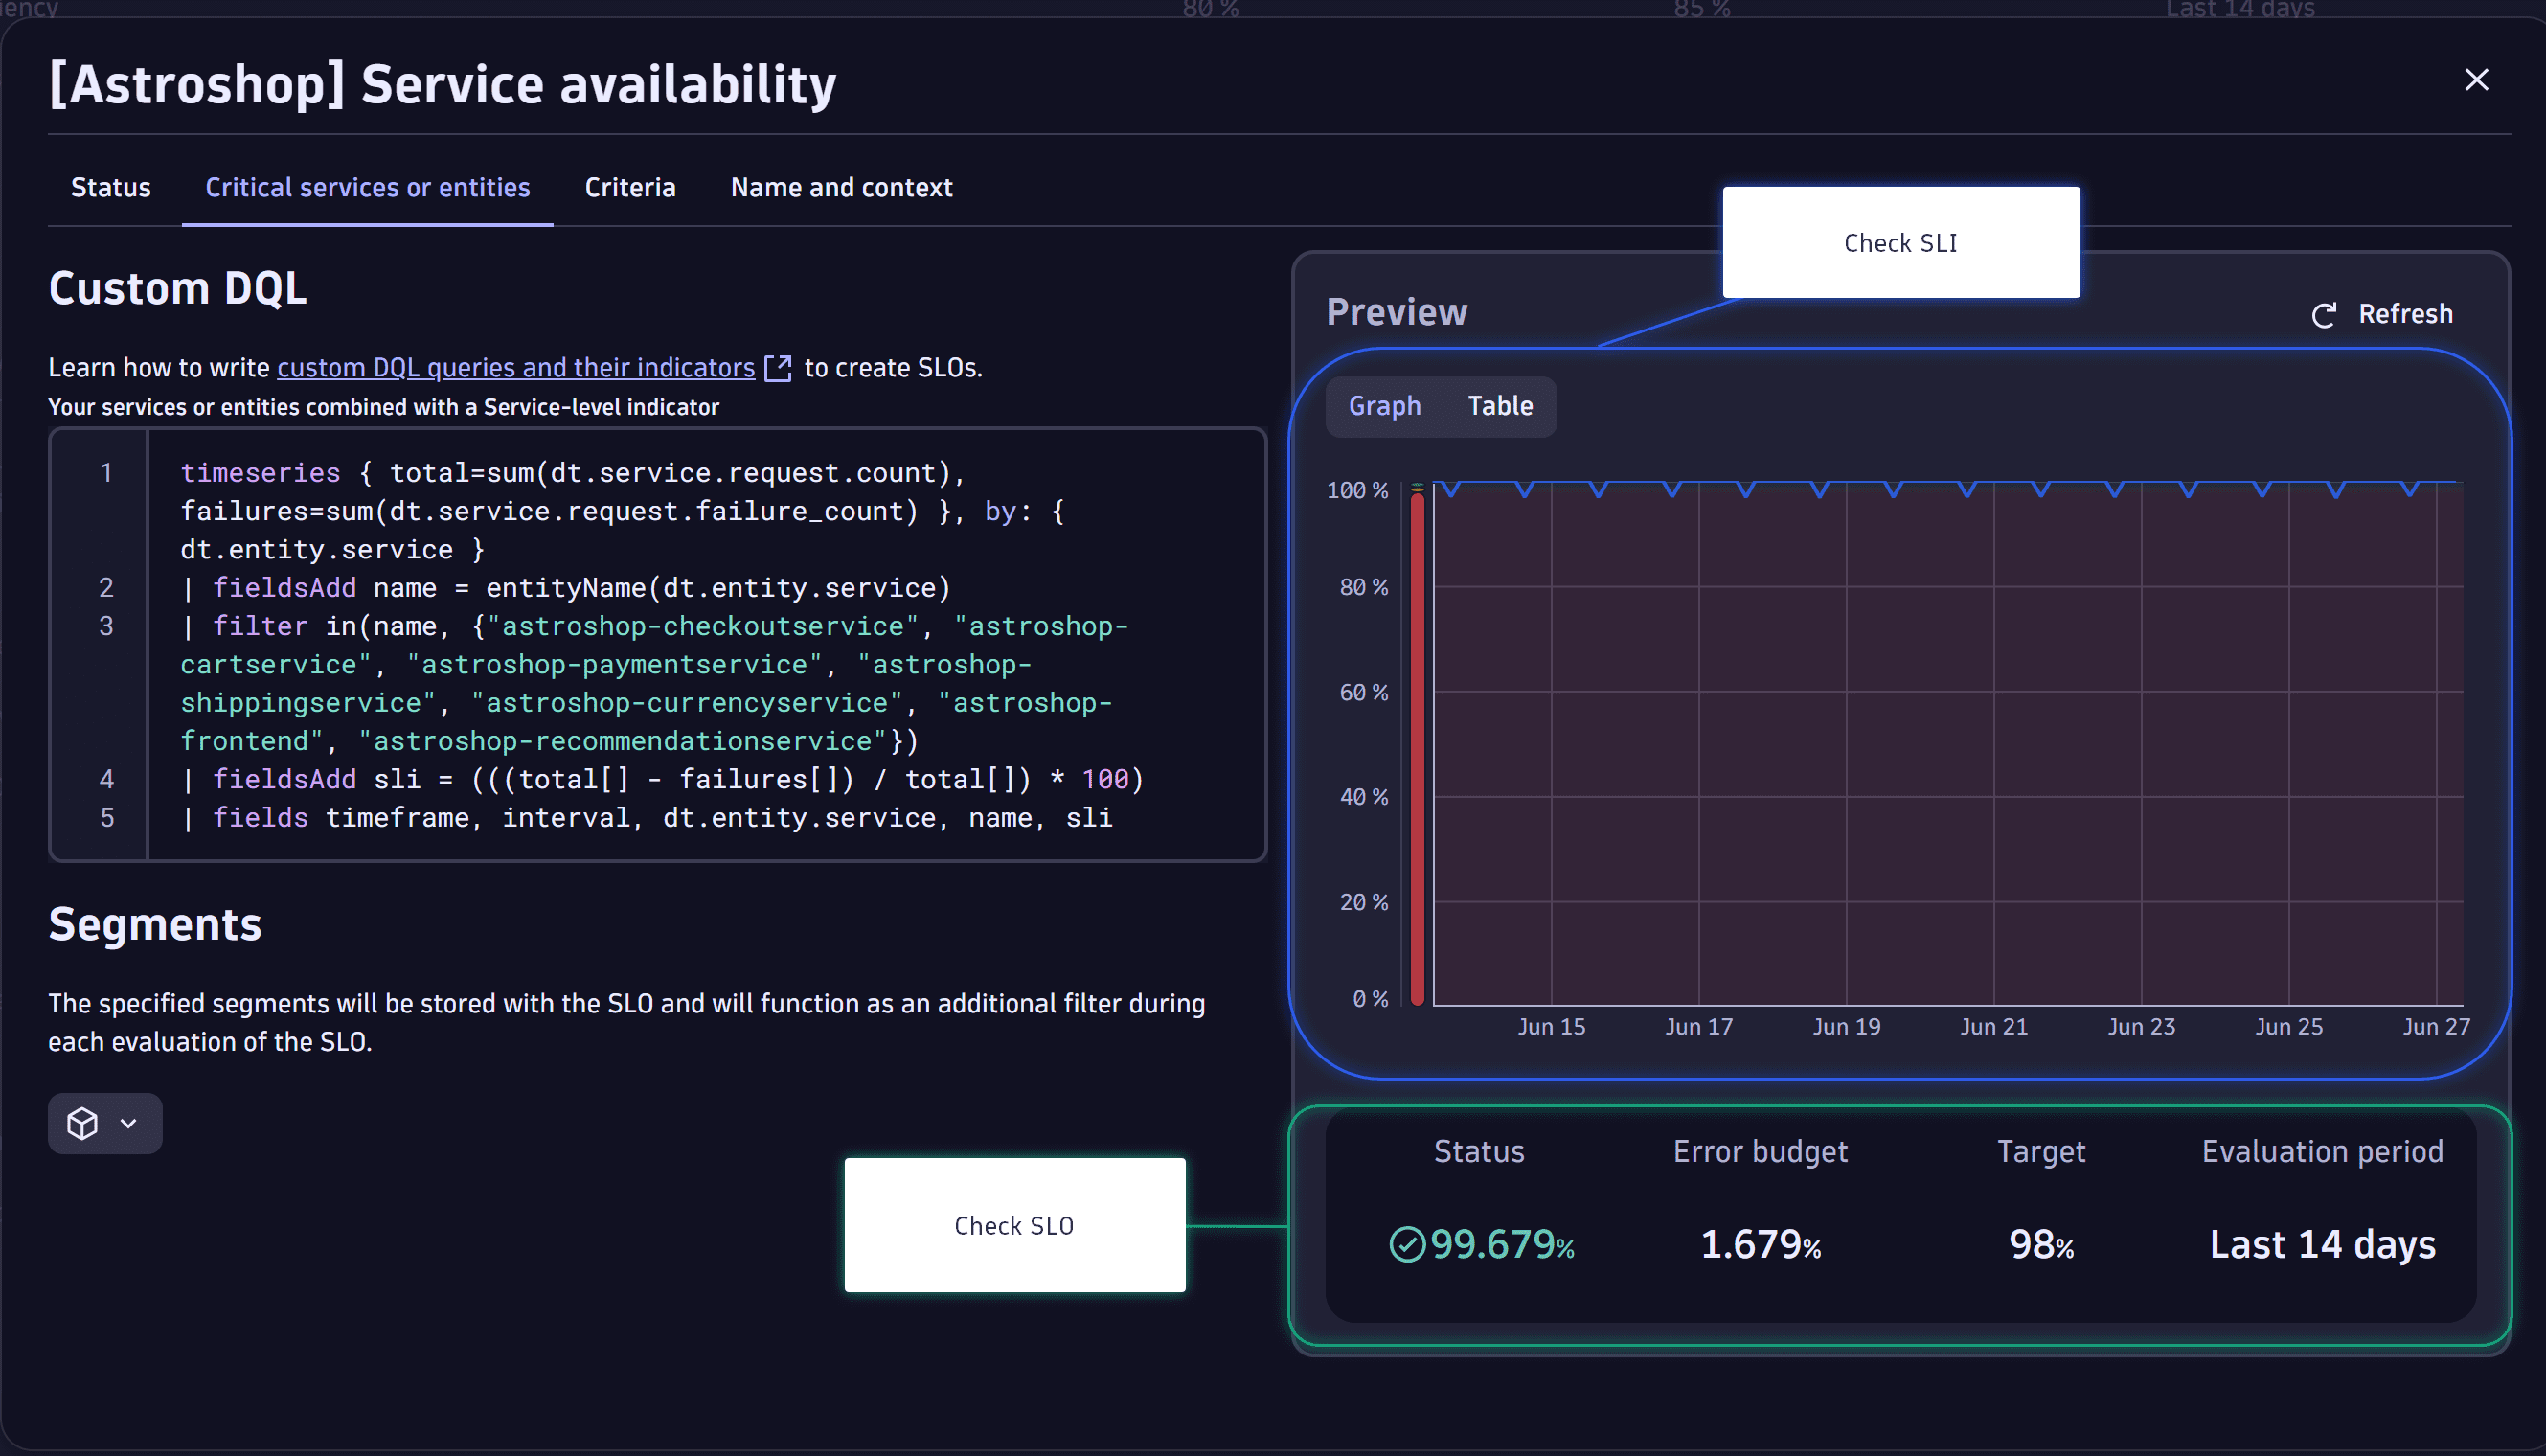
An SLO has two major parts: the Custom DQL and the Preview. In Custom DQL, you can define your DQL query. In Preview, you visualize the SLO.
Custom DQL
The SLO DQL query is structured in a certain way to define the SLO and SLI. The SLO DQL example snippet defined in the Critical services or entities tab of the SLO has the following characteristics:
-
Define the data points.
timeseries {total=sum(dt.service.request.count), failures=sum(dt.service.request.failure_count)}, -
Specify the entity scope.
by: { dt.entity.service } -
Display the information needed by using DQL filters.
| fieldsAdd name = entityName(dt.entity.service)| filter in(name, "astroshop-checkoutservice", "astroshop-cartservice", "astroshop-paymentservice", "astroshop-shippingservice", "astroshop-currencyservice", "astroshop-frontend", "astroshop-recommendationservice") -
Calculate the SLI.
| fieldsAdd sli = (((total[] - failures[]) / total[]) * 100)| fields timeframe, interval, dt.entity.service, name, sli
Preview
Check in Preview the SLO and SLI statuses.
Upgrade Classic SLOs to SLOs
To upgrade a Classic SLO to SLO
-
Map your Classic SLO metric expression to Grail.
- Check the comprehensive list in Upgrading Metrics.
- Use the Metric selector conversion guide.
For complex metric expressions, you might need to adapt the DQL queries manually.
-
Convert the entity selectors to the corresponding DQL statement. For more information, see DQL best practices.
The following table shows the typical entity selectors for Classic SLOs and their DQL equivalent.
Entity selector classic DQL representation type("SERVICE")by: {dt.entity.service}tag("myTag")| fieldsAdd tags=entityAttr(dt.entity.service, "tags")| filter in(tags, "myTag")entityId("SERVICE-XY")| filter in(dt.entity.service, "SERVICE-XY")entityName.contains/equals/in/startsWith("ENTITY-NAME")| fieldsAdd name = entityName(dt.entity.service)| filter in/contains/startsWith/endsWith(name, "ENTITY-NAME")mzId/mzNameUse Segments.
Segments aren't related to permissions or access control.
toRelationship/fromRelationshipSee the relationship mapping table in Grail: Query monitored entities in Grail.
If you use management zones for permissions and access control, see Grant access to entities with security context.
-
Enhance your SLI definition.
While you can upgrade most Classic SLOs to a one-to-one match in Grail, consider enhancing your SLI definitions by leveraging options that are not available with traditional metric expressions.
Take advantage of the new options:
- Business hours
- Key requests/endpoints in DQL
- Advanced math operations
- Use business events as leading indicators
- Add SLO tags for filtering and grouping
- Use segments for dynamic entity scope
Upgrade API integration
To automate SLO management and evaluation, use the dedicated API endpoints. Reference the table below to upgrade your API integration for Classic SLO to SLO leveraging the SLO Service Public API.
| Service-Level Objectives Classic | Service-Level Objectives |
|---|---|
Upgrade via Configuration as Code
For scalable SLO management and evaluation, use Configuration as Code overview on top of the SLO Service Public API.
To access the SLO Service Public API on your tenant
- Go to Dynatrace.
- In the platform search, type
API. In the search results, see Support resources section and Dynatrace API below it. - Select Dynatrace API to access the Dynatrace API documentation. A new page opens with the Dynatrace API definitions.
- In the upper right corner, go to Select a definition.
- From the drop-down list, choose the endpoint.
-
Configuration as Code via Terraform overview support the SLO Service Public API since v1.78.0, and the Dynatrace Terraform provider can be found
dynatrace-oss/dynatrace | Terraform Registry. -
Configuration as Code via Monaco overview supports the SLO Service Public API since v2.22.
What’s next?
An automated upgrade flow is under consideration; however, due to the highly customized nature of SLOs, a manual review is expected to deliver the best results. Use this opportunity to reassess and improve your SLIs, rather than simply copying them one-to-one.
For further optimization and guidance, contact your Dynatrace support team to maximize business impact from your service-level objectives.
 Service-Level Objectives