What's new in Dynatrace SaaS 1.348
- Release notes
- 21-min read
- Published Sep 09, 2026
- Rollout start on Oct 12, 2026
This page showcases new features, changes, and bug fixes in Dynatrace SaaS version 1.348. It contains:
Infrastructure Observability | Clouds
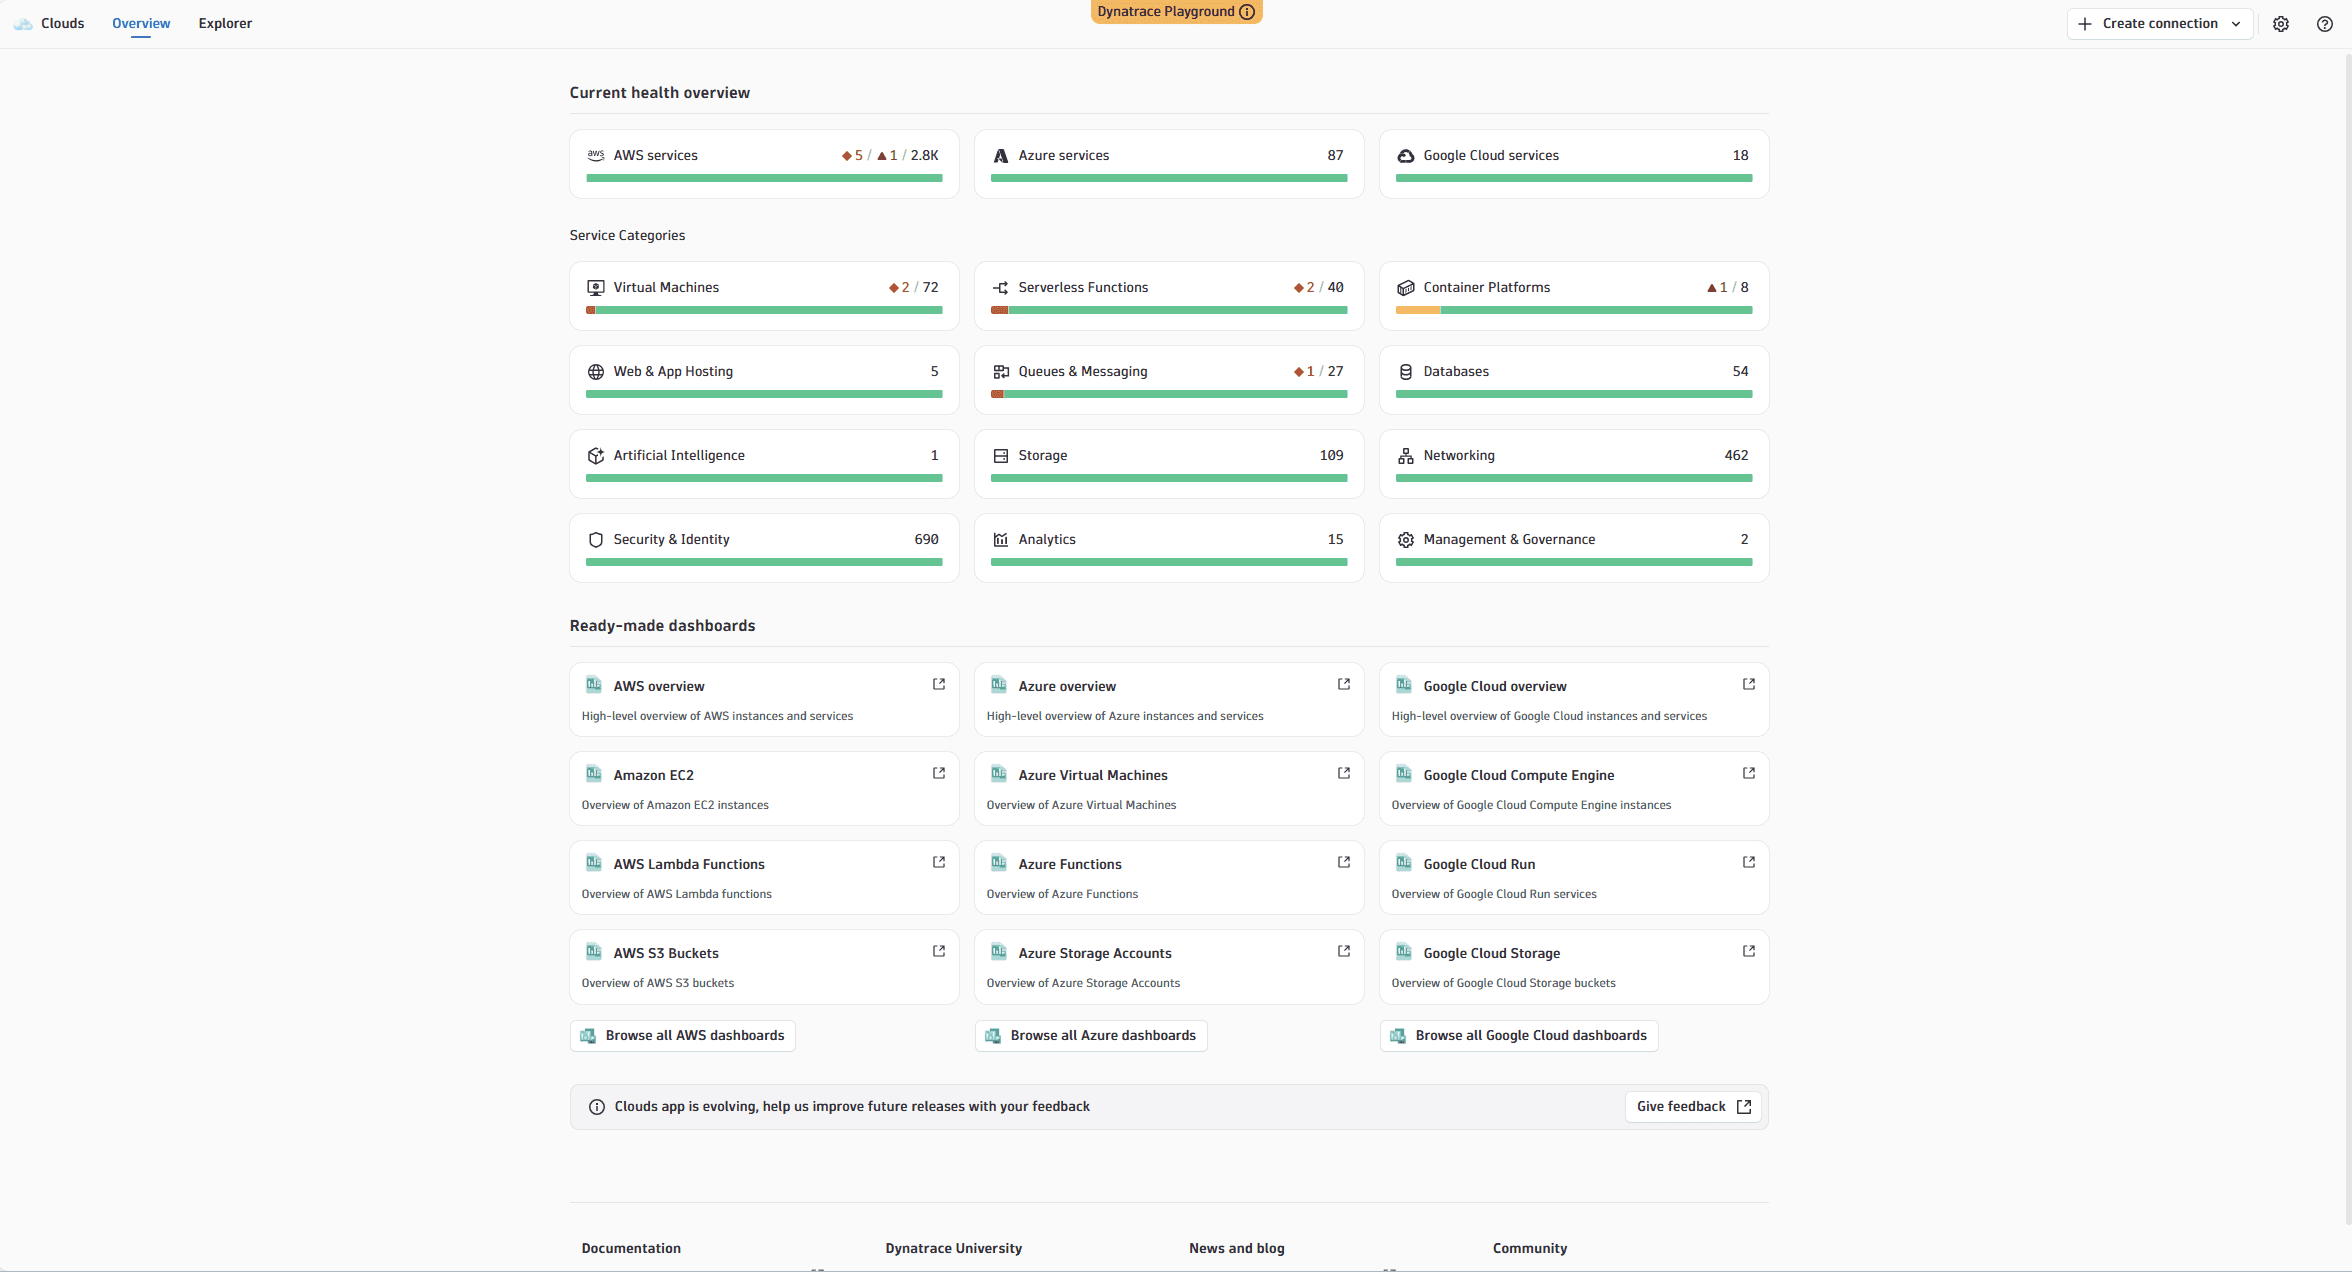
New Clouds experience for Google Cloud lets you optimize cloud operations at scale
We’ve extended the enhanced version of  Clouds to deliver deeper, actionable insights and context, greater usability, and enhanced troubleshooting for monitored Google Cloud environments.
Based on a new Google Cloud connection, metrics, logs, metadata, and topology are unified into a single AI-powered platform that delivers complete visibility and actionable insights at scale. This expanded Google Cloud capability is part of our comprehensive Cloud Ops solution that is already available for AWS and Azure, ensuring a unified experience across multiple cloud platforms.
- Opinionated insights and ready-made dashboards powered by enriched Google Cloud telemetry and cloud context help users quickly assess health and troubleshoot faster.
- Pre-configured health alerts are available for Google in Clouds. Alerts are configured directly in Clouds, where you can define them, drill down into data points, and search and filter resources.
- Broad and comprehensive Google Cloud metrics coverage gives you a complete view of your Google Cloud infrastructure by enabling you to poll any native Google Cloud platform metric for any service.
- An easy onboarding and lifecycle management experience to onboard Google projects, turn them into native Dynatrace Cloud connections, and manage them holistically from Clouds.
- A cloud-native, low-ops setup that's fully managed by Dynatrace SaaS. There’s no need to deploy ActiveGate compute resources for metric polling within your Google Cloud environment.
- A rich Google Cloud topology inventory built from regular environment scans—supplemented by near-real-time updates via GCP Asset Feed—capturing resources, their relationships, and cloud-native metadata (labels, tags, projectID). You can visualize discovered resources and their dependencies in Clouds and
 Smartscape, and leverage DQL for custom analytics.
 - Google Cloud label context is propagated across metrics, logs, and topology, so you can filter and correlate signals using the same label values you already use in Google Cloud Platform.
For details, see Clouds.
Application Observability | Live Debugger
Investigate issues faster with logs directly in your VS Code snapshot view
When you capture a snapshot with  Live Debugger in Visual Studio Code, the related log events are now available right alongside your snapshot data. No more switching to the apps to get the full picture.
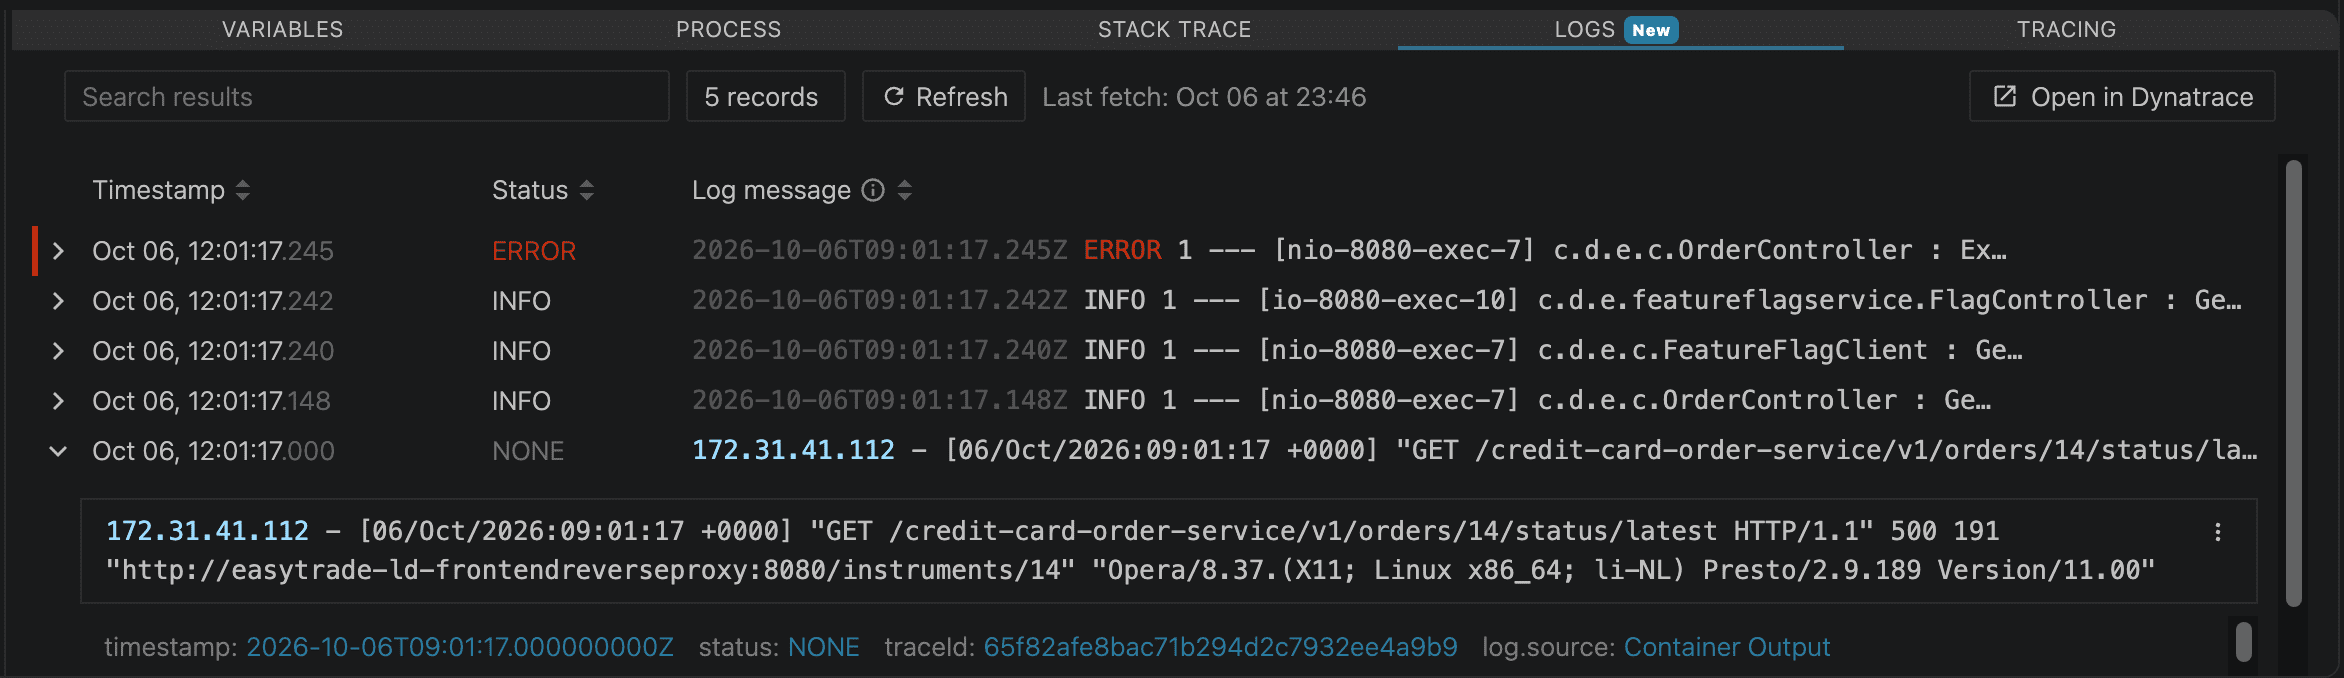
A new Logs tab appears in the snapshot detail panel, next to Variables. Logs are fetched automatically, correlated to the snapshot via trace ID, and displayed in ascending timestamp order, so you can follow the sequence of events leading up to and after the snapshot was captured.
- Logs load automatically. No query to write, no button to click: logs appear when you open the tab.
- Search across log entries with free-text filtering directly in the panel.
- Expand any log entry to view the full message and metadata as key-value pairs, with a one-click Copy option.
- Open in Dynatrace to jump to the
 Logs app with the trace ID, time window, and filters already applied. You can dig deeper without losing context.
This feature is available as part of the Code Monitoring rate card. For details, see Understand and manage Code Monitoring consumption.
Feature updates
Account Management
Workload identity federation support
Workload identity federation (WIF) lets an external workload (such as an OTel Collector, an Azure VM, a GitHub Actions job, or a Kubernetes pod) call the Dynatrace API using a short-lived token from its own identity provider.
Dynatrace resolves that token to a service user through a configured trust policy, so no Dynatrace client secret or platform token is ever stored alongside your workload, baked into an image, or saved in a CI secret.
You configure WIF through the Account Management API.
For details, see Workload identity federation.
Account Management | Subscriptions and Licensing
CSV Download for DPS prior 2023
For customers who have a Dynatrace Platform Subscription (DPS) license signed prior to April, 2023, you can now export your consumption history, as a CSV, directly from Account Management. Go to History, find the subscription labeled DPS (not DPS: Regular), select Details, and request your usage report. You'll receive a download link by email.
The export covers the full duration of your consumption for DPS licenses prior to 2023, with daily consumption data per SKU and environment, giving you a reliable record for auditing, reporting, and contractual purposes.
AI Observability
Static topological knowledge enrichment enabled by default
Static topological knowledge enrichment is now enabled by default. Dynatrace automatically enriches incoming data with topology context derived from static configuration, improving entity resolution and dependency mapping without requiring manual setup.
Application Observability
Failure Awareness in Exception Analysis
Exception analysis now shows failed requests for charts, lists, and stack traces.
Application Observability | Distributed Tracing
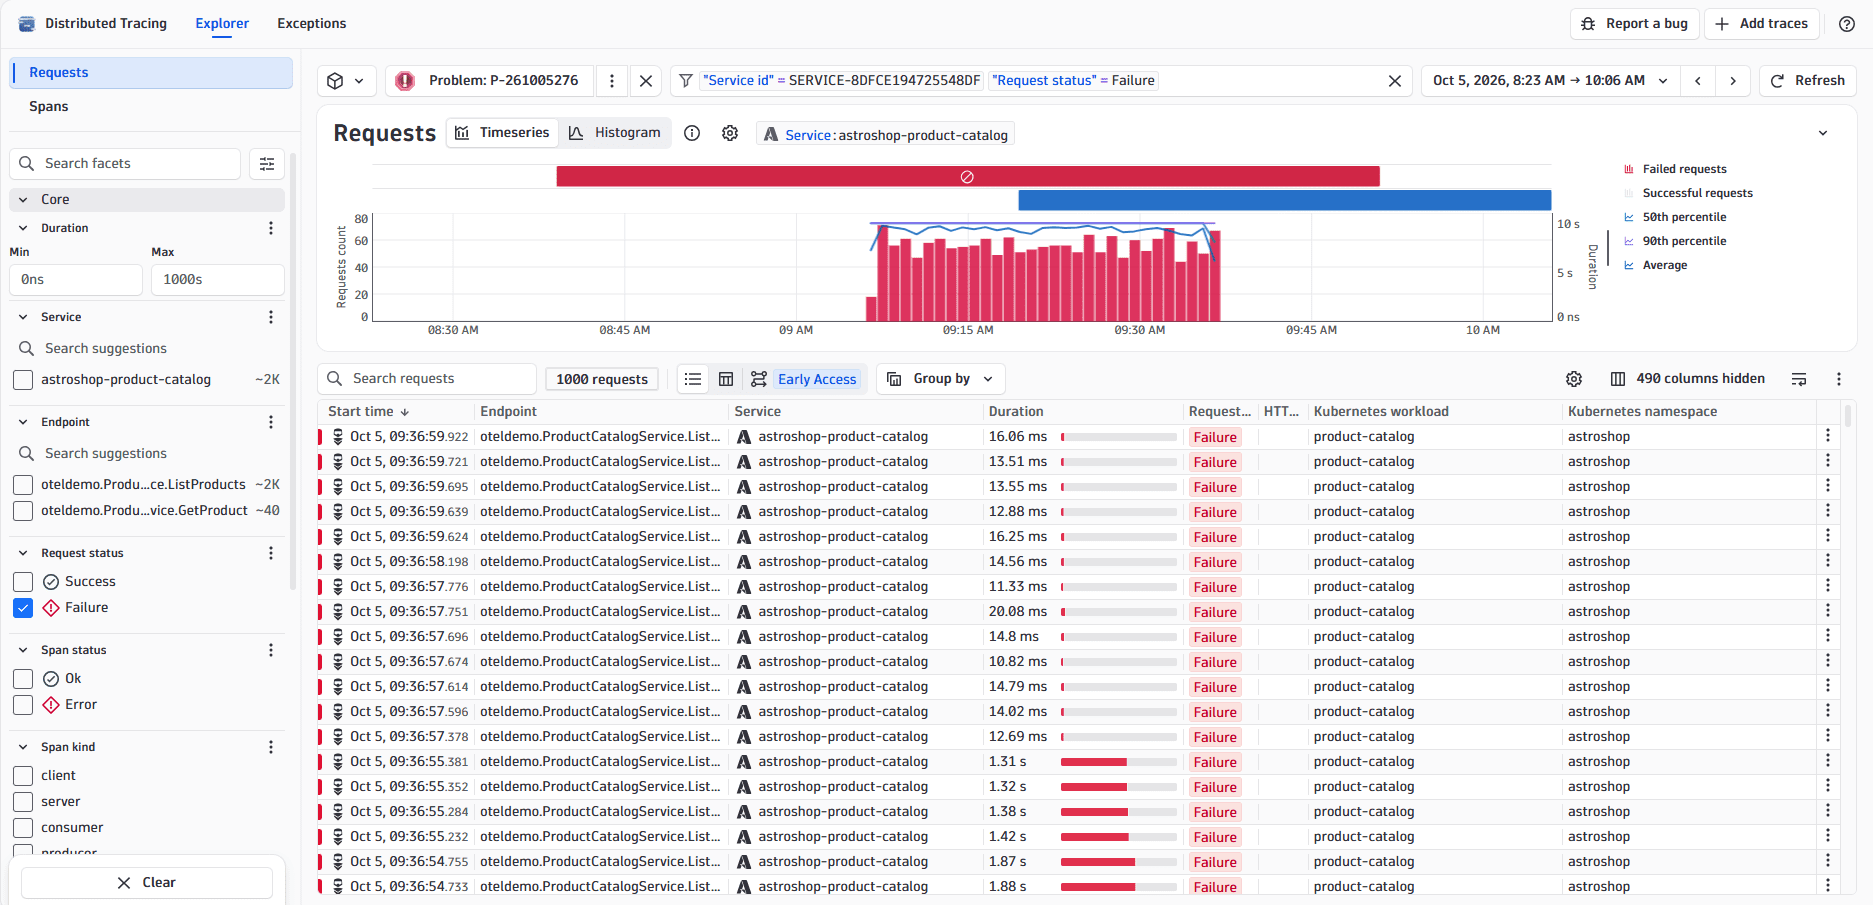
Keep your problem context when you drill down into  Distributed Tracing
When you drill down from a problem into Distributed Tracing, the problem's context, like timeframe, filters, and problem ID, is automatically carried over and clearly visible in the timeseries chart. It is now also applied when you continue the investigation in other apps, such as  Kubernetes, Logs, or
  Services.
Application Observability | Distributed Tracing
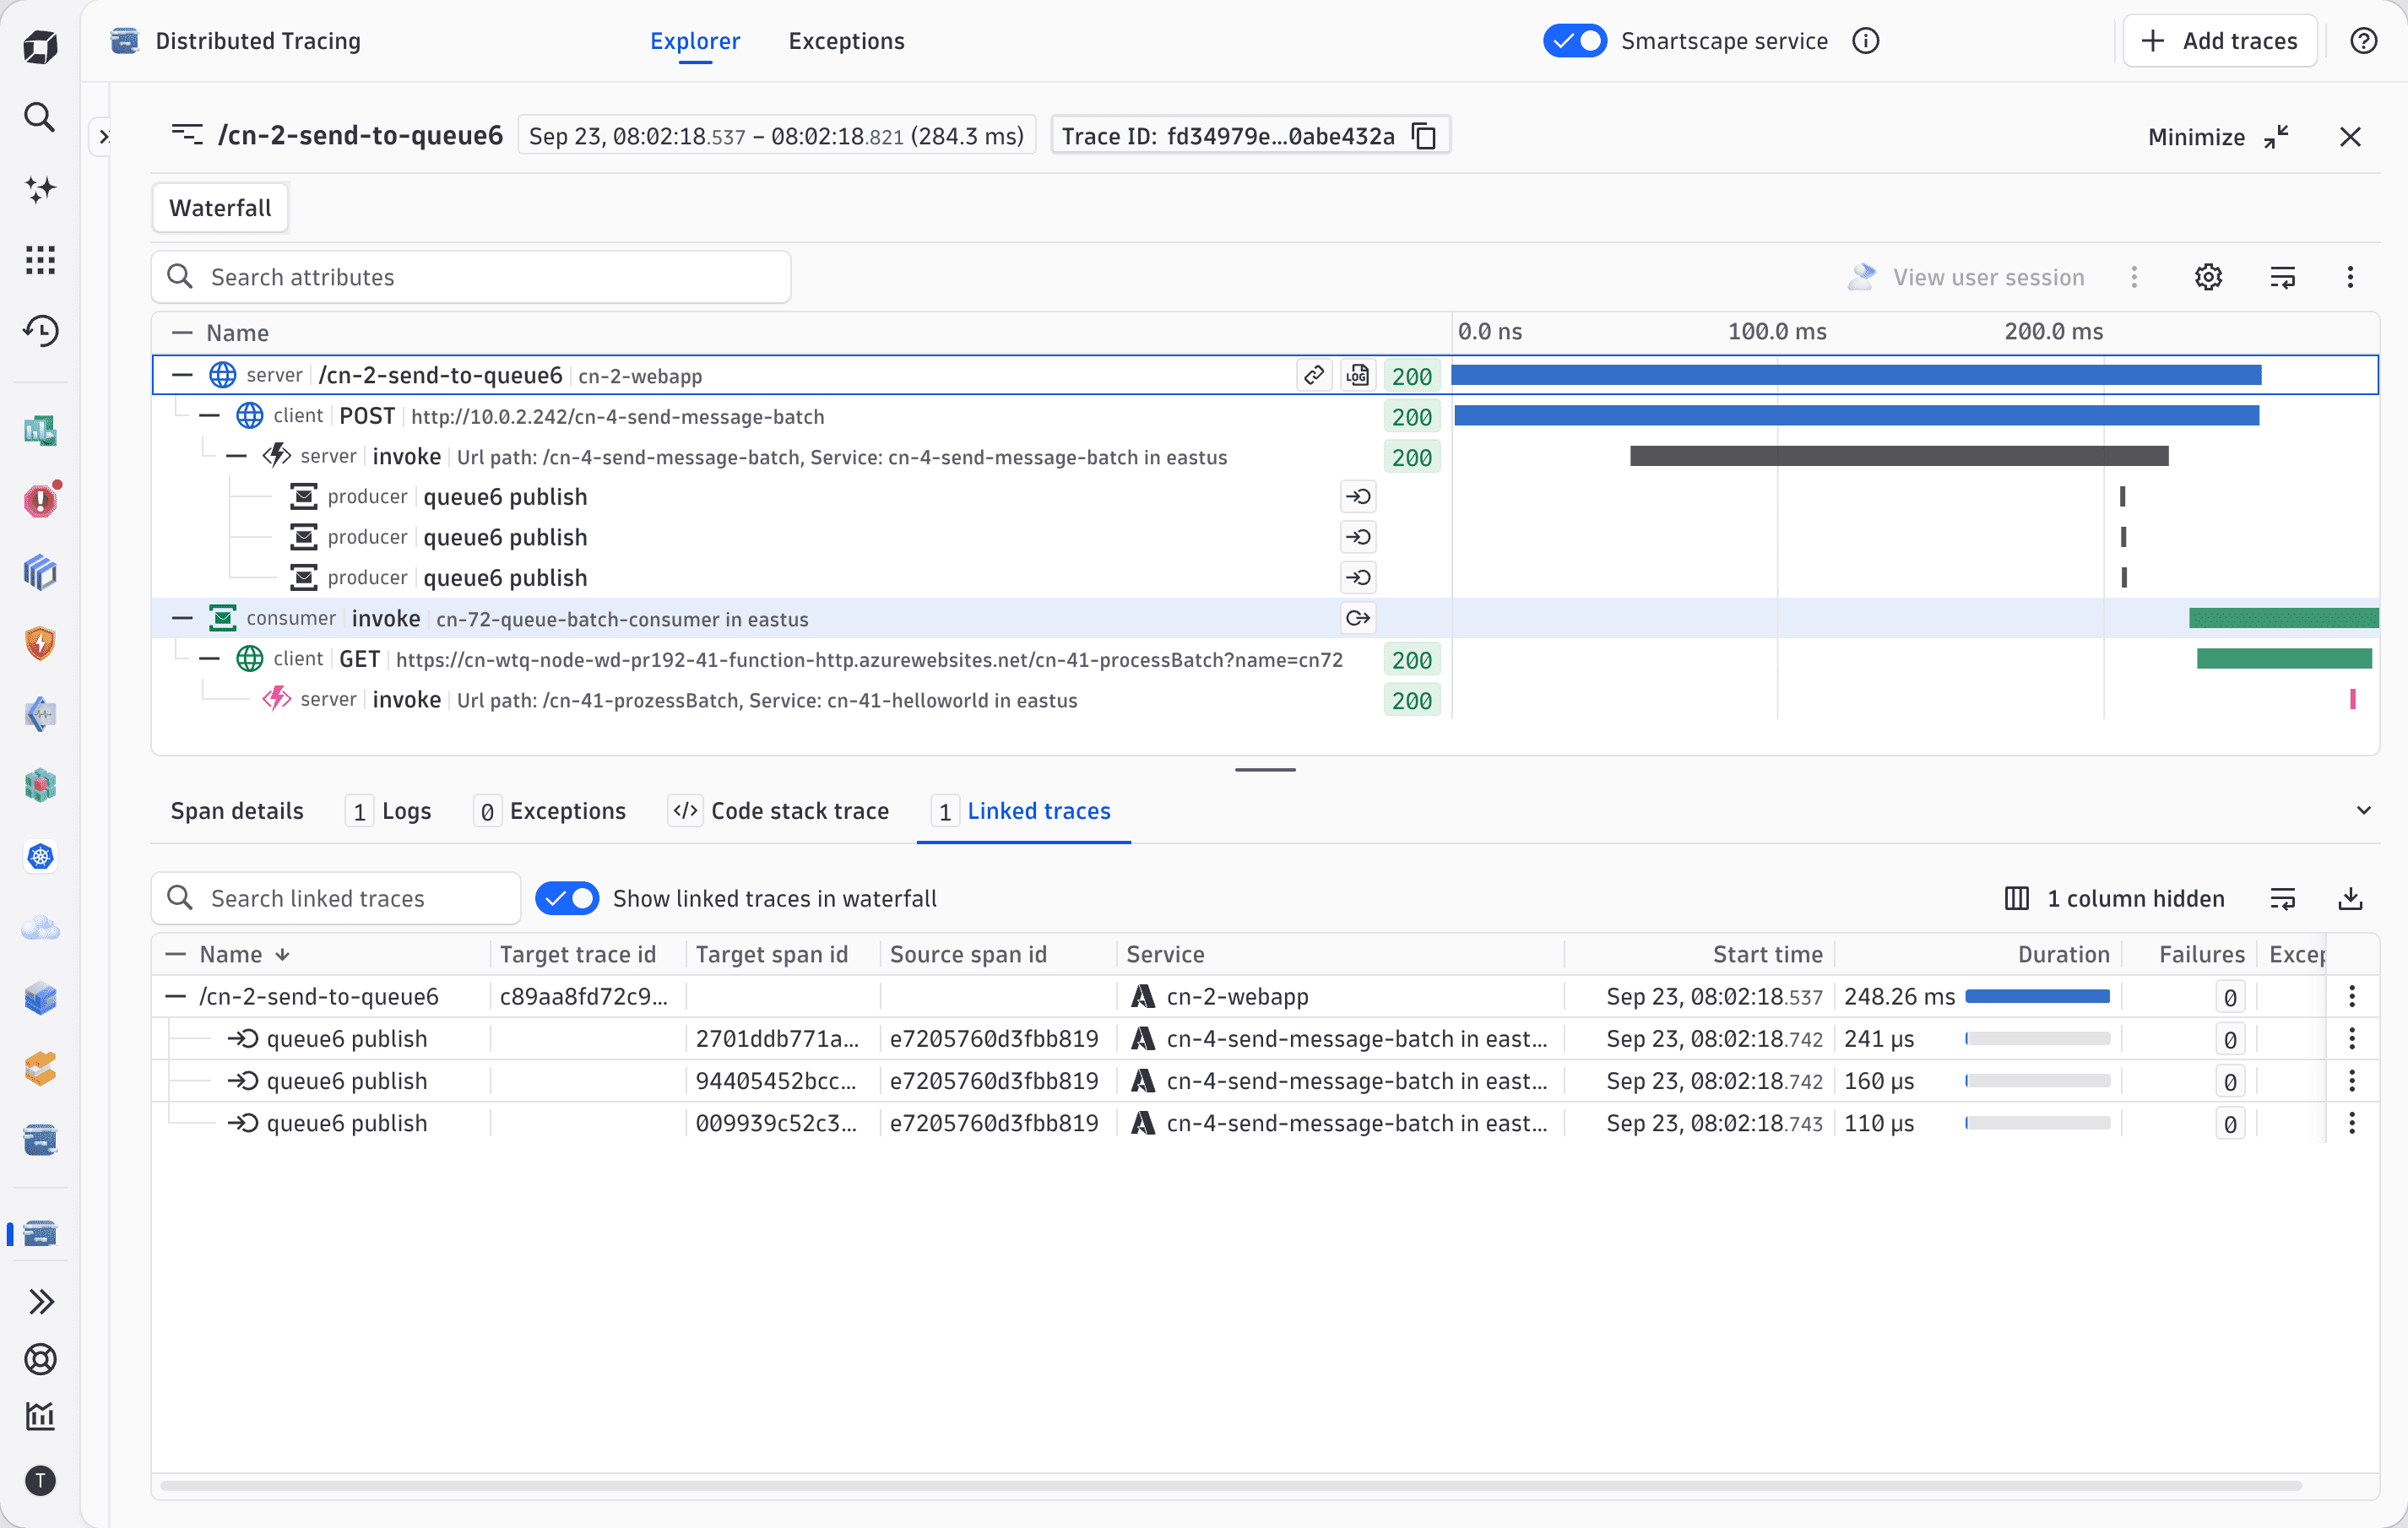
Automatic span link resolution and linked trace navigation in Distributed Tracing
Distributed Tracing now automatically follows OpenTelemetry span links to surface the full trace chain across async messaging boundaries. When a consumer span carries span links—as seen with Azure Functions triggered by Azure Service Bus or Event Hub, and AWS Lambda functions triggered by SQS—the app automatically loads the upstream producer traces into the waterfall without any manual trigger. Spans carrying links are visually highlighted, and a new Linked traces tab in the single trace view provides quick navigation between all related traces and spans. Following a link opens the target trace pre-focused on the connected span.
Application Observability | Log Analytics
Improved log record sorting
The Logs app now displays query results in the order records were ingested, resolving cases where multiple log records share the same millisecond timestamp.
Application Observability | Services
Control service names with OpenPipeline processing rules
You can now assign meaningful names to your services based on any span attribute, such as deployment name or a custom attribute, so that a service your team calls "checkout" appears as "checkout" everywhere, not as :8080 or /api.
The name is reflected consistently across Services and Distributed Tracing, as well as in service metrics and spans. To rename dt.service.name, use OpenPipeline to add a span-processing renaming step.
Unlike the previous Service naming rules, which applied only to the UI, names set through OpenPipeline are written to the underlying data. They appear in your metric queries, dashboards, and SLO configurations without additional steps.
Application Observability | Services
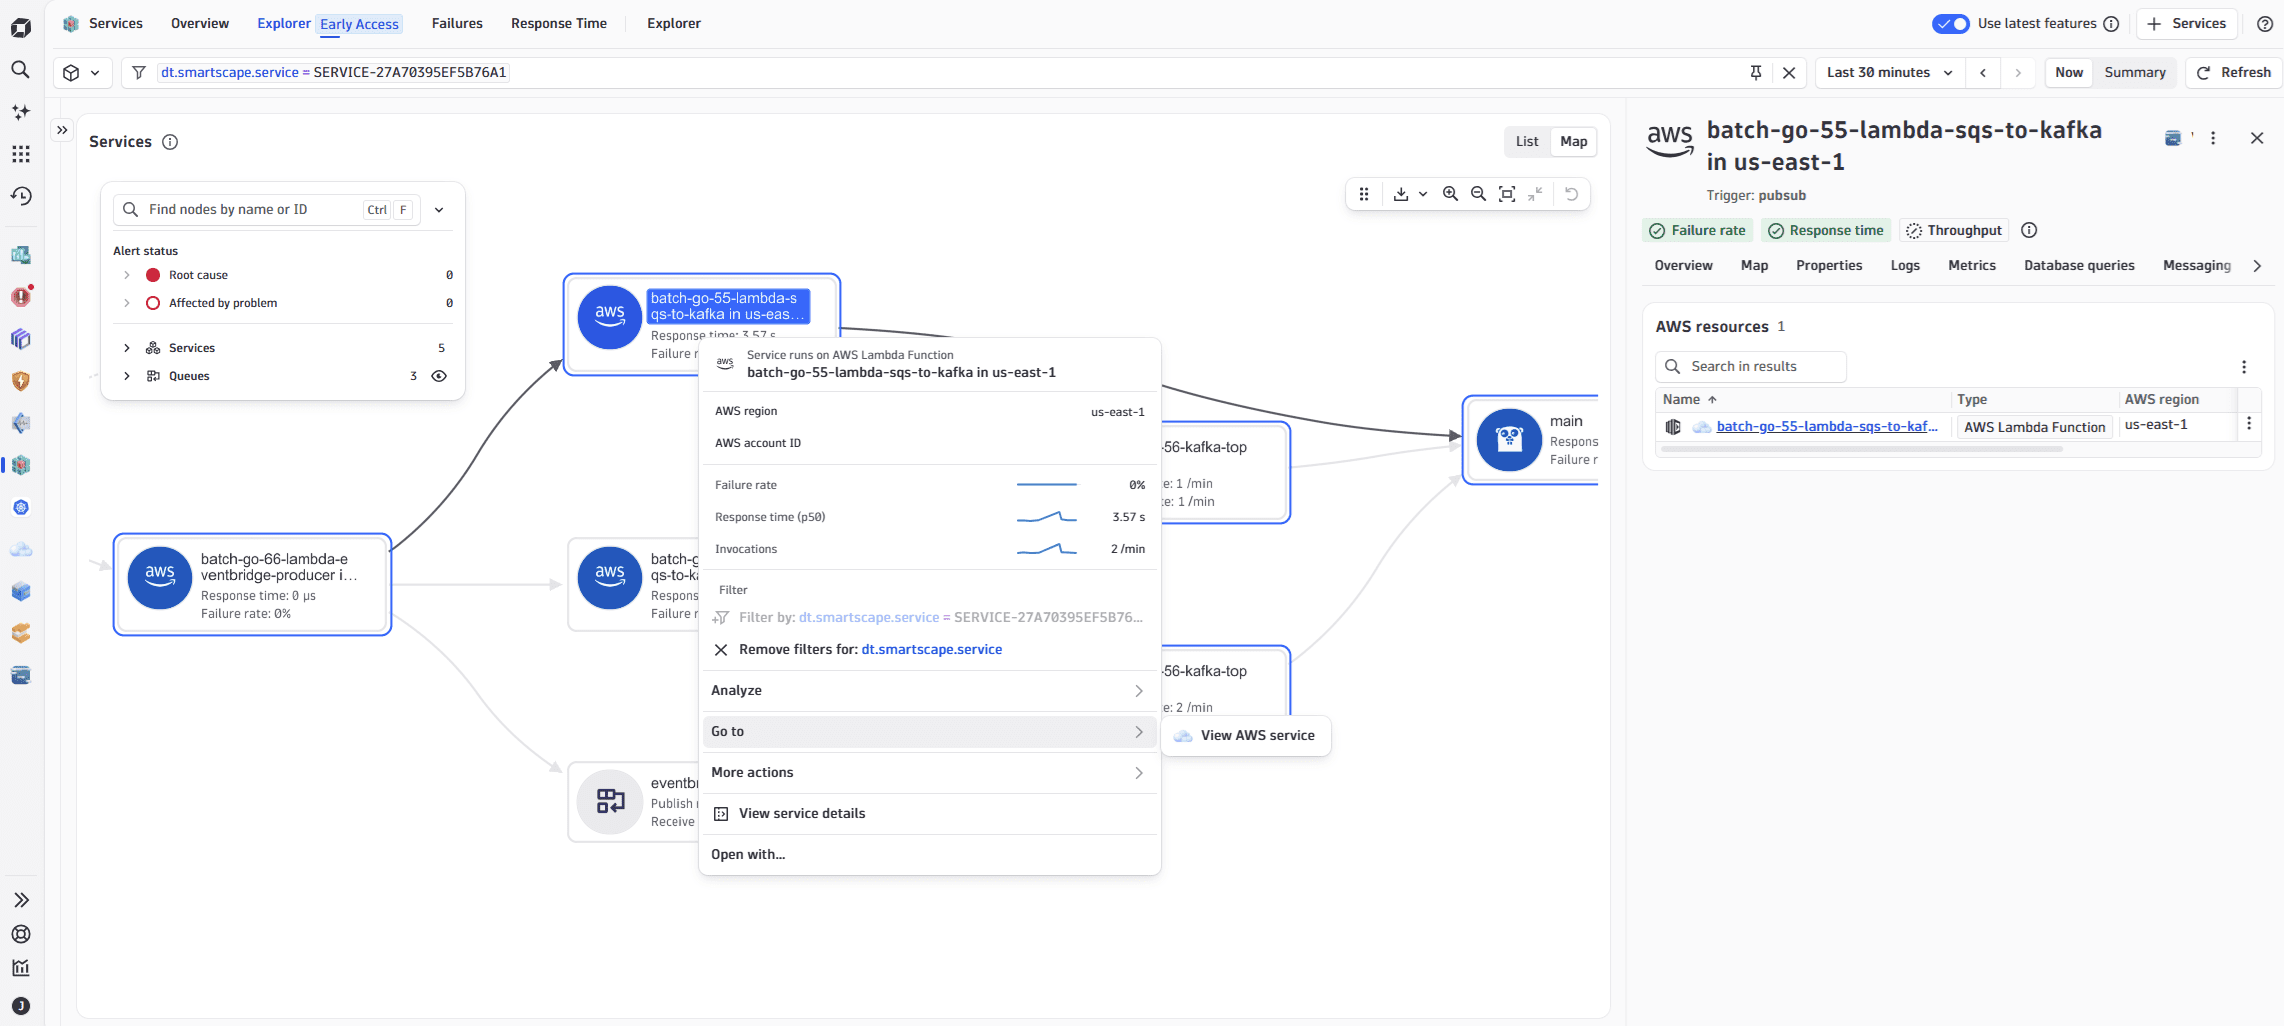
See where your services run directly from the Service Map
The Service Map in Services now shows the cloud infrastructure directly. In the node actions, select Go to to see the entities it runs on, including the underlying compute in Clouds, or select More actions > View topology to see a service's vertical topology. The service tooltip shows deployment context such as cloud provider, region, and account; you can filter the map by those values. The Infrastructure tab in the service details panel lists the same entities. Together, these make it faster to tell whether a degraded service is running on a saturated or failing compute resource.
Application Security | Vulnerabilities
Query vulnerability feeds with DQL
Security vulnerability data is now queryable via DQL. You can retrieve, filter, and correlate vulnerability findings from Dynatrace security feeds using the same query language you use for logs, metrics, and traces, enabling custom security dashboards and automated alerting.
Business Analytics | Business Analytics
Compliance Assistant now supports the APRA CPS 230 operational resilience framework
 Compliance Assistant now supports the APRA CPS 230 framework (Operational Risk Management for Australian financial institutions) to track, manage, and automate compliance across your IT and business landscape. CPS 230 sets mandatory requirements for operational resilience, incident reporting, and governance.
A guided onboarding wizard helps you configure the framework, either as a standalone deployment or alongside the existing EU DORA framework. Key capabilities include:
- Track CPS 230 posture with a compliance score and a snapshot of key critical compliance findings, including vulnerabilities and security detection findings.
- Tag critical operations and monitor the blast radius of technical problems affecting those operations.
- Automatically classify incidents against CPS 230 materiality thresholds to produce audit-ready evidence.
Digital Experience
Enhanced geolocation analysis for web and mobile RUM on Grail
Real User Monitoring on Grail now provides richer geolocation analysis for web and mobile sessions. You can filter and break down user experience data by geographic region with greater granularity, making it easier to identify location-specific performance issues.
The following new attributes are available across all RUM events and sessions:
- City:
geo.city.name - Region:
geo.region.iso_codeandgeo.region.name - Country:
geo.country.name - Continent:
geo.continent.codeandgeo.continent.name
Along with the existing geo.country.iso_code and client.isp, you can query and filter your data by all geographic dimensions in DQL to build dashboards or notebooks, drill into outages by region, or analyze performance across markets.
The new attributes are also surfaced across the RUM apps:
- Experience Vitals: Filter by continent, country, region, city, and client ISP during waterfall analysis, and explore the values for each page load or user action instance.
- Error Inspector: Filter error groups by all geographic dimensions, and explore the sub-country breakdown in the error distribution section.
- Users & Sessions: Filter session explorations by all geographic attributes, and see the complete location in individual session views.
Digital Experience
Apdex-based experience score for Grail
Experience Score is a new 0-1 score that reflects how good the users' experience with your frontend and session was.
- Every scored
user.eventsrecord is classified withexperience.level:satisfied,tolerating, orfrustrated, plus anexperience.weight. - By default, this classification applies to user actions based on their duration, but it can be changed, extended, or replaced through OpenPipeline.
- Classified events are combined into
experience.scorethat is calculated per frontend and per session, classified onuser.sessions:sum(level_value × weight) / sum(weights), where satisfied = 1, tolerating = 0.5, frustrated = 0. - Frontend-level trends are available via the
dt.frontend.experience.weightmetric.
Digital Experience
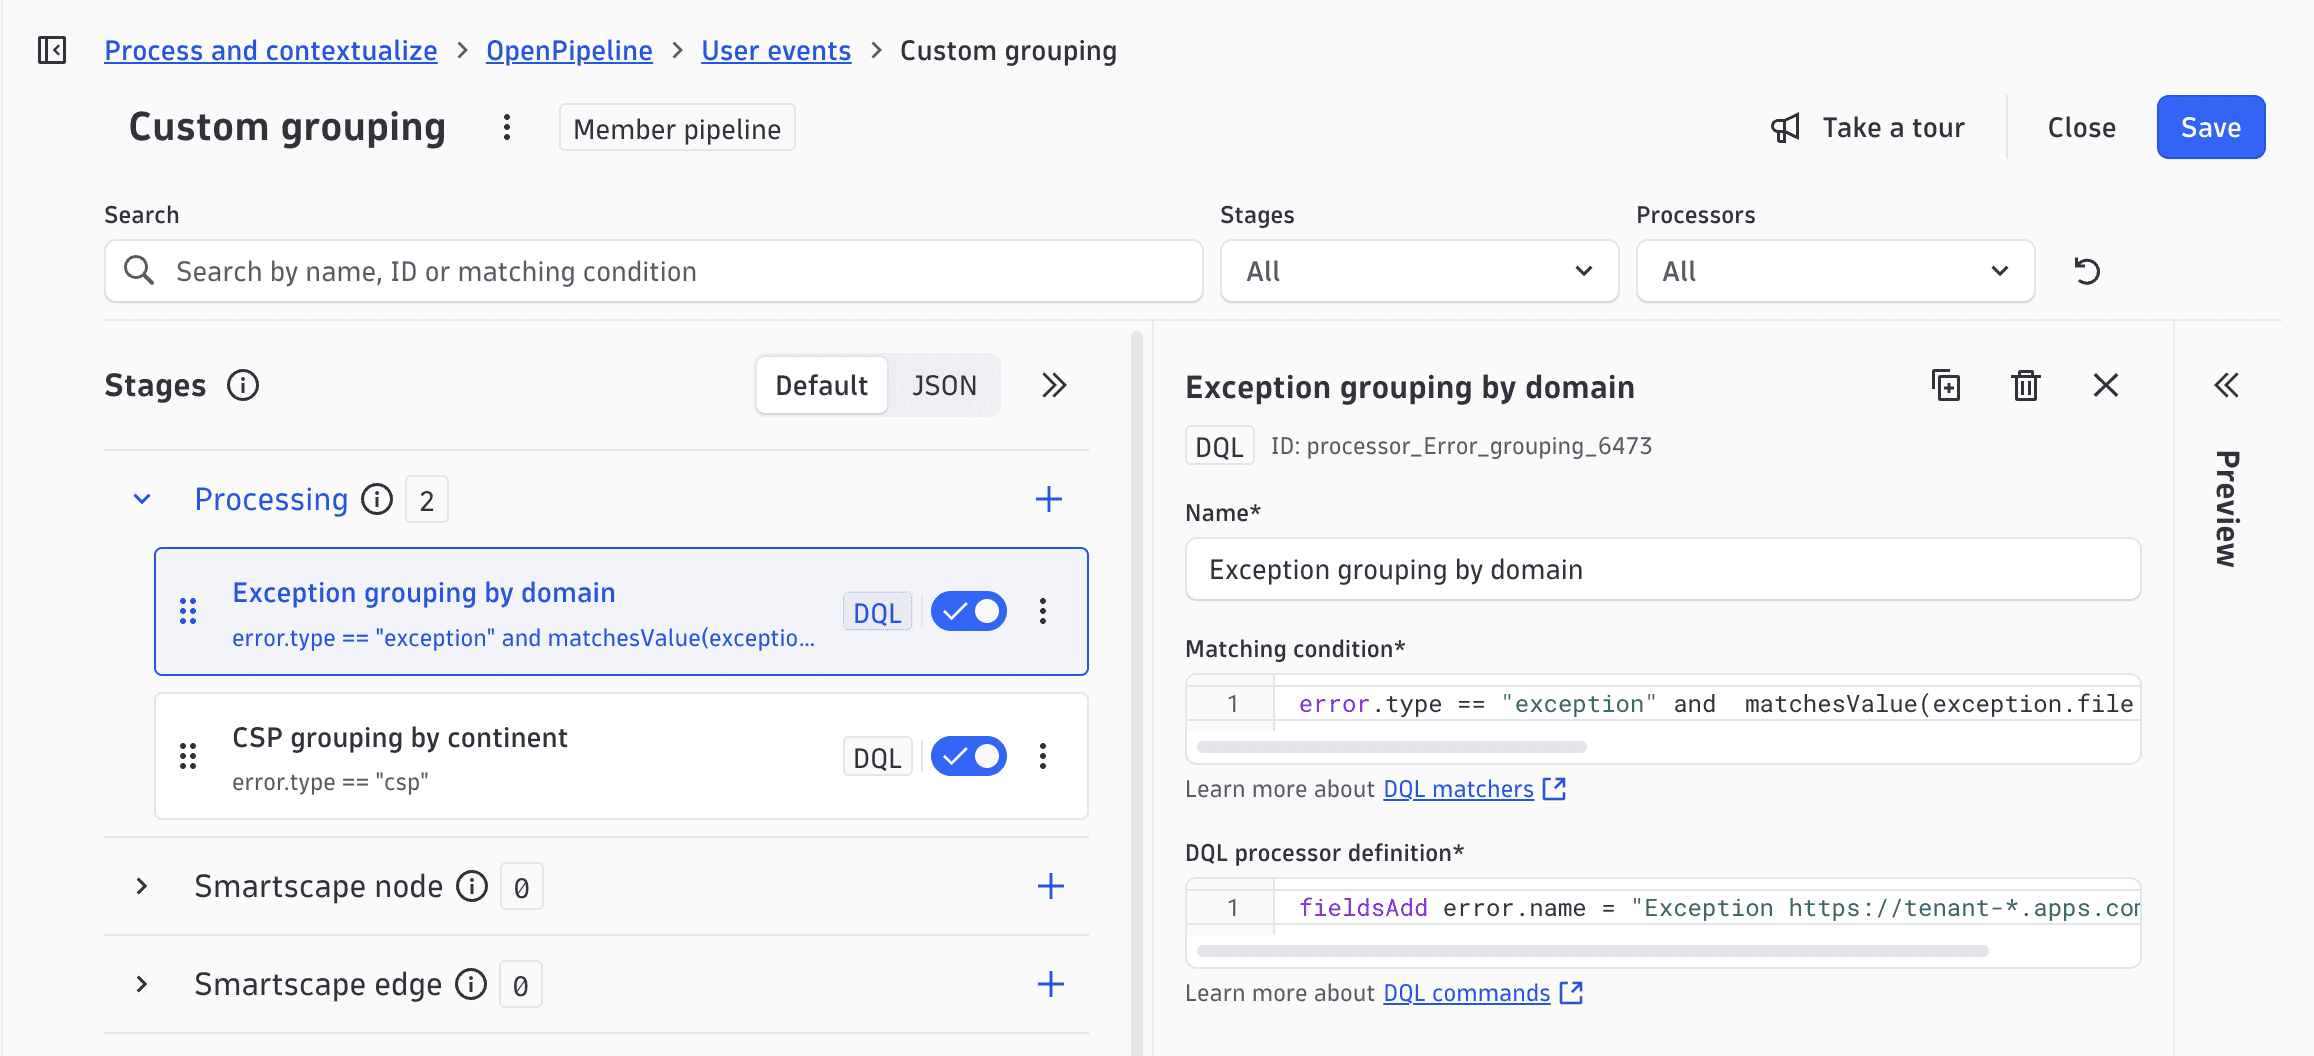
Customize how RUM events are named and grouped
You can now customize how Dynatrace names RUM user actions, errors, pages, and views with OpenPipeline rules or by reporting names from your frontend. Because events are grouped by name, you can combine them into a single group or split them into finer ones, so your analysis, dashboards, and alerts match how your teams think about the frontend.
Digital Experience
New RUM cookies
Once a tenant has been upgraded, RUM sets additional cookies; see Rum Cookies And Web Storage. To help you identify and resolve any compatibility issues with your infrastructure before upgrading the tenant, a setting is provided to upgrade only the RUM cookies.
Digital Experience | Synthetic
Navigate from Synthetic test results to distributed traces
The  Synthetic app now lets you jump directly from a HTTP monitor result to the corresponding distributed trace in Distributed Tracing. This connects Synthetic monitoring with backend trace data, making it easier to diagnose failures and understand their scope.
Digital Experience | Synthetic
Support for maintenance windows defined in  Settings
Metrics and events produced by Synthetic monitors are enriched with maintenance window information for any executions that ran during maintenance. Also, these executions are marked on the Availability chart in Synthetic. This behavior is consistent with how maintenance windows in Synthetic Classic already work.
Additionally, the Exclude periods with maintenance windows from availability calculation setting applies to maintenance windows defined in Settings. When it's on, maintenance window periods are excluded from availability calculations.
Digital Experience | Synthetic
Optimized presentation of Synthetic test executions
Querying Synthetic test executions is now optimized by excluding locations that are no longer monitored, and reducing the default time range for queries. This provides quicker responses to certain queries on Synthetic tests and eases the load from availability checks for alerting.
Digital Experience | Synthetic
Synthetic monitoring adds support for maintenance windows in Latest Dynatrace
Synthetic Monitoring now supports maintenance windows, which are defined in Settings. During an active maintenance window, scheduled executions of selected Synthetic monitors are automatically skipped. Any executions that did run during the window are clearly marked in the monitor result history and on the availability chart—consistent with the existing Dynatrace Classic maintenance window experience.
Infrastructure Observability
Automatically create Dynatrace Problems for Data pipeline failures and degradations detected by definity Data Observability extension
Data pipeline failures and degradations detected by definity | Agentic Data Engineering for the Lakehouse & Spark now automatically create Dynatrace Problems with enriched metadata, bringing pipeline incidents into the unified Dynatrace incident feed alongside application and infrastructure alerts.
Infrastructure Observability
Infrastructure Observability apps support segment filtering by primary Grail fields and tags
 Infrastructure & Operations, Kubernetes, Clouds, and
  Databases apps now filter by primary Grail tags and primary Grail fields.
Primary Grail fields, such as Kubernetes namespaces, clusters, and cloud accounts let you narrow down to the infrastructure that matters for a given context. Primary Grail tags bring your domain perspective in. Filter by your team ownership, organizational boundaries, or any primary tag you've defined.
Now you can:
- Filter by primary Grail tags and fields in the filter bar and facets of each app.
- See primary tags as a dedicated column in list views.
- Use primary tag built-in filters on ready-made dashboards across Infrastructure Observability apps.
Infrastructure Observability | AWS
SSL certificates for AWS SaaS Dynatrace 2nd gen clusters start to being auto-rotated
SSL certificates for AWS SaaS Dynatrace 2nd gen clusters start to being auto-rotated. This means that vendor of the certificate changes from DigiCert to Let's Encrypt. Certificate is issued for 3 months and is auto-rotated every 2 months.
Infrastructure Observability | Extensions
AI-driven upgrade toolkit for migration to latest Dynatrace
A new AI-driven toolkit is available to help you plan and execute your migration to latest Dynatrace. It provides guided recommendations and automated compatibility checks to streamline the transition.
Infrastructure Observability | Extensions
New Zoom extension available
Observe the Zoom Workplace: zoom rooms, devices, meetings and participants. See Dynatrace Hub for details.
Infrastructure Observability | Extensions
New Zscaler Private Access (ZPA) and Zscaler Internet Access (ZIA) extensions
Zscaler Private Access (ZPA) and Zscaler Internet Access (ZIA) extensions: Turn ZPA logs into a fully observable Zero Trust access dataset in Dynatrace and use the ZIA logs to observe Zscaler security and network signals in Dynatrace. See Dynatrace Hub for details.
Infrastructure Observability | Infrastructure & Operations
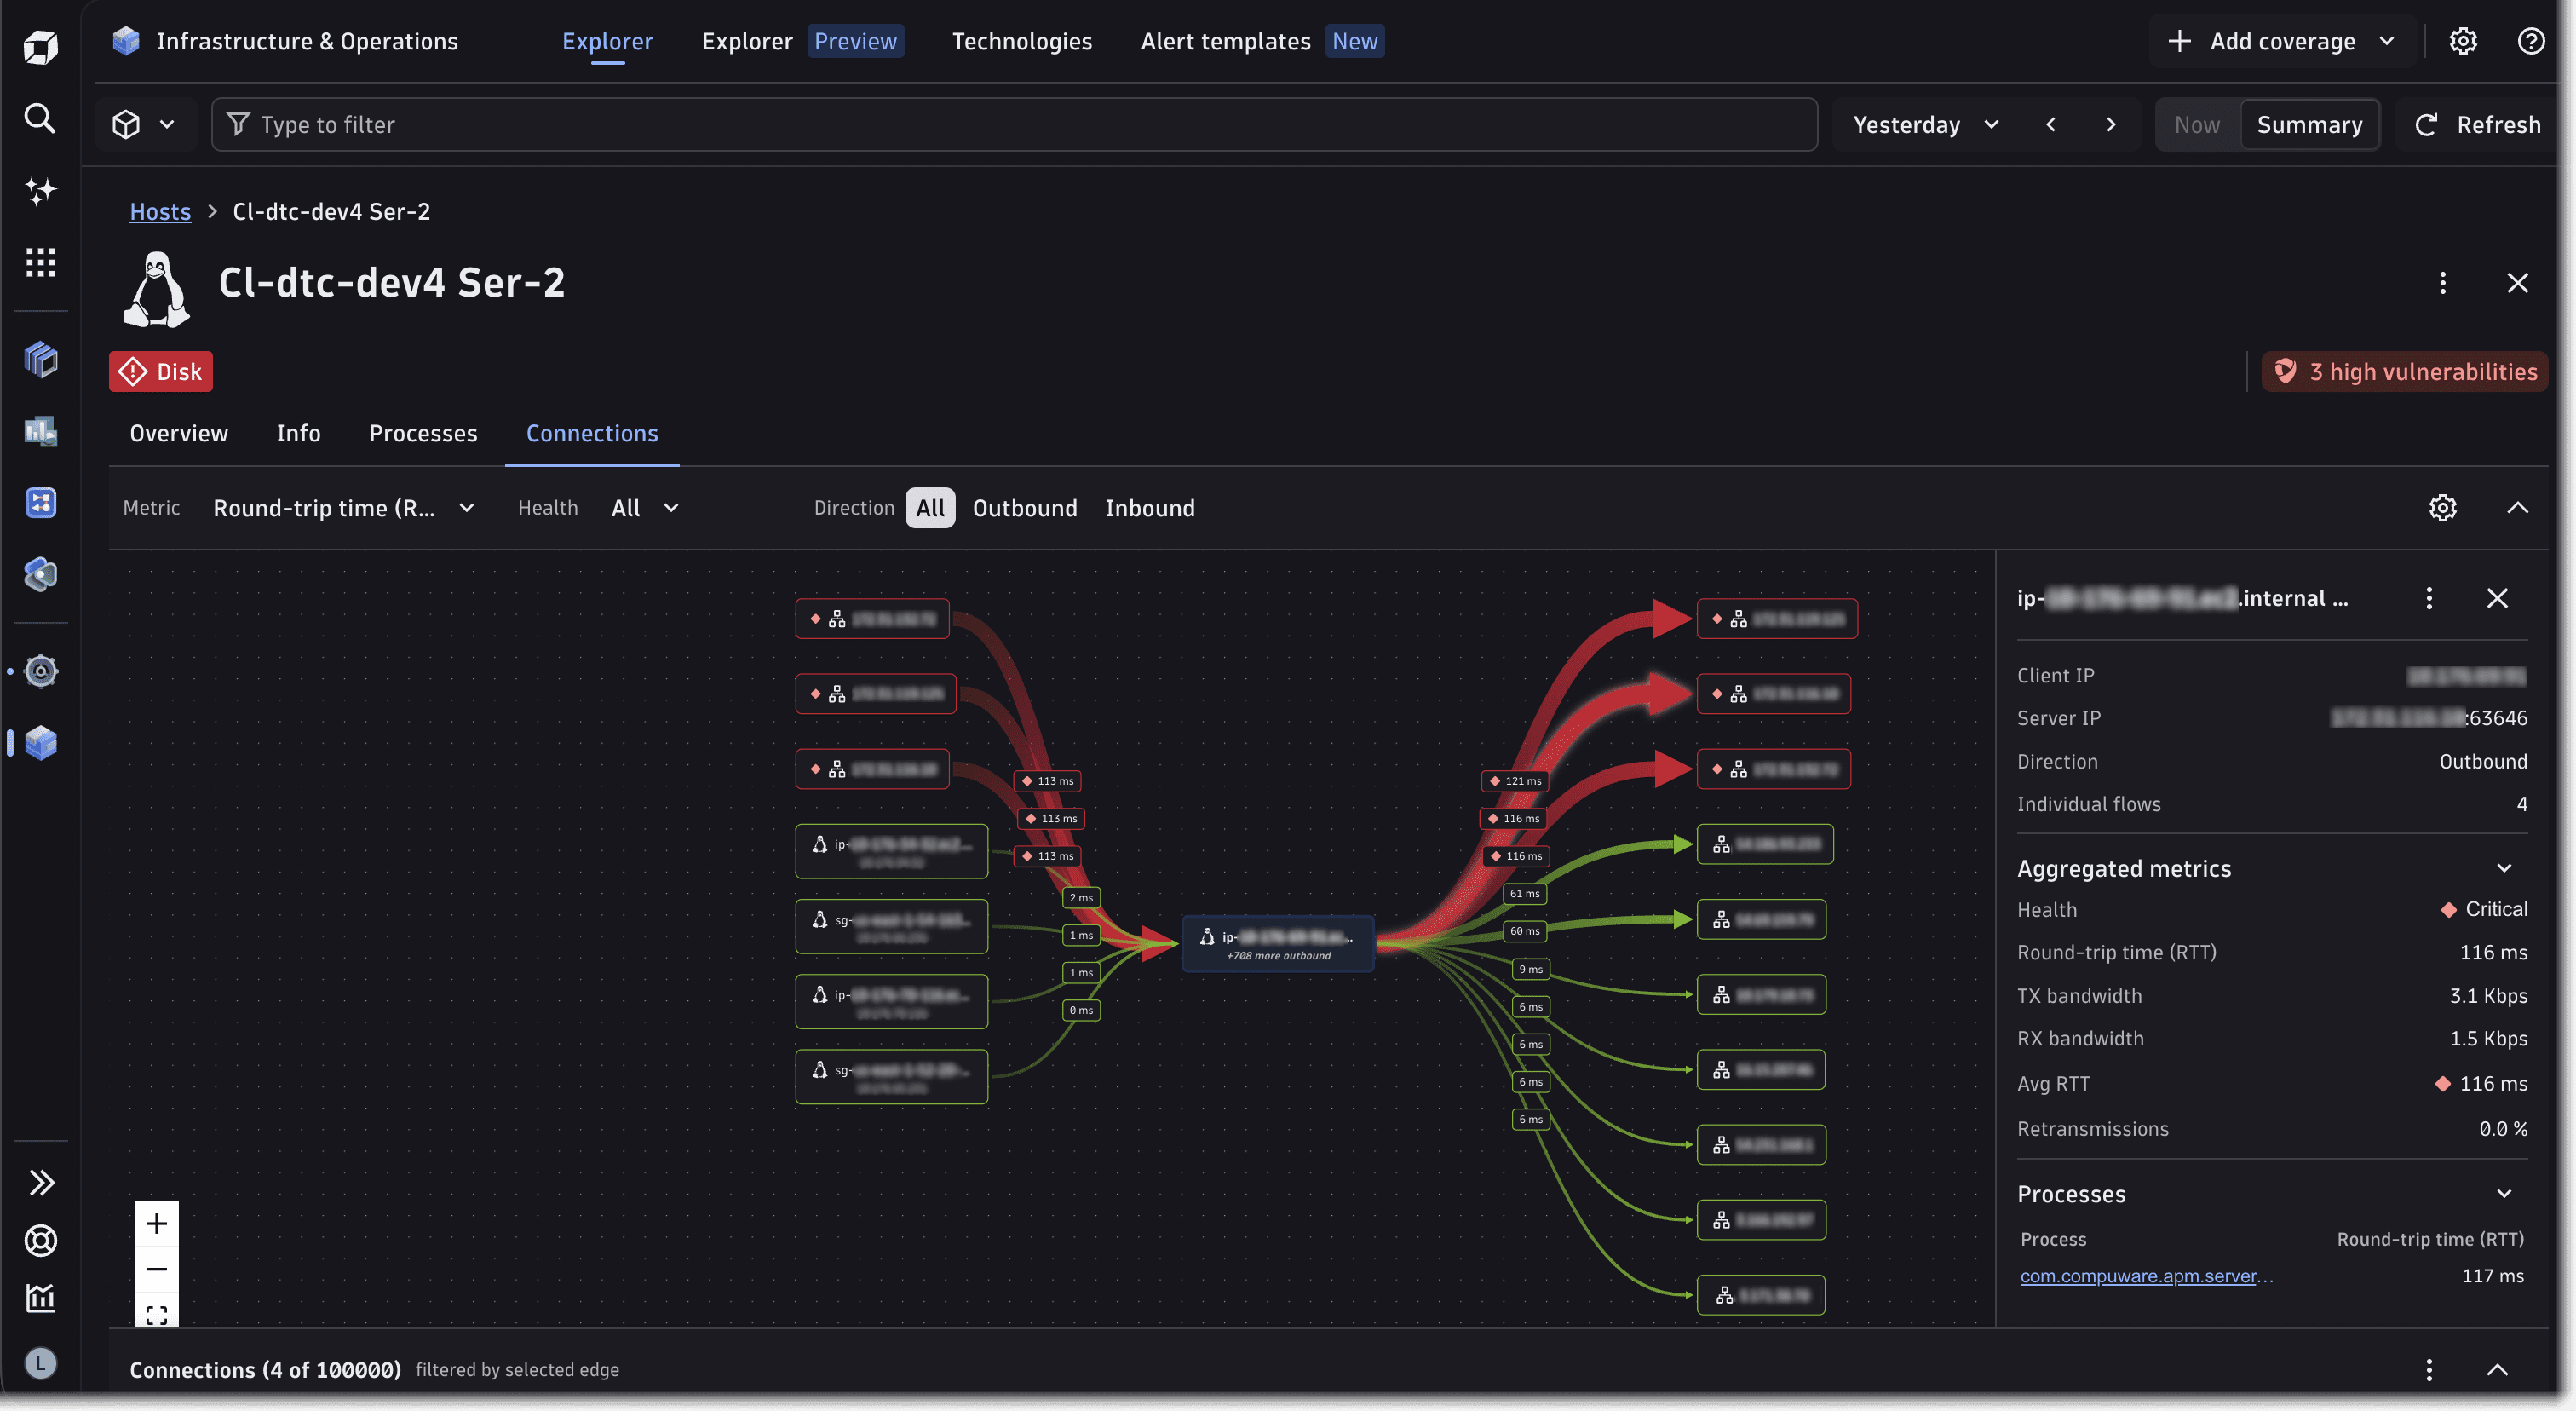
Network connections in Infrastructure & Operations
Infrastructure & Operations now visualizes network connections from OneAgent Network Connection Monitoring.
- Understand host-to-host and process-to-process network performance: bandwidth, round-trip time (RTT), retransmissions, connection resets, timeouts.
- Understand whether unhealthy traffic is directed to a monitored host or process, or to external, unknown hosts.
- Identify which processes talk to each other and how much bandwidth they consume.
- Visually understand sources of slow network performance, for example, latency (RTT) or connection quality (resets and timeouts).
Infrastructure Observability | Kubernetes
Configure primary tags in Kubernetes ingest enrichment rules
The Ingest Enrichment Configuration (builtin:ingest.enrichment.config) now allows Kubernetes rules with target Primary Grail tags. With that, all signals ingested via the ActiveGate (Kubernetes metrics, Kubernetes events, Prometheus metrics) will get enriched with Primary Grail tags already on the ActiveGate. Before the change, Kubernetes signals needed to be enriched with Primary Grail tag rules in OpenPipeline.
Infrastructure Observability | Kubernetes
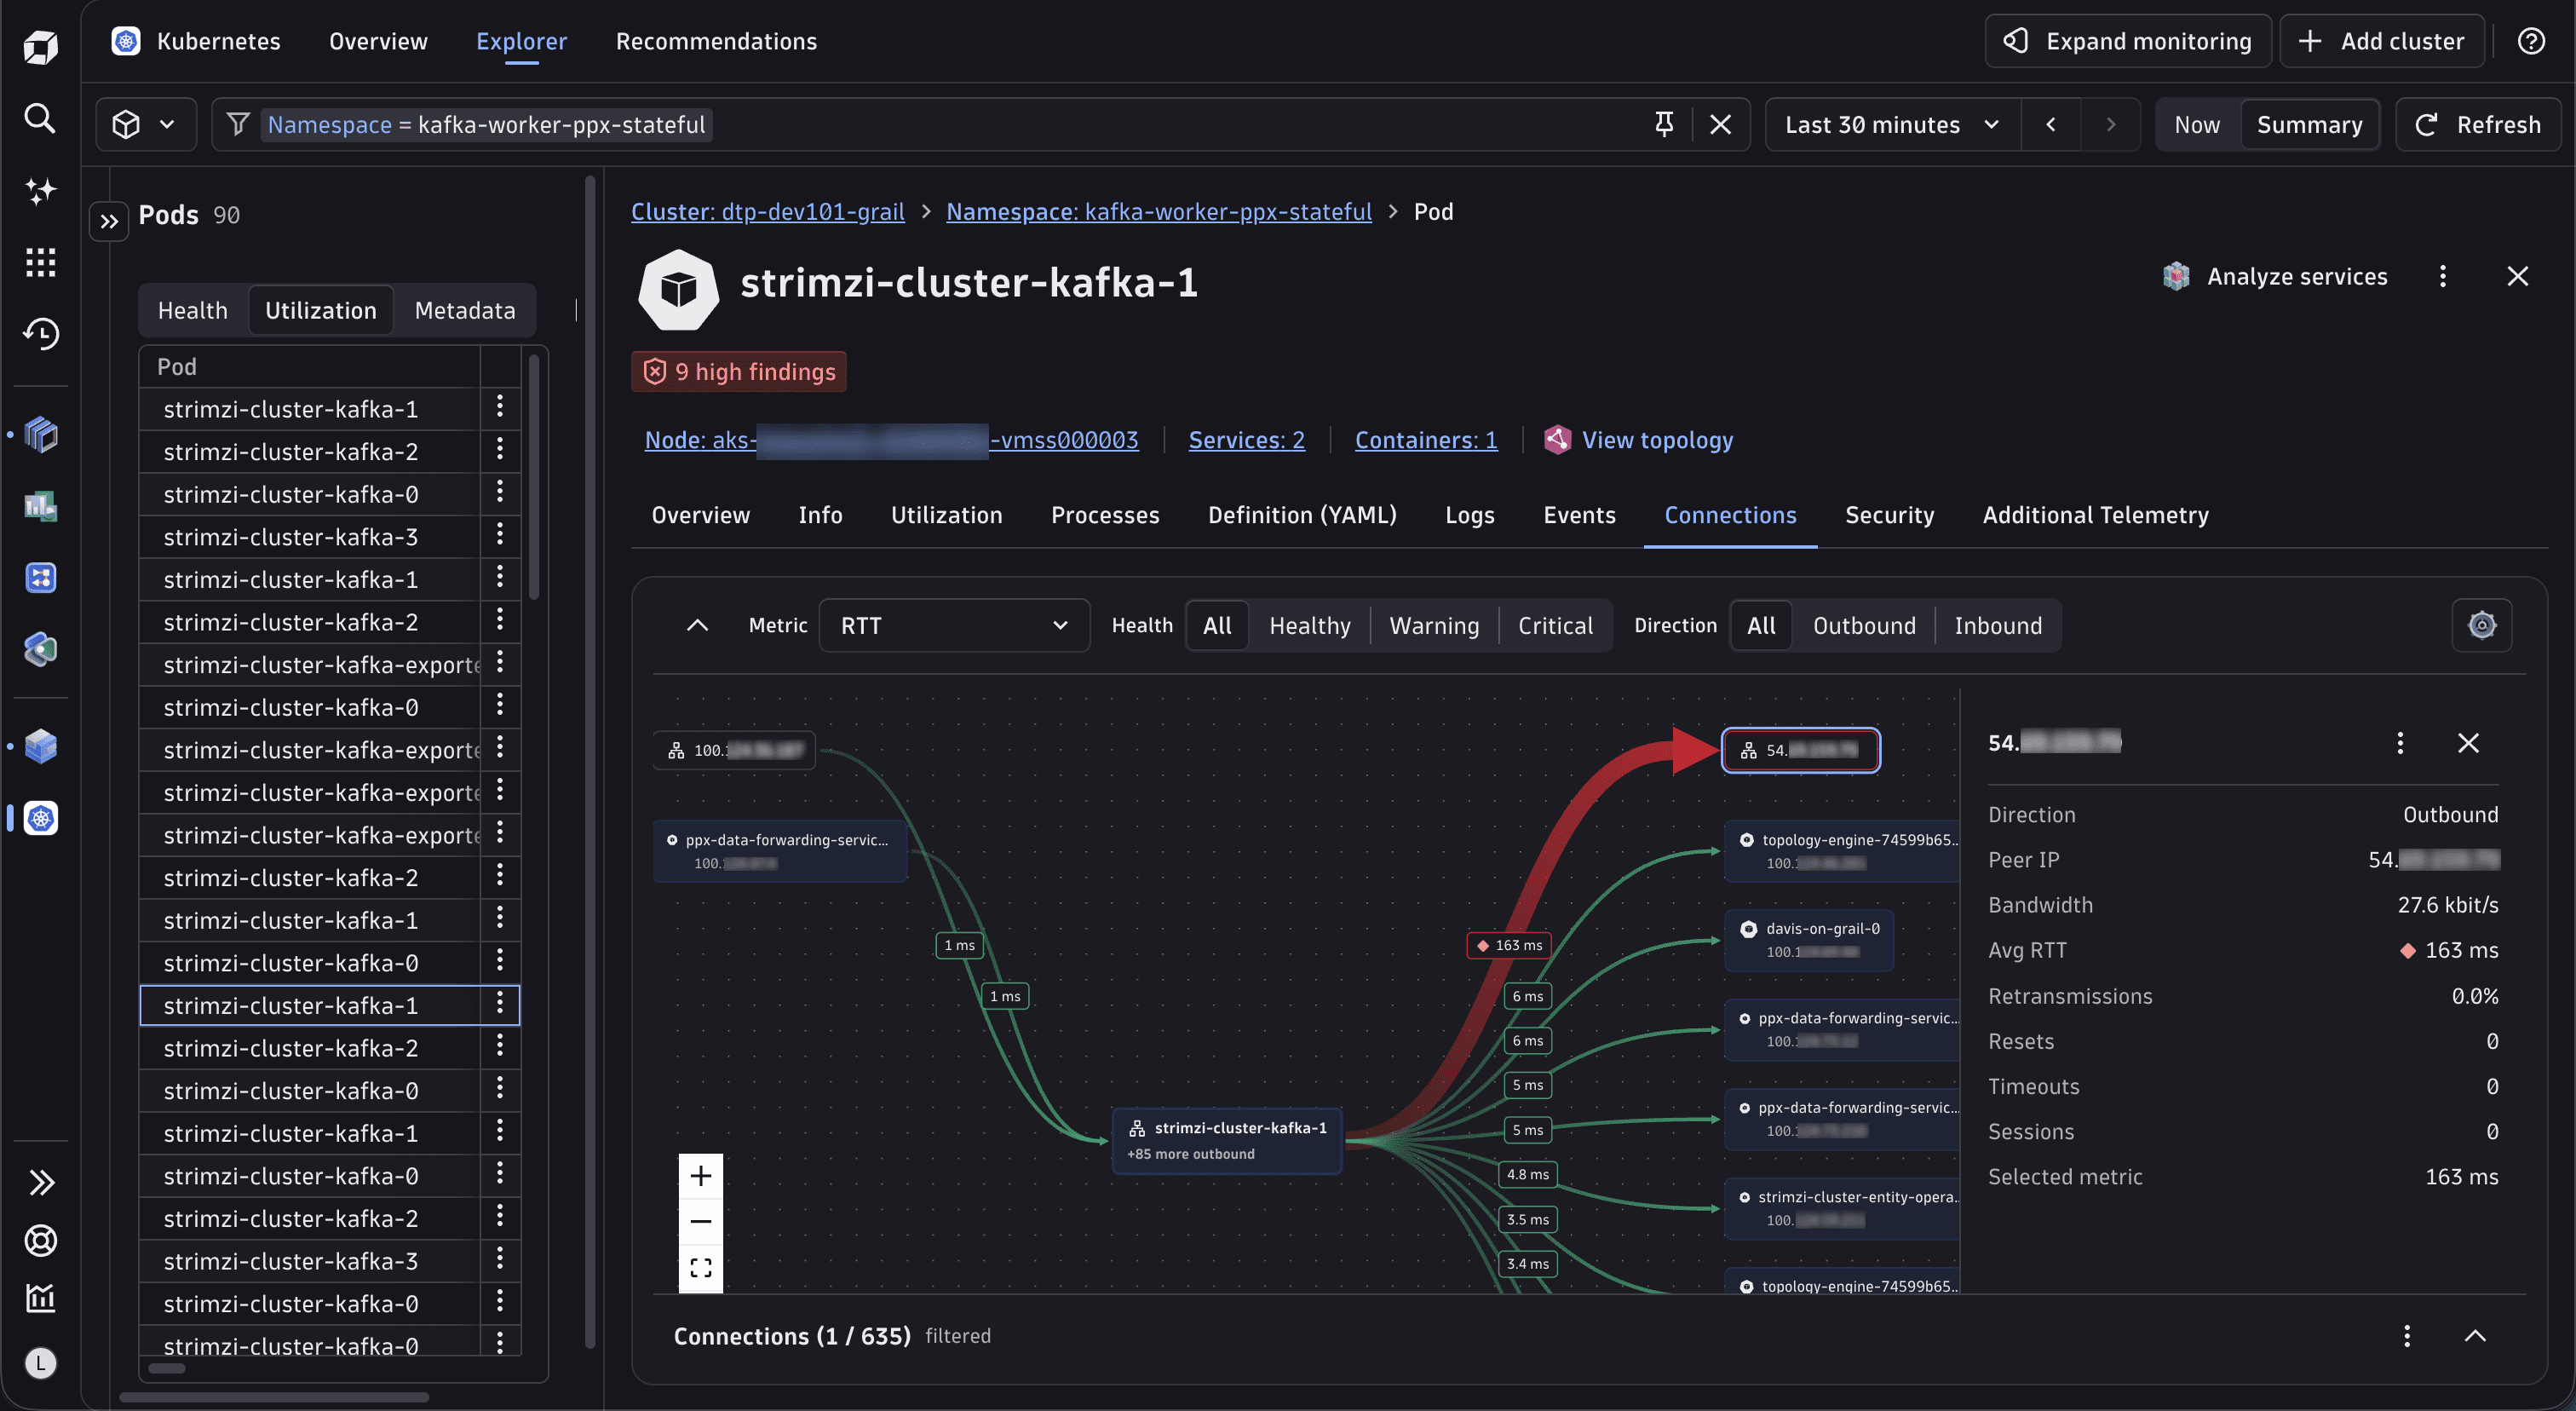
Pod network connections visualization
Kubernetes now visualizes network connections from OneAgent Network Connection Monitoring.
- Understand pod-to-pod, pod-to-service, and pod-to-process network performance: bandwidth, round-trip time (RTT), retransmissions, connection resets, timeouts.
- Understand whether unhealthy traffic is directed to a monitored host or process, or to external, unknown hosts.
- Identify which pods communicate with each other and how much bandwidth each consumes.
- Visually understand sources of slow network performance, for example, latency (RTT) or connection quality (resets and timeouts).
Infrastructure Observability | Kubernetes
New default triggering values for Kubernetes ready-made alerts
Kubernetes ready-made alerts now ship with updated default values, which will trigger updates. New environments created in Dynatrace version 1.348+ get these defaults automatically. Existing environments adopt them in Anomaly detection settings for Kubernetes by selecting Apply recommended values.
Platform | Dashboards
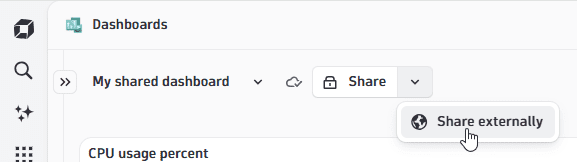
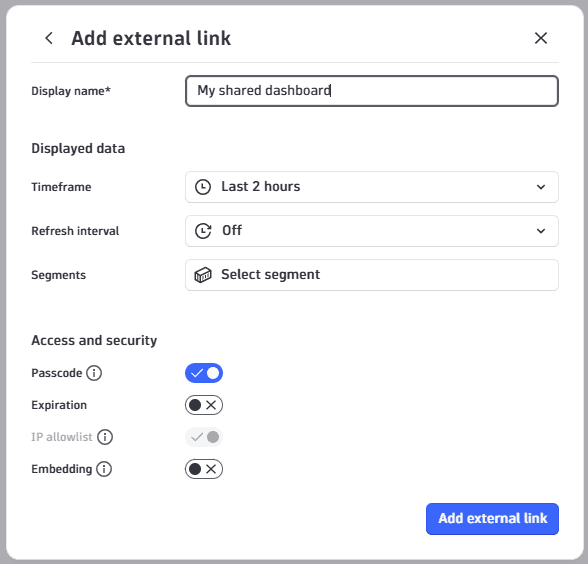
Share dashboards externally without a Dynatrace account
You can now share a dashboard you own with people outside your organization via a secure external link, without requiring a Dynatrace account. Viewers can open the link in any browser and see live data on each load, with the timeframe, refresh interval, and variable values you define. Each link supports a passcode, expiration date, IP allowlist enforcement, and optional iframe embedding, so you stay in control of who sees what and for how long.
For setup instructions, see Share a dashboard externally.
Platform | Dashboards
Improved mobile experience for Dashboards and Notebooks
You can now consume your dashboards and notebooks on the go, on any mobile device.
We now make better use of screen real estate for your content and brought the most important consumer interactions front and center, so viewing and navigating your data feels natural wherever you are.
What's new:
- More space for your content: the app header hides automatically when you open a dashboard or notebook, and controls such as variables, annotations, and segments move to a bottom sheet (closer to your thumbs). Margins are now also optimized on mobile ensuring your content gets the space it needs.
- Smoother navigation and scrolling: the dashboard list opens as a sub-page, is fully scrollable with configurable columns, and scroll traps from tiles are resolved.
- Cleaner header: creator actions are consolidated under a … menu and Share is now the primary action. This also applies on desktop, where actions such as undo, redo, and upload are now surfaced in context only.
- Flexible detail panel: choose whether the detail panel pushes content aside or overlays it — your preference is remembered across sessions.
- Better editing on mobile: in Notebooks, the query editor reflows text automatically so you always see the full query without horizontal scrolling, and section and tile toolbars now have improved button and hit areas for easier selection.
Platform | DQL
Query external cloud data with DQL (Preview)
You can now read and analyze data stored in the cloud directly with DQL, providing access to historical data and archives in common formats such as JSON, NDJSON, CSV, XML, or plain text. As a result, the need to ingest data solely for later DQL analysis becomes less important in scenarios with infrequent access, such as security audits or retrieving archived logs produced by Open Pipeline Forwarding.
Grail allows you to configure Connections to AWS and introduces External Data Stores, which let you reference your cloud‑based files so they’re directly usable in DQL. DQL also adds the ability to explore external data and to use the Dynatrace Pattern Language (DPL) to parse file contents and shape the data at read time to fit your analysis needs.
For details, see Query archived data with DQL.
Platform | Dynatrace Assist
Dynatrace Assist is now context-aware
Dynatrace Assist now has access to the app content you have open next to the chat, so you no longer need to describe what's on your screen. Ask about the dashboard, host, or page you're looking at, and Dynatrace Assist factors in what it sees, cutting out the back-and-forth of explaining context. When a response draws on your screen content, a notice tells you so, and any personal data in that content is masked and shown as placeholders rather than real values.
Platform | Dynatrace Intelligence
AI-powered problem root cause analysis by Dynatrace Intelligence
Dynatrace Intelligence can now run agentic workflows for problem root cause analysis. When a problem is detected, Dynatrace Intelligence automatically investigates contributing factors, correlates metrics, logs, and traces, and surfaces actionable insights, reducing the time you spend manually piecing together evidence.
Platform | Grail
Introducing the External Archive Explorer (Preview)
With the new External Archive Explorer (Preview) app, cloud-archived data is now easily accessible directly within Dynatrace by any user with the necessary permissions, for incident investigation, audits, and security lookups:
- Browse archived data in any configured external datastore and drill down to relevant objects.
- Inspect and search the data instantly. Select any object and its content appears immediately for any text-based format, even compressed, with automatic recognition of the most common formats for a structured view.
- Learn to query using DQL as you go. Within the app, you can view the exact DQL it runs, so power users can copy, tweak, and graduate to raw queries when they need to.
Platform | Grail
Log ingestion now accepts log data up to 72 hours old
The log ingestion pipeline now accepts log records with timestamps up to 72 hours in the past, extended from the previous 24-hour limit. This improves resilience for log sources that experience temporary outages or need to backfill recent data.
Platform | Segments
Filter-segment management now has audit visibility
Segments management previously stored only their latest state, with no history. If a segment stopped matching data as expected, there was no way to tell whether it was an environment change or a definition change - and if the latter, who made it and when. This closes that gap without adding a separate history store: the audit trail lives in the same dt.system.events as other audit logs.
Example query to fetch the audit data: fetch dt.system.events, from: -30d | filter event.kind == "AUDIT_EVENT" and event.category == "FILTER_SEGMENT_MANAGEMENT"
Platform | Smartscape
Smartscape details panel
Select any node in Smartscape to open a details panel with the entity's full context in one place. The panel shows the entity's properties (including Grail primary fields and primary tags), key metrics, and its active and resolved problems. Every property stays actionable: copy its value, filter the topology by it, drill down into other Dynatrace apps, or ask Dynatrace Intelligence to explain what it means. Select a relationship to see its type and both connected entities side by side.
Threat Observability | Security events
Turn suspicious logs into actionable security findings at ingest
You can now extract Detection findings or custom security events from your logs at ingest time using OpenPipeline. Define match conditions against your log stream and promote matching records into structured DETECTION_FINDING security events without waiting for downstream processing or manual triage.
This closes the gap between raw log noise and an actionable security signal. Suspicious patterns buried in application or infrastructure logs, authentication failures, policy violations, anomalous commands, are now first-class security events stored in Grail, normalized to the Dynatrace Semantic Dictionary, and immediately available across the platform:
 Workflows: Trigger automated response and notification pipelines the moment a finding is created
 Dashboards and
  Notebooks: Visualize detection trends, risk levels, and affected entities with DQL over
 security.events Investigations: Pivot from a finding directly into deep-dive forensic analysis with full log, trace, and topology context
To get started, configure a log processing pipeline in OpenPipeline and add a security event extraction processor with your matching condition and field mappings.
Breaking changes
Data Observability
Log ingest: log.level, log_level, lvl, and levelname now recognized as severity keys
All log ingest APIs that parse structured logs (generic JSON, OTLP logs, AWS Firehose) now recognize log.level, log_level, lvl, and levelname as severity attribute keys, in addition to the previously supported keys. These cover common logging patterns in the Java/Kafka ecosystem, Logrus (Go), and Node.js libraries. Plain text ingest is not affected, as Dynatrace does not extract severity from unparsed plain text logs.
For the full list of supported severity keys, see Ingest JSON and TXT logs.
Breaking change: Log records carrying any of these attributes are now interpreted as log severity and mapped to the loglevel field. Previously, they were kept as plain attributes. In flattened JSON structure mode only, log.level additionally matches the nested form {"log": {"level": "INFO"}}, because nested keys are flattened with a dot. The default raw mode (since Dynatrace version 1.331) is unaffected, as it recognizes only a top-level log.level key.
Action plan: The keys log.level, log_level, lvl, and levelname are now recognized by default as severity fields across all log ingest APIs (generic JSON, OTLP, and AWS Firehose). If any of your JSON log sources already use these field names for a purpose other than severity, the extracted severity values may change after the upgrade. Review your JSON log sources for these field names and, where necessary, add an OpenPipeline processor to override or suppress the automatic severity extraction.
Digital Experience
Fixed API reported error grouping for mobile user events
When error.name is reported via the API for mobile user events, it will be taken for the error grouping calculation now instead of the reported name field. An API reported error.name won’t be privacy masked.
Additionally error.display_name won’t be written for web and mobile anymore.
Action plan: The grouping logic for user events (errors, pages, views, and user actions) has changed to align with the updated RUM Error Grouping specification. Existing error groups may be reorganized after the upgrade, because volatile or previously restricted name fields are now processed differently. Review dashboards, alerts, and DQL queries that filter or aggregate on specific error group names. If the new grouping does not match your requirements, use the OpenPipeline custom grouping processors now available for the error, page, view, and user_action namespaces.
Platform | Davis
Davis events and problems no longer default event.severity
Davis events and problems no longer default event.severity to 3. Defaulting can be customized with a Davis event processor in OpenPipeline. Workflows with a Davis event/problem trigger that filter on event.severity=3 expecting it to be defaulted, might need to be changed to filter for Any severity to keep being triggered.
Action plan: Open your workflow list and filter for workflows with a Davis event or Davis problem trigger. For each workflow that includes an event.severity = 3 filter, decide whether that filter is intentional (the event source explicitly sets severity 3) or was relying on the old default. If it was relying on the default, change the filter to Any severity so the workflow continues to fire after the upgrade.
Fixes and maintenance
Resolved issues in this release (SaaS)
- Updated the
FullDocumentresponse so thatcontentandmetadataare required. This is an improvement to the API documentation and SDK typings only, not a functional change, because both properties were already present in responses. (PAPA-35852) - Fixed a missing limit on the number of directories scanned when a wildcard pattern is used in a log path configuration (
maxDirsMatchingLogPattern). Without this limit, an overly broad pattern could cause excessive resource consumption on the host. The limit is now enforced. (OA-71411) - Fixed an issue affecting Kubernetes entity ingestion in Smartscape. The
id_classicfield property was missing from the new Smartscape event ingest path for Kubernetes entities. This field is now correctly populated for allK8S_*entity types in the OpenPipeline-based ingest path. (INFOBS-14299) - Fixed an entity resolution mismatch in the Clouds app that caused AWS Cognito entities to appear without associated metrics. Cognito entities are now correctly resolved, and their metrics are displayed. (INFOBS-13067)
- Updated OTLP metric ingestion so that dimension values represented as
StringforLongandBooleanretain their original type. Exact comparisons that rely on the previous behavior may break and need adjustment. Use DQL'stoStringonBooleanorIntegercomparison values used in OTLP metric queries, or set up OpenPipeline rules to convert selected dimensions back toLongorBooleanon ingest. (ICP-9169) - Updated the AI Costs dashboard to provide a better overview of usage. (DI-33186)
- Fixed an issue with the OS Service Smartscape ID calculation on Davis events, which caused non-existent Smartscape IDs to be calculated. (DI-33082)
- Fixed the Prompt agentic AI action so the agent is created with its resources and skills configuration. (DI-31674)
- Fixed a bug where the
 Problems app showed
 Environmententity/name for events that are raised on a Smartscape entity without a name field. (DI-31329) - Fixed platform problem closing for classic problem IDs: the Grail snapshot lookup now uses the FDI2-normalized form of the ID; IDs without a start timestamp are discarded rather than emitting an unverifiable close. (DI-31295)
- Fixed a bug where baselining events were ingested without a
nameattribute. Events now include the correct name, ensuring they appear and filter correctly in the UI and in DQL queries. (DI-31222) - Fixed a rendering bug where the visual viewport was positioned incorrectly during replay when the recorded session contained zoom or pan interactions. The replayed content would appear at the wrong offset due to the translation and page scroll not being correctly coordinated. (DEM-32904)
- Fixed a bug that prevented CPU Killer synthetic monitor configurations from being imported using the E2E importer. Imports of this monitor type now complete successfully. (DEM-32597)
- Fixed a layout bug where the tab strip in Session Replay was rendered wider than the replay area when a session contained multiple browser tabs. (DEM-32248)
- Fixed a bug that caused Synthetic private node creation to fail for Alibaba Cloud environments. Nodes can now be created and configured for Alibaba Cloud without errors. (DEM-29065)
- Fixed an issue in hybrid mobile sessions with WebView correlation enabled where JavaScript errors were not recognized correctly. The Analyze JavaScript errors option is now available for WebView JavaScript errors, restoring access to detailed error analysis, including stack traces and source maps. (DEM-28346)
- Fixed an issue where a malfunctioning primary tags selection was shown when creating or modifying the monitoring configuration of a JMX or PMI-based extension. The selection is now hidden. (DAQ-28744)
- Fixed a validation gap where content exceeding the 990 KB per-payload limit was accepted during ANDS validation. The limit is now enforced correctly, and payloads exceeding 990 KB receive an appropriate error response. (DAQ-28491)