What's new in Dynatrace SaaS 1.337
- Release notes
- 4-min read
- Rollout start on Apr 21, 2026
This page showcases new features, changes, and bug fixes in Dynatrace SaaS version 1.337. It contains:
Infrastructure Observability
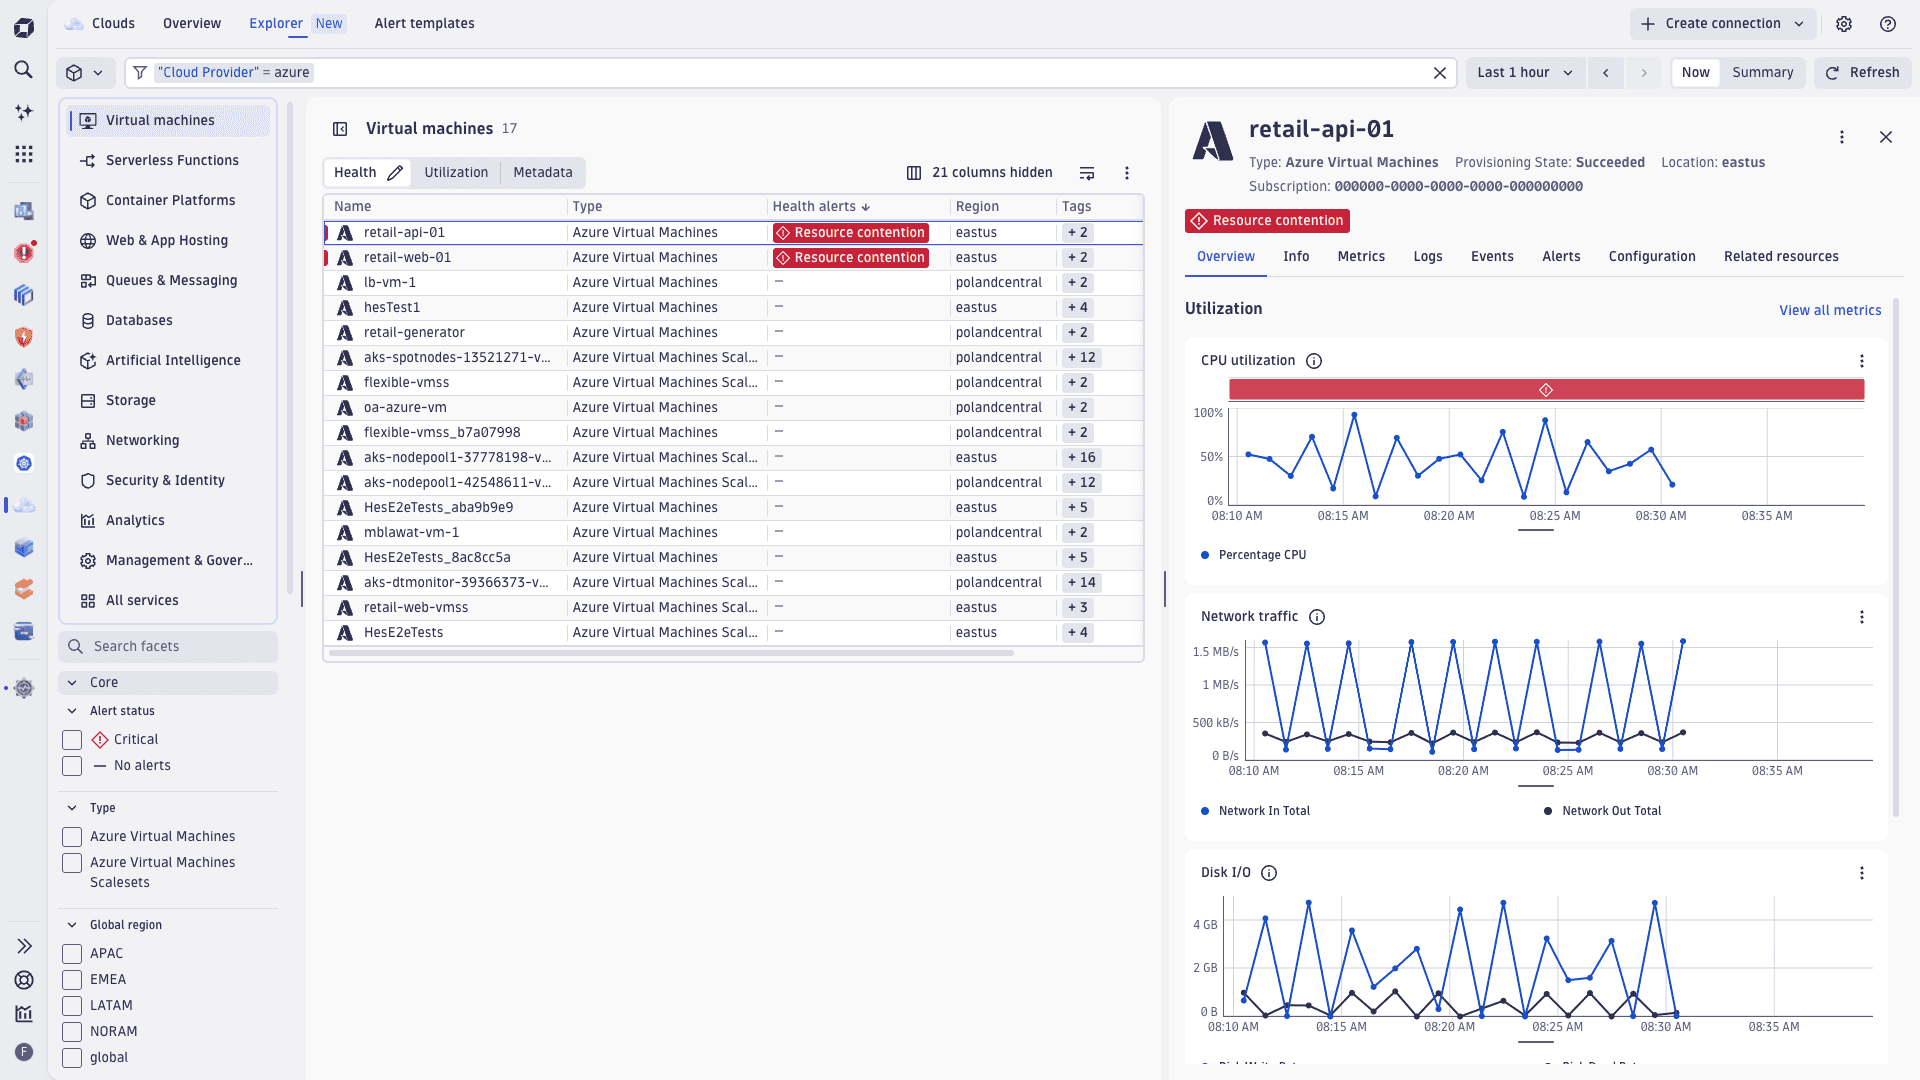
New Clouds experience for Azure lets you optimize cloud operations at scale
We’ve extended the enhanced version of  Clouds to deliver deeper, actionable insights and context; greater usability; and enhanced troubleshooting for monitored Azure cloud environments.
Based on a new Azure cloud connection, metrics, logs, metadata, and topology are unified into a single AI-powered platform that delivers complete visibility and actionable insights at scale. This expanded Azure capability is part of our comprehensive Cloud Ops solution that is already available for AWS, ensuring a unified experience across multiple cloud platforms.
-
Opinionated insights and ready-made dashboards powered by enriched Azure telemetry and cloud context help users quickly assess health and troubleshoot faster.
-
Pre-configured health alerts are available for Azure in Clouds. Alerts are configured directly in
Clouds, where you can define them, drill down into data points, and search and filter resources. -
Broad and comprehensive Azure metrics coverage gives you a complete view of your Azure infrastructure by enabling the polling of any Azure Monitor native platform metric for any service.
-
An easy onboarding and lifecycle management experience to onboard Azure subscriptions, turn them into native Dynatrace Azure connections, and manage them holistically from
Clouds. -
A cloud-native, low-ops setup that's fully managed by Dynatrace SaaS. There’s no need to deploy ActiveGate compute resources for metric polling within your Azure environment.
-
A rich Azure topology inventory that periodically scans Azure environments to build a dynamic inventory of resources enriched with cloud-native metadata (for example, Azure tags and subscription ID). You can visualize discovered resources in
Clouds and leverage DQL for custom analytics.
For more information, see Clouds.
Feature updates
AI Observability | AI Observability
Enable observability for AI coding agents
Dynatrace now provides observability guidance and public GitHub examples for AI coding agents, including Claude Code, Google Gemini CLI, OpenAI Codex CLI, OpenCode, OpenClaw, and GitHub Copilot SDK. You can configure OpenTelemetry export to send coding-agent traces, metrics, and logs to Dynatrace and analyze session activity, token usage, cost, model calls, tool behavior, errors, and engineering workflow signals.
Application Observability
Service Detection v2 for AWS Lambda (Early Access)
Service Detection v2 (SDv2) support for AWS Lambda functions is now Early Access. It provides a single unified ruleset for both OpenTelemetry and OneAgent instrumentation.
Lambda functions are automatically detected as services and named according to the originating function’s name. SDv2 applies the same HTTP endpoint detection rules used for other service types, so HTTP-triggered functions get pattern-matched, aggregatable route endpoints.
This release also introduces three new FaaS-specific metrics available across all FaaS services.
- Invocation count and failure count
- Invocation duration
- Trigger type breakdown (HTTP, SQS, S3, Kinesis, etc.)
For more information, including activation steps, see Activate SDv2 for AWS Lambda services.
Application Observability
SLO app templates use new Smartscape entities
 Service-Level Objectives is now fully native to Latest Dynatrace, as all nine built-in templates for services, hosts, and Kubernetes have been migrated to Smartscape 2.0 entities. Platform Engineers now get accurate, topology-aware SLO evaluation across modern cloud environments.
Application Observability | Distributed Tracing
Improved ready-made dashboard for Full-Stack ATM and trace capture
We’ve improved the Full-Stack Adaptive Traffic Management and trace capture ready-made dashboard.
To use the dashboard, go to  Dashboards > Ready-made dashboards > Full-Stack Adaptive Traffic Management and trace capture.
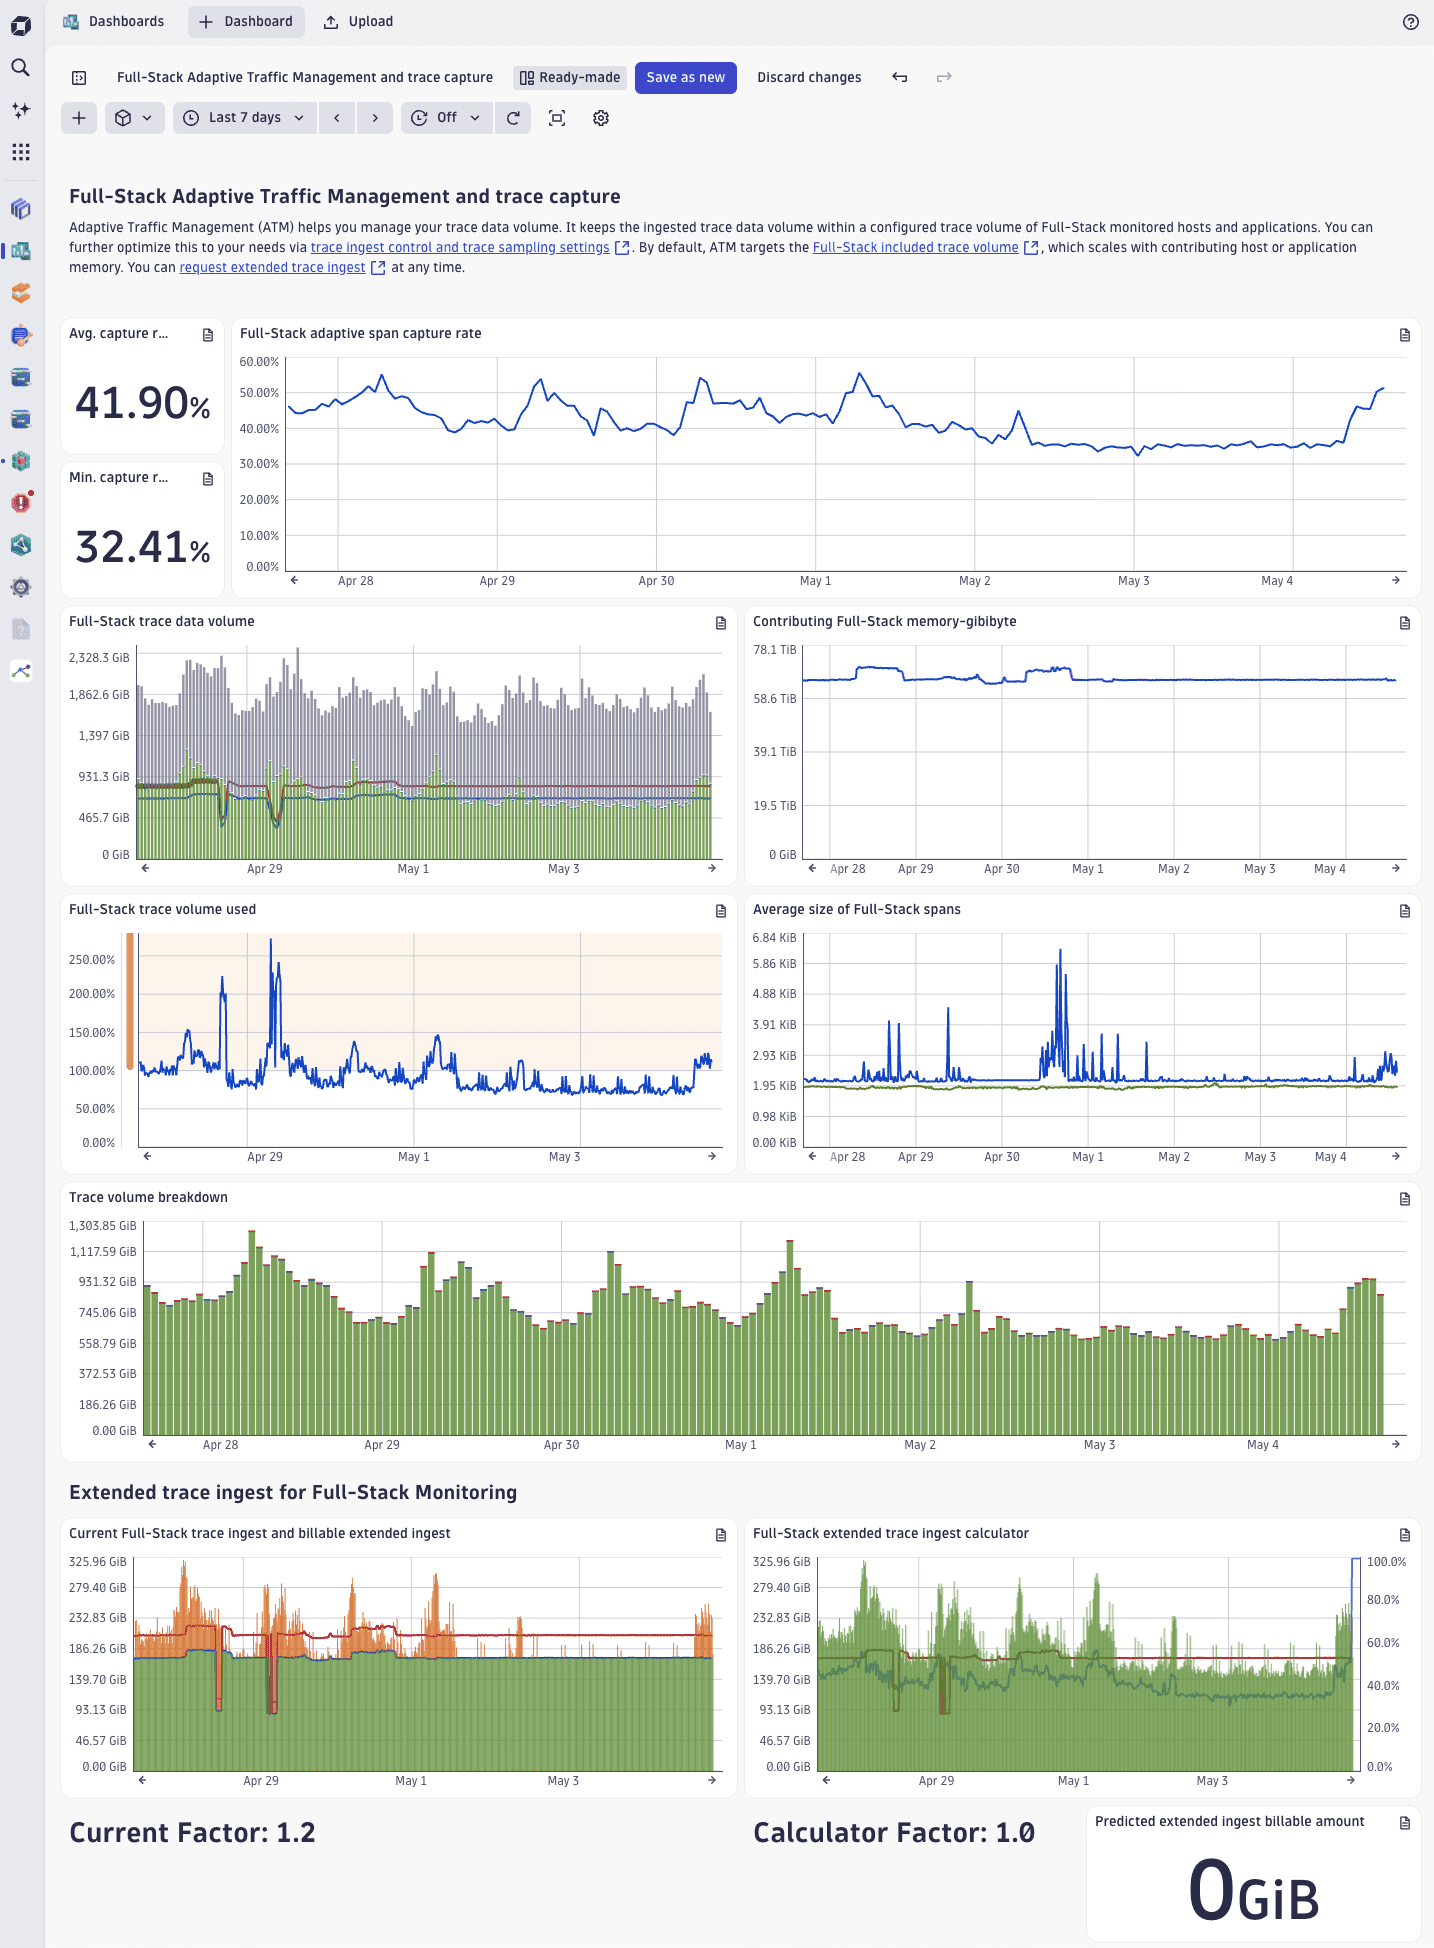
More accurate capture rate metric
The capture rate tiles and chart now use the span capture rate: dt.sfm.spans.ingest.count is compared against dt.sfm.spans.ingest.estimated_count and the results are filtered for fullstack-adaptive. The new span metric captures exactly the volume relevant to ATM and directly feeds into its calculations.
Previously, the tiles just showed request/trace capture rate metrics. These metrics measured all transactions processed by OneAgent before any sampling rules or traffic reduction, and across all license types, which made them a poor reflection of what ATM actually controls.
Full-Stack trace data volume compares potential ingest and actual ingest
The trace data volume chart now visualizes:
- Ingested adaptive bytes (what was actually captured).
- Potential adaptive bytes (what ATM dropped to stay within the limit).
- Fixed-rate ingested bytes (OpenTelemetry and other non-adaptive sources).
- Adaptive limit line (the usable adaptive trace volume per minute).
This makes it immediately visible how much trace data volume is available, and how much is actually being captured.
Extended ingest factor now visible
A new dashboard variable shows the currently configured extended trace ingest factor (equal to the configured limit divided by the included limit). This way you can see, at a glance, if the default included volume has been extended—and by how much.
Application Observability | Services
Extend your Smartscape service names with the OTel service.name attribute
You can now use the OTel service.name attribute to customize the name of SDv1 services. In Smartscape, the service’s name will be enriched with the custom name in the form service.name (detected name). This affects the service name in all Smartscape use cases, and the dt.service.name attribute on spans and metrics.
Application Security
Multi-architecture support for Kubernetes Security Posture Management (KSPM)
The Kubernetes Node Configuration Collector (NCC) supports multi-architecture deployments for the following architectures.
- linux/amd64
- linux/arm64
- linux/ppc64le
- linux/s390x
Infrastructure Observability
New drill-downs from cloud entities in Clouds
Clouds now has new drill-downs from cloud entities (EC2, EKS, Lambda, and RDS) to the applicable Dynatrace app.
Infrastructure Observability | Clouds
Improved AWS service log parsing via our new cloud platform Firehose integration
We've upgraded our native log parsing and analytics for several AWS services, including Amazon ElastiCache, AWS Route 53, Amazon OpenSearch Service, Amazon EKS, Amazon MSK, Amazon RDS, and Amazon API Gateway. These enhancements provide better extraction of log levels, status codes, and additional fields.
These improvements are now available as pre-configured processing bundles in the OpenPipeline ingest source, Data Acquisition - AWS Data Firehose, with no configuration changes needed. Log parsers for other existing AWS services not mentioned in this release remain unchanged.
For details on log streaming via Amazon Data Firehose, see AWS logs.
Infrastructure Observability | Databases
New dedicated bucket for database monitoring improves performance
We’ve introduced a dedicated bucket (default_database_monitoring) to store monitoring logs generated by the official database extensions.  Databases now filters via this bucket, which improves app performance. All queries run from Databases are free, so the app is zero-rated.
Infrastructure Observability | Infrastructure & Operations
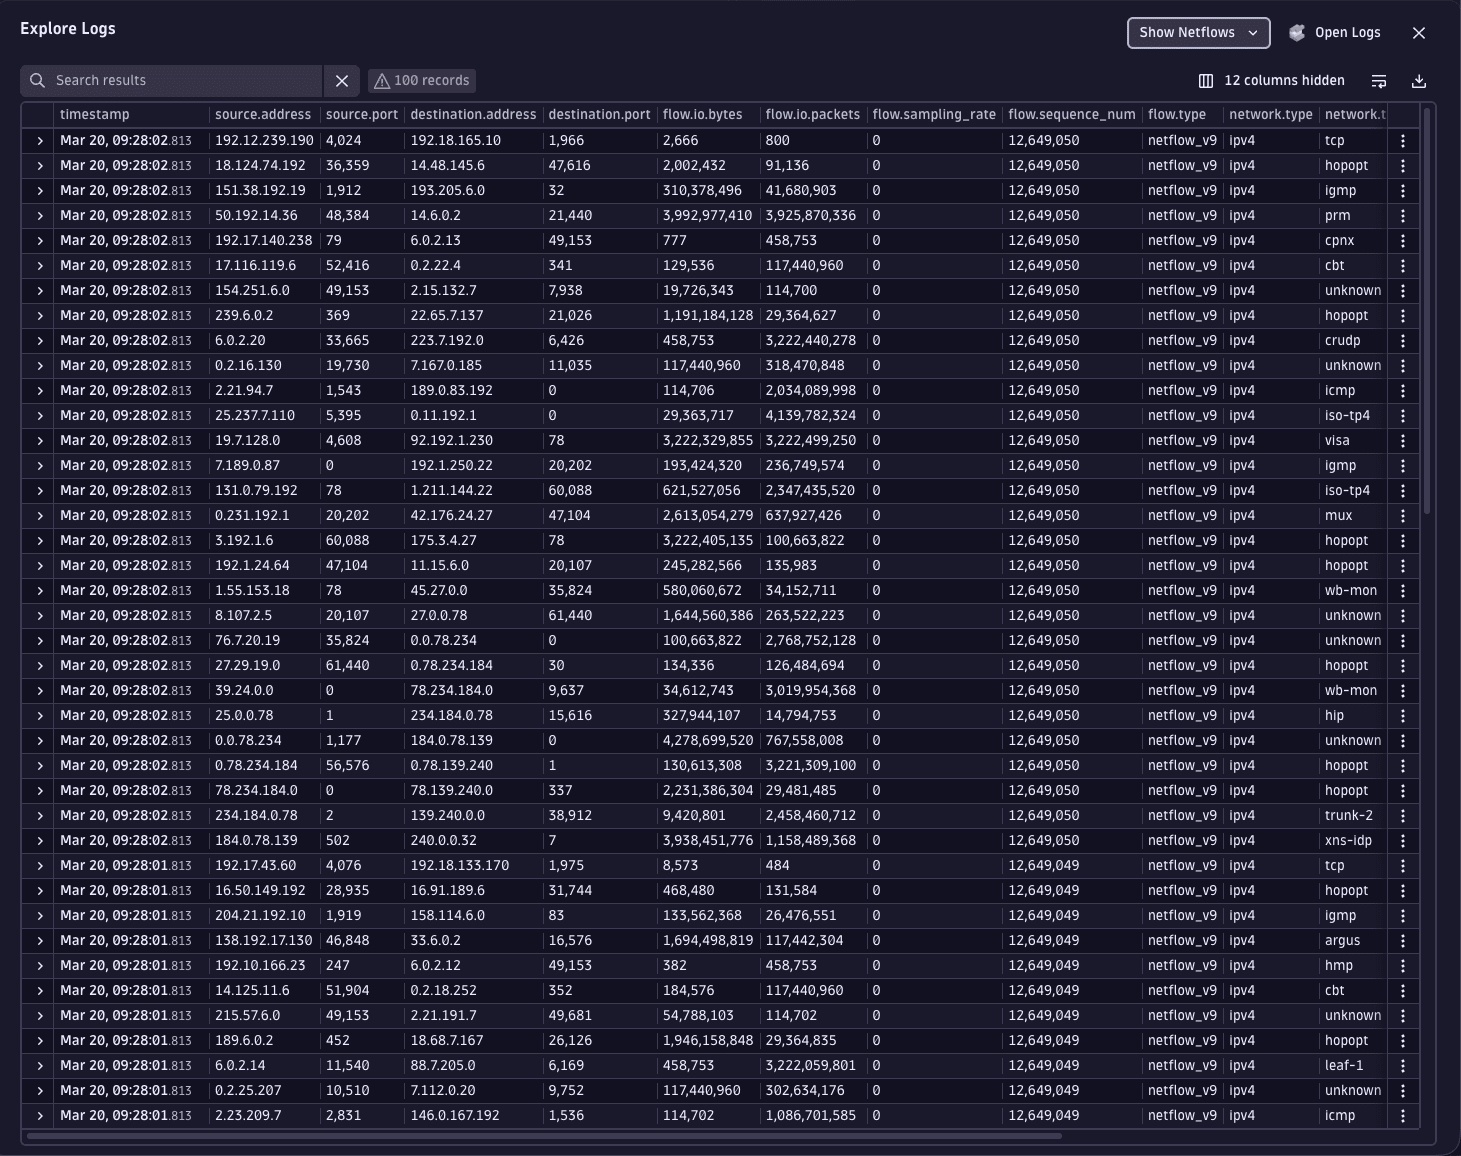
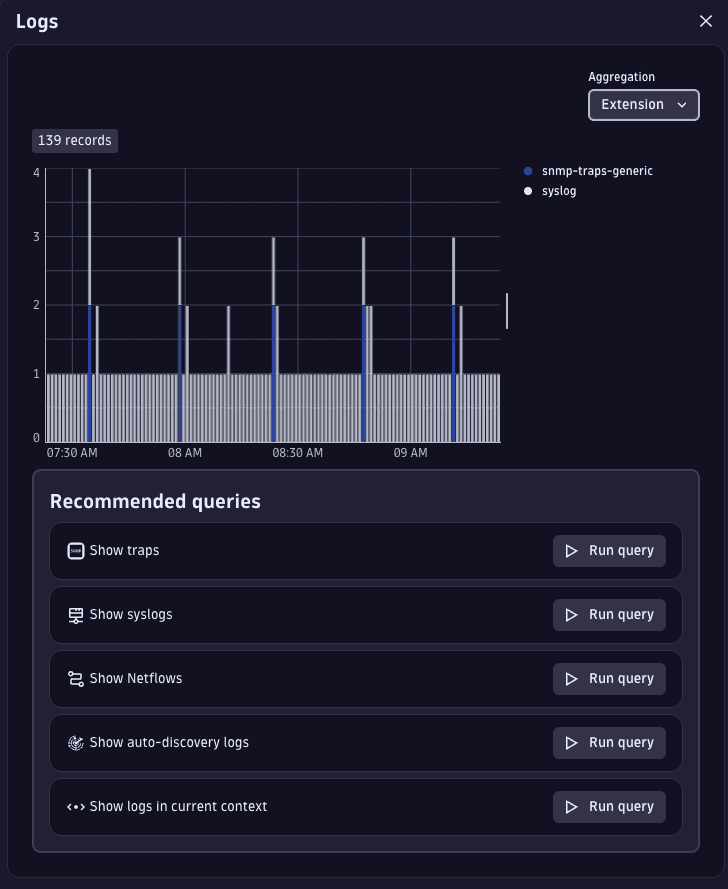
Improved display of traps and logs in Infrastructure & Operations
We’ve improved the display of traps and logs in  Infrastructure & Operations. In the Traps & Logs interface, recommended queries for traps, syslogs, netflows, and auto-discovery logs now automatically select the most relevant columns to display. The log chart has been enhanced with color-coded aggregations for status, extension, and OpenTelemetry, to show the source of network logs.
Infrastructure Observability | Kubernetes
Insights into your ActiveGate health via ") Kubernetes
Kubernetes
Kubernetes now features improved health monitoring for ActiveGates in your Kubernetes deployments. Updates include:
- In-app pop-up messages warn when resource consumption issues, such as high memory usage, are detected.
- The Recommendation section, which is also linked to from these warning messages, shows all ActiveGates with resource consumption issues.
- The Kubernetes monitoring statistics ready-made dashboard is extended with detailed insights into your ActiveGates usage and health. This dashboard is linked to from the Recommendation section.
Features are available for all existing environments, and can also be explored in Playground.
Platform
Create your Dynatrace trial now across 20+ regions on AWS, Azure, and Google Cloud via dynatrace.com
When starting a trial on https://dynatrace.com/signup, you can now choose from 20+ Dynatrace Platform regions across AWS, Azure, and Google Cloud.
Platform
Switch between searched timeframes faster with recently used history
Dynatrace now remembers recently used timeframes in searches and queries. You can apply these recent timeframes with a single click, so there’s no need to manually re-enter dates and times when investigating patterns or comparing data across different periods.
The saved timeframe history captures all valid selections including presets, manual entries, calendar picks, time shifts, and more. Automatic deduplication keeps your list clean and relevant.
Platform
New default pipeline rule for internal log data from Dynatrace database monitoring extensions
We’ve added a new default bucket assignment rule for certain log pipelines that handle internal data from Dynatrace database monitoring extensions. This rule does not impact customer or database logs.
The new default rule is always applied first and cannot be overwritten. It affects pipelines that take internal data from official Dynatrace database monitoring extensions and store this data in the default_database_monitoring bucket. The extensions include:
com.dynatrace.extension.postgrescom.dynatrace.extension.sql-oraclecom.dynatrace.extension.sql-db2com.dynatrace.extension.sql-snowflakecom.dynatrace.extension.sql-servercom.dynatrace.extension.mysqlcom.dynatrace.extension.sql-sap-hanacom.dynatrace.extension.mariadb
Platform | Dashboards
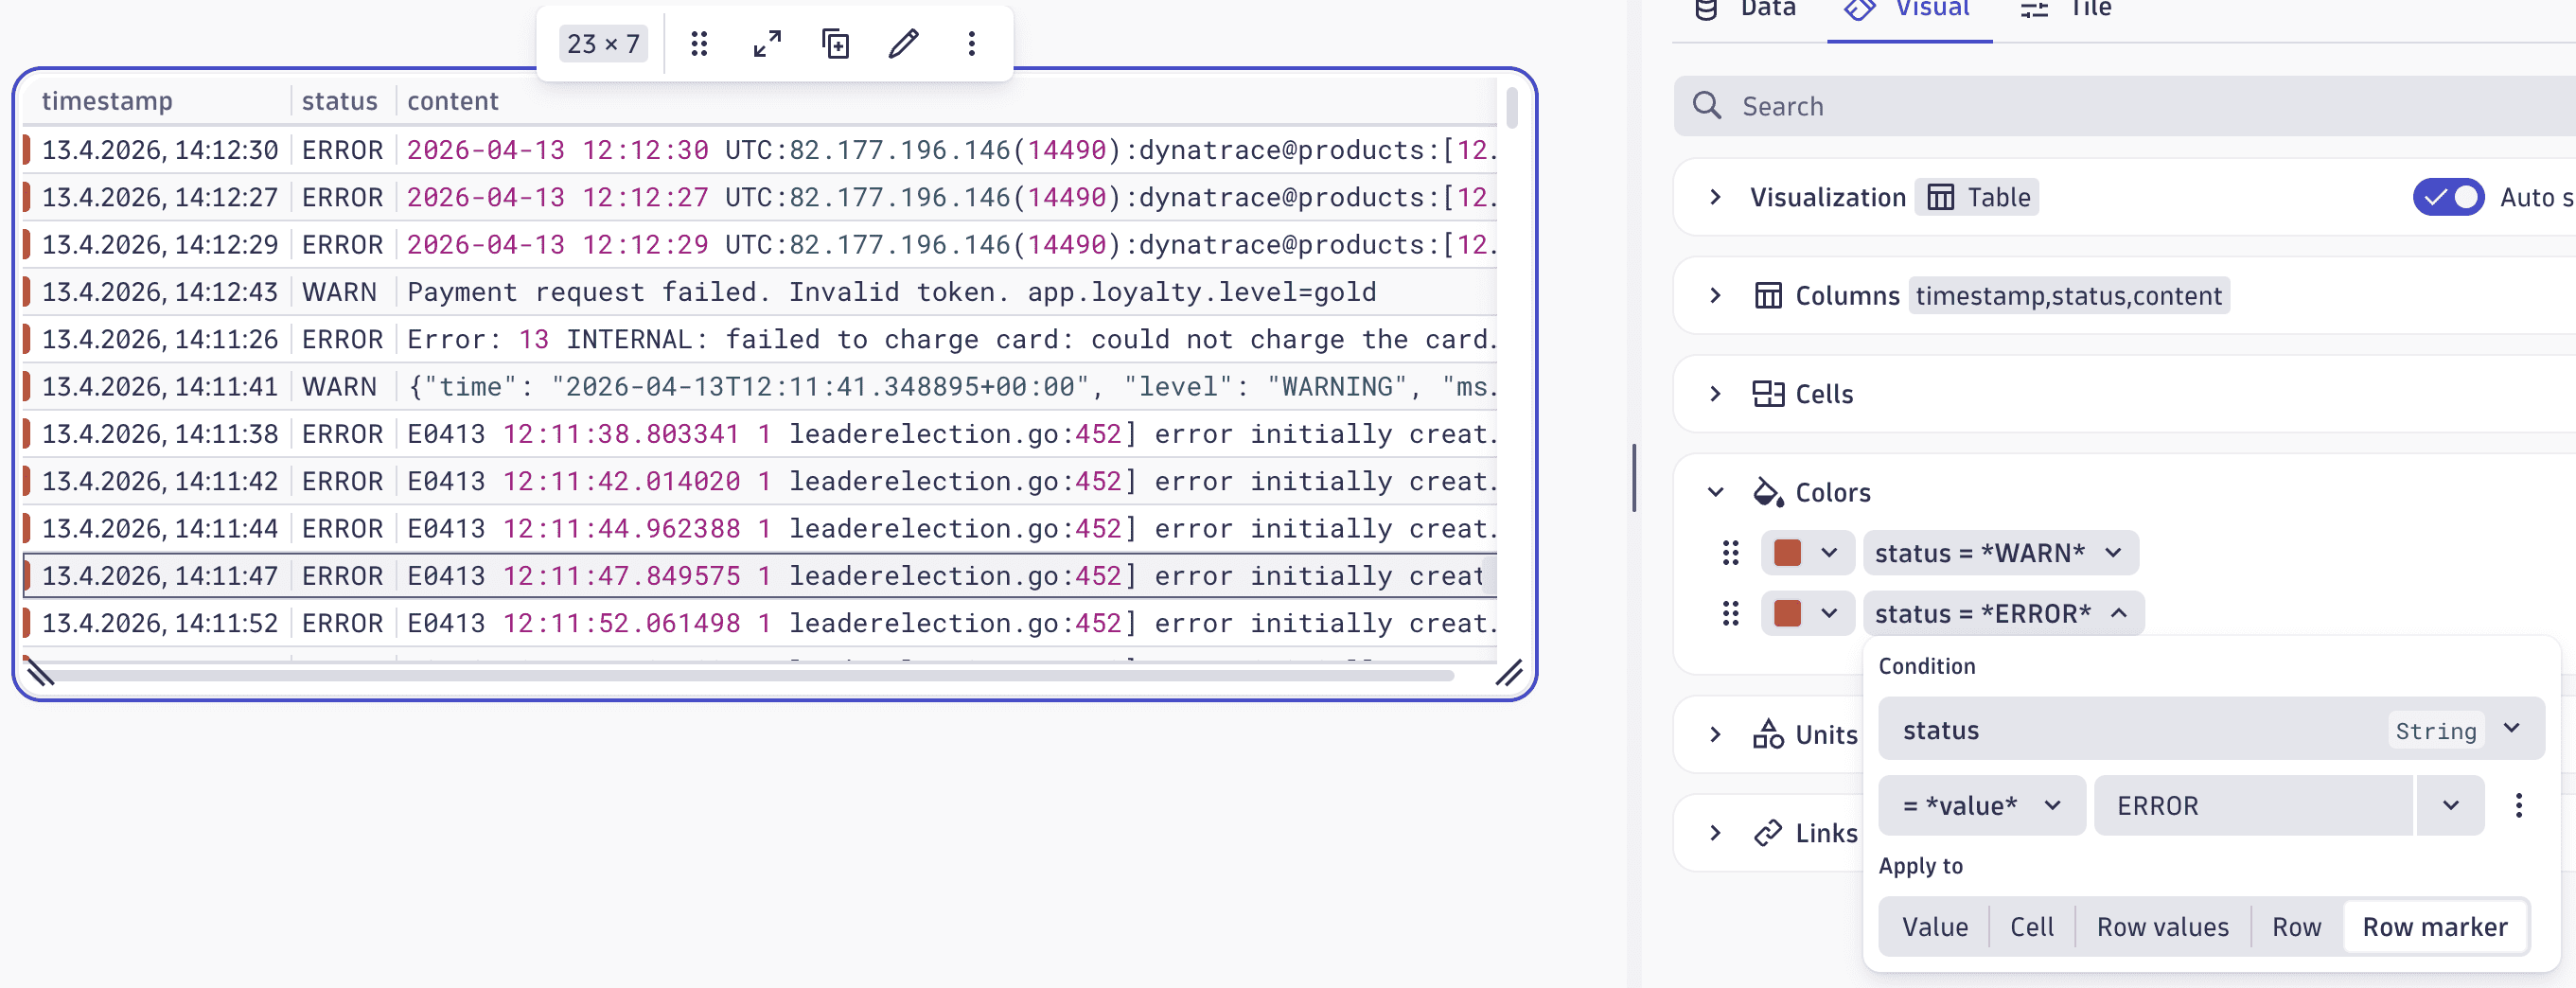
Visually group table rows with the new row marker coloring option
We’ve added a new way to highlight rows and enhance table coloring in Dashboards and  Notebooks. You can now display a colored marker on the left side of a table row, which makes it easy to visually group related rows.
Find the new option in the table color settings for Dashboards or Notebooks: Edit > Visual > Colors > select Condition > Apply to > Row.
Platform | Dashboards
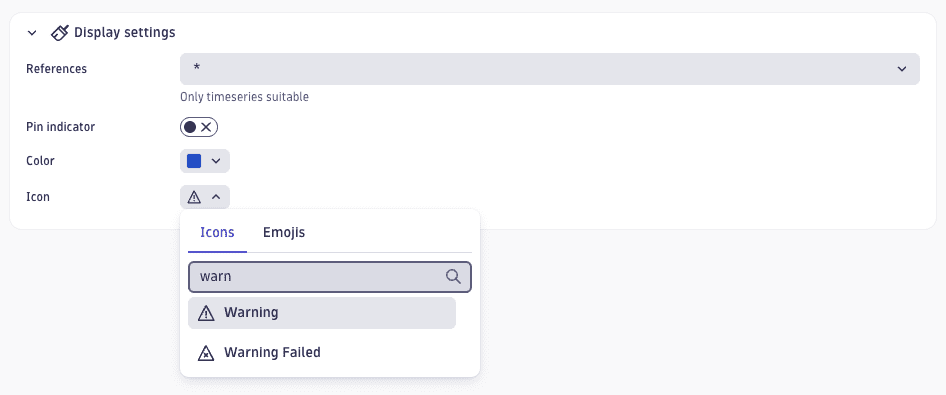
Customize annotation appearance with color and icon settings
You can now set a custom color and icon for each annotation in the Display settings section in Dashboards. The color applies to both the annotation marker and the pin indicator highlight on the chart. When you select an icon, it replaces the annotation label text on the chart. The default color is blue, and the annotation name is displayed as text.
Platform | Dynatrace Intelligence
Standardized severity classification for Dynatrace alerts and problems
Dynatrace now introduces a standardized event.severity field for Dynatrace alerts and problems, which gives you a consistent way to classify and act on problems across your observability workflows. The field is aligned with the ITIL Incident Management framework.
event.severity is stored in Grail as an integer (from 1–5, with 1 being the highest), and is visible in Dynatrace as a human-readable label. Values are described in the table below:
| Value | Label | Description |
|---|---|---|
| Critical | Major business disruption; service outage |
| Major | Significant impact; workaround may exist |
| Minor | Limited or non-critical impact |
| Warning | Low impact; no business disruption |
| Informational | No business impact |
The value is automatically propagated from correlated alerts to the parent problem. If two or more alerts have different event severities, the problem will always take the highest severity. For example, a problem that groups minor and critical alerts will itself have a Critical severity.
The problem feed now supports filtering by severity, and an optional Severity column with visual icons is available in the problem list view. The field is also available as a condition in  Workflows for alert routing and notification filtering.
Platform | Dynatrace Intelligence
Record-based alerting now available in Anomaly Detection
 Anomaly Detection now supports record-based alerting for custom alerts. You can trigger alerts based on timeseries data or on records. Alert conditions are defined directly in the alert’s DQL query.
To set up custom alerts, go to Anomaly Detection > New alert > Advanced.
An example DQL query is shown below. This will trigger an alert when the given dt.host_group.id has fewer than 10 hosts.
smartscapeNodes HOST| filter startsWith(dt.host_group.id, "cluster")| summarize host_count = count(), by:{dt.host_group.id}| filter host_count < 10
Records are treated as dimensions. Therefore, only use stable dimension fields (such as dt.host_group.id) in the Alert identity field drop-down. Don’t use numeric fields, such as host_count, because their value can change over time.
For more information, see Anomaly detection DQL writing guide.
Platform | Grail
New permission field for metrics and Smartscape data in RUM
You can now use the frontend.name field for metrics and smartscape in your access control policies. Statements like ALLOW storage:metrics:read WHERE storage:frontend.name = "mobile_app" let you selectively control access to metrics and Smartscape data at the record- and field level.
For more information, see Assign Bucket Table Permissions.
Platform | Grail
Optimize DQL queries by drilling down to see which buckets contribute to your query results
Bucket filters are an effective way to optimize DQL queries, particularly in situations where buckets do not contribute any records at all and could therefore be excluded from a future query entirely.
We’ve added a new breakdown of contributions from Grail buckets that were scanned during the query. This data is available in the DQL query’s raw response, within the metadata section. An example is shown below.
{ ... "metadata": { "grail": { ... "contributions": {"buckets": [{"name": "bucket1", "matchedRecordsRatio": 0.734, "scannedBytes": 2341241234},...]} } } }
You can use this information to optimize your query filters, for example by excluding buckets that contribute a significant number of scanned bytes, but where little or now records matched your filters.
Similar information is also provided in query execution events, which are available via fetch dt.system.query_executions.
Platform | OpenPipeline
OpenPipeline extraction processors now suggest recommended fields
OpenPipeline extraction processors now supply a recommended set of fields to be extracted, which helps avoid misconfiguration and exposing sensitive data. Recommendations automatically cover all permission- and cost-relevant fields or dimensions, with support for all Smartscape identifiers and Grail primary tags.
Platform | Settings
Certain Configuration API endpoints are now deprecated
Many Configuration API endpoints are now covered by the Settings endpoints in the Environment API v2. Affected Configuration API endpoints now have deprecation notices.
- No immediate action is required on your part.
- Affected endpoints remain fully active.
- While we haven't set a sunset date, these endpoints may be removed in a future release.
We recommend migrating to the Environment API v2 endpoints for a more robust integration. Review the Configuration API reference to identify affected endpoints and plan your migration to Environment API v2.
Platform | Smartscape
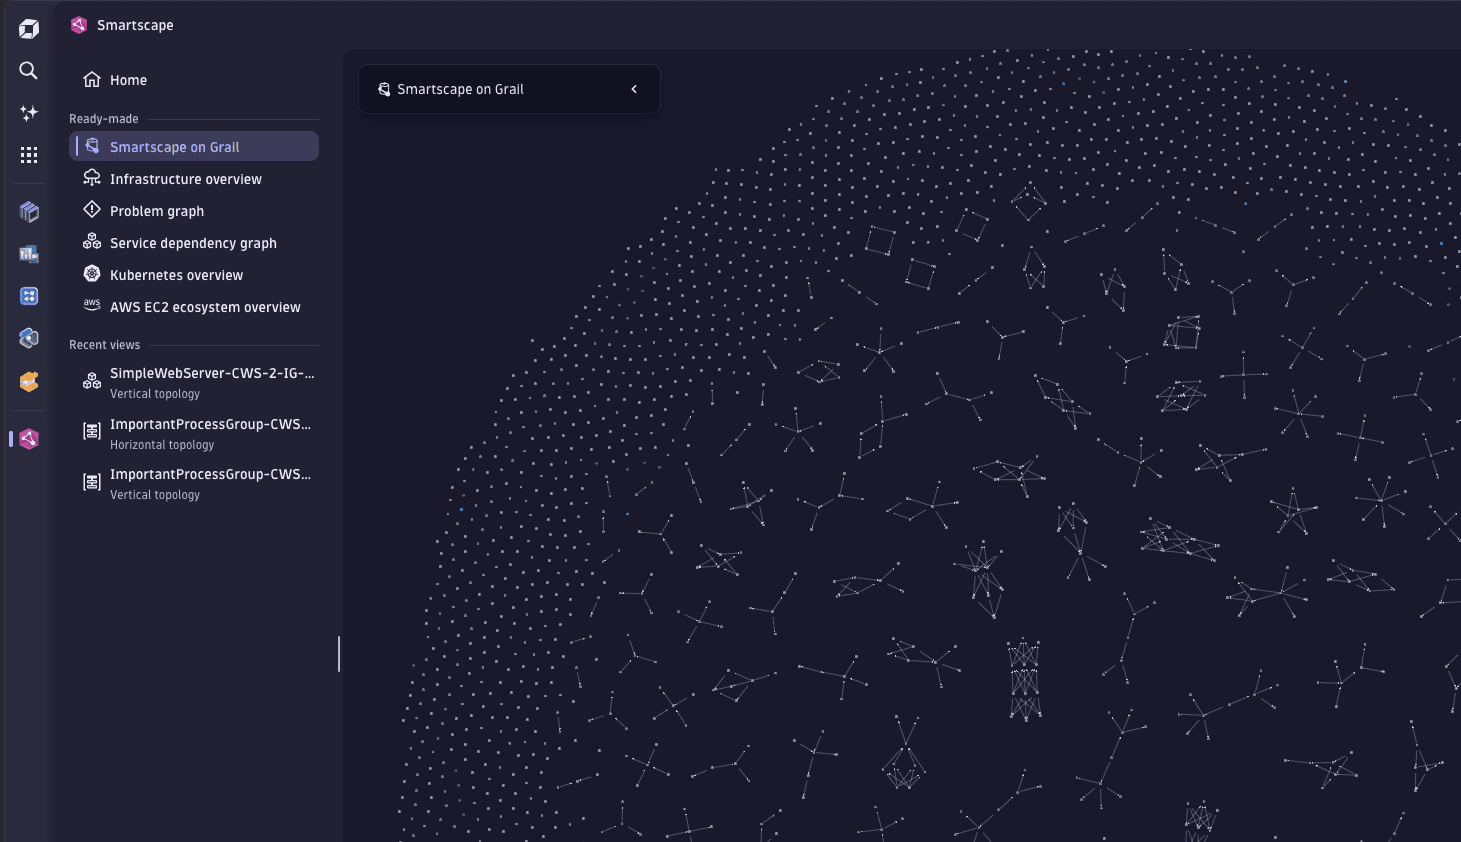
Smartscape now gives instant access to ready-made views and recent investigations
The new Smartscape side panel navigation keeps all six ready-made views one click away, so you can jump between perspectives without going back to the landing page. A dedicated Recent views section gives a quick history of your most recent investigations (including vertical topology, horizontal topology, and visual resolution path views), so you can instantly reopen and compare them as your investigation evolves.
Software Delivery | Ownership
Ownership teams now supported for Smartscape nodes
 Ownership information is now available in Smartscape and for Smartscape nodes. This lets you use Workflows actions (such as
 get_owners) to send automated and targeted notifications to your teams, and you can use Ownership as part of your configuration for contextual entity views in Smartcape.
For more information, see Ownership app.
Software Delivery | Site Reliability Guardian
Duplicate guardians in the Site Reliability Guardian management view
To simplify sharing Site Reliability Guardian blueprints, you can use  Site Reliability Guardian to duplicate guardians and further customize them. This lets you easily reuse similar Guardians, including their definitions, which simplifies your configuration reuse, saves time, and helps you avoid mistakes from manually copying configuration settings.
Breaking changes
Digital Experience | Synthetic
Credential Vault rejects AppEngine credentials with public access and “Allow access without app context”
The Credential Vault now rejects credentials that have all three of the following configuration settings:
- Scoped to AppEngine
- Are public access
- Have Allow access without app context enabled
This policy reduces the risk of accidental credential exposure by preventing credentials that can be used outside an application context from being broadly accessible.
Existing credentials that don't comply with this policy remain available and will continue to work. However, we recommend updating those credentials as soon as possible.
If you attempt to edit a non‑compliant credential, saving the changes will be blocked. You need to first change at least one of the disallowed settings before the credential can be saved.
Digital Experience | Synthetic
Configuration parameter removed from new browser monitor experience schema and API
We removed the performanceMetric parameter from the builtin:synthetic.browser.enablement schema and from EnablementDto on the Synthetic Monitors Environment API v2. This parameter defined which metric was used to display performance charts in the Dynatrace web UI and check performance threshold violations.
Performance alerts continue to use the dt.synthetic.browser(.step).duration metric with no changes in functionality.
Platform | Dynatrace Intelligence
Updated client telemetry attribution for improved analytics queries
Dynatrace Intelligence now provides more detailed context for analytics queries.
Previously, client.source was set to the object ID directly. Now, client.source captures the analyzer name to allow better categorization.
The new client.client_context object provides granular metadata, including dt.task.id (which contains the object ID), dt.task.group, and dt.analyzer.query_type (whether TRAINING for training data or DEFAULT for all other data).
Fixes and maintenance
Resolved issues in this release (SaaS)
- Fixed a behavior for OpenPipeline HTTP ingest sources (for event-related configurations) where records with numbers exceeding 64 bits were dropped. These records are now serialized as a field of type
String. (PPX-10044) - Fixed an issue where certain Smartscape tags (
tags:k8s.labelsandtags:k8s.annotations) were not cleared even though the labels or annotations of the underlying Kubernetes object were removed. (INFOBS-8605) - Fixed an issue in Clouds where the Overview tab didn’t show data for some metrics. (INFOBS-8287)
- Fixed an issue that caused local synthetic playback to show errors on pages instrumented with a RUM JavaScript version earlier than 1.337. (DEM-25634)
- Fixed a bug where exclusion rules were case sensitive in the New Real User Monitoring Experience. (DEM-25603)
- Fixed an issue in Mobile > Web request error details where filtering by
appVersionwould returnHTTP 400errors. (DEM-23630) - Fixed an issue where page resizes were not accounted for when replaying RUM sessions via Session Replay (moving the renderer back in time). (DEM-21951)
- Fixed an issue where tags were not properly displayed when creating an extension configuration in
 Extensions. (DAQ-22770)
 - Fixed an issue where Extensions didn’t correctly display the number of activated extensions. (DAQ-22497)
- Fixed an issue in Service Detection V2 for Logs that caused the IDs to diverge from the correlated traces, if the contributor key was duplicated in both service detection and service splitting. (APPOBS-33817)
- Fixed an issue where the Dynatrace UI timed out on request due to the input having zero monitored entity identifiers (
MEIdentifiers). (APPOBS-33548) - Fixed an issue where anomaly detectors with schema version 1.0.12 or earlier could not be saved when the
actorfield was not explicitly set. (DI-27005) - Added missing support for
OPEN_PIPELINEassets in Extensions. (DAQ-23064) - Fixed an issue where the
dt.source_entityandloglevelattributes were being overwritten by Azure log processing rules. These attributes now retain their original values if set by the source. (APPOBS-33744)